Downloaded 113 times

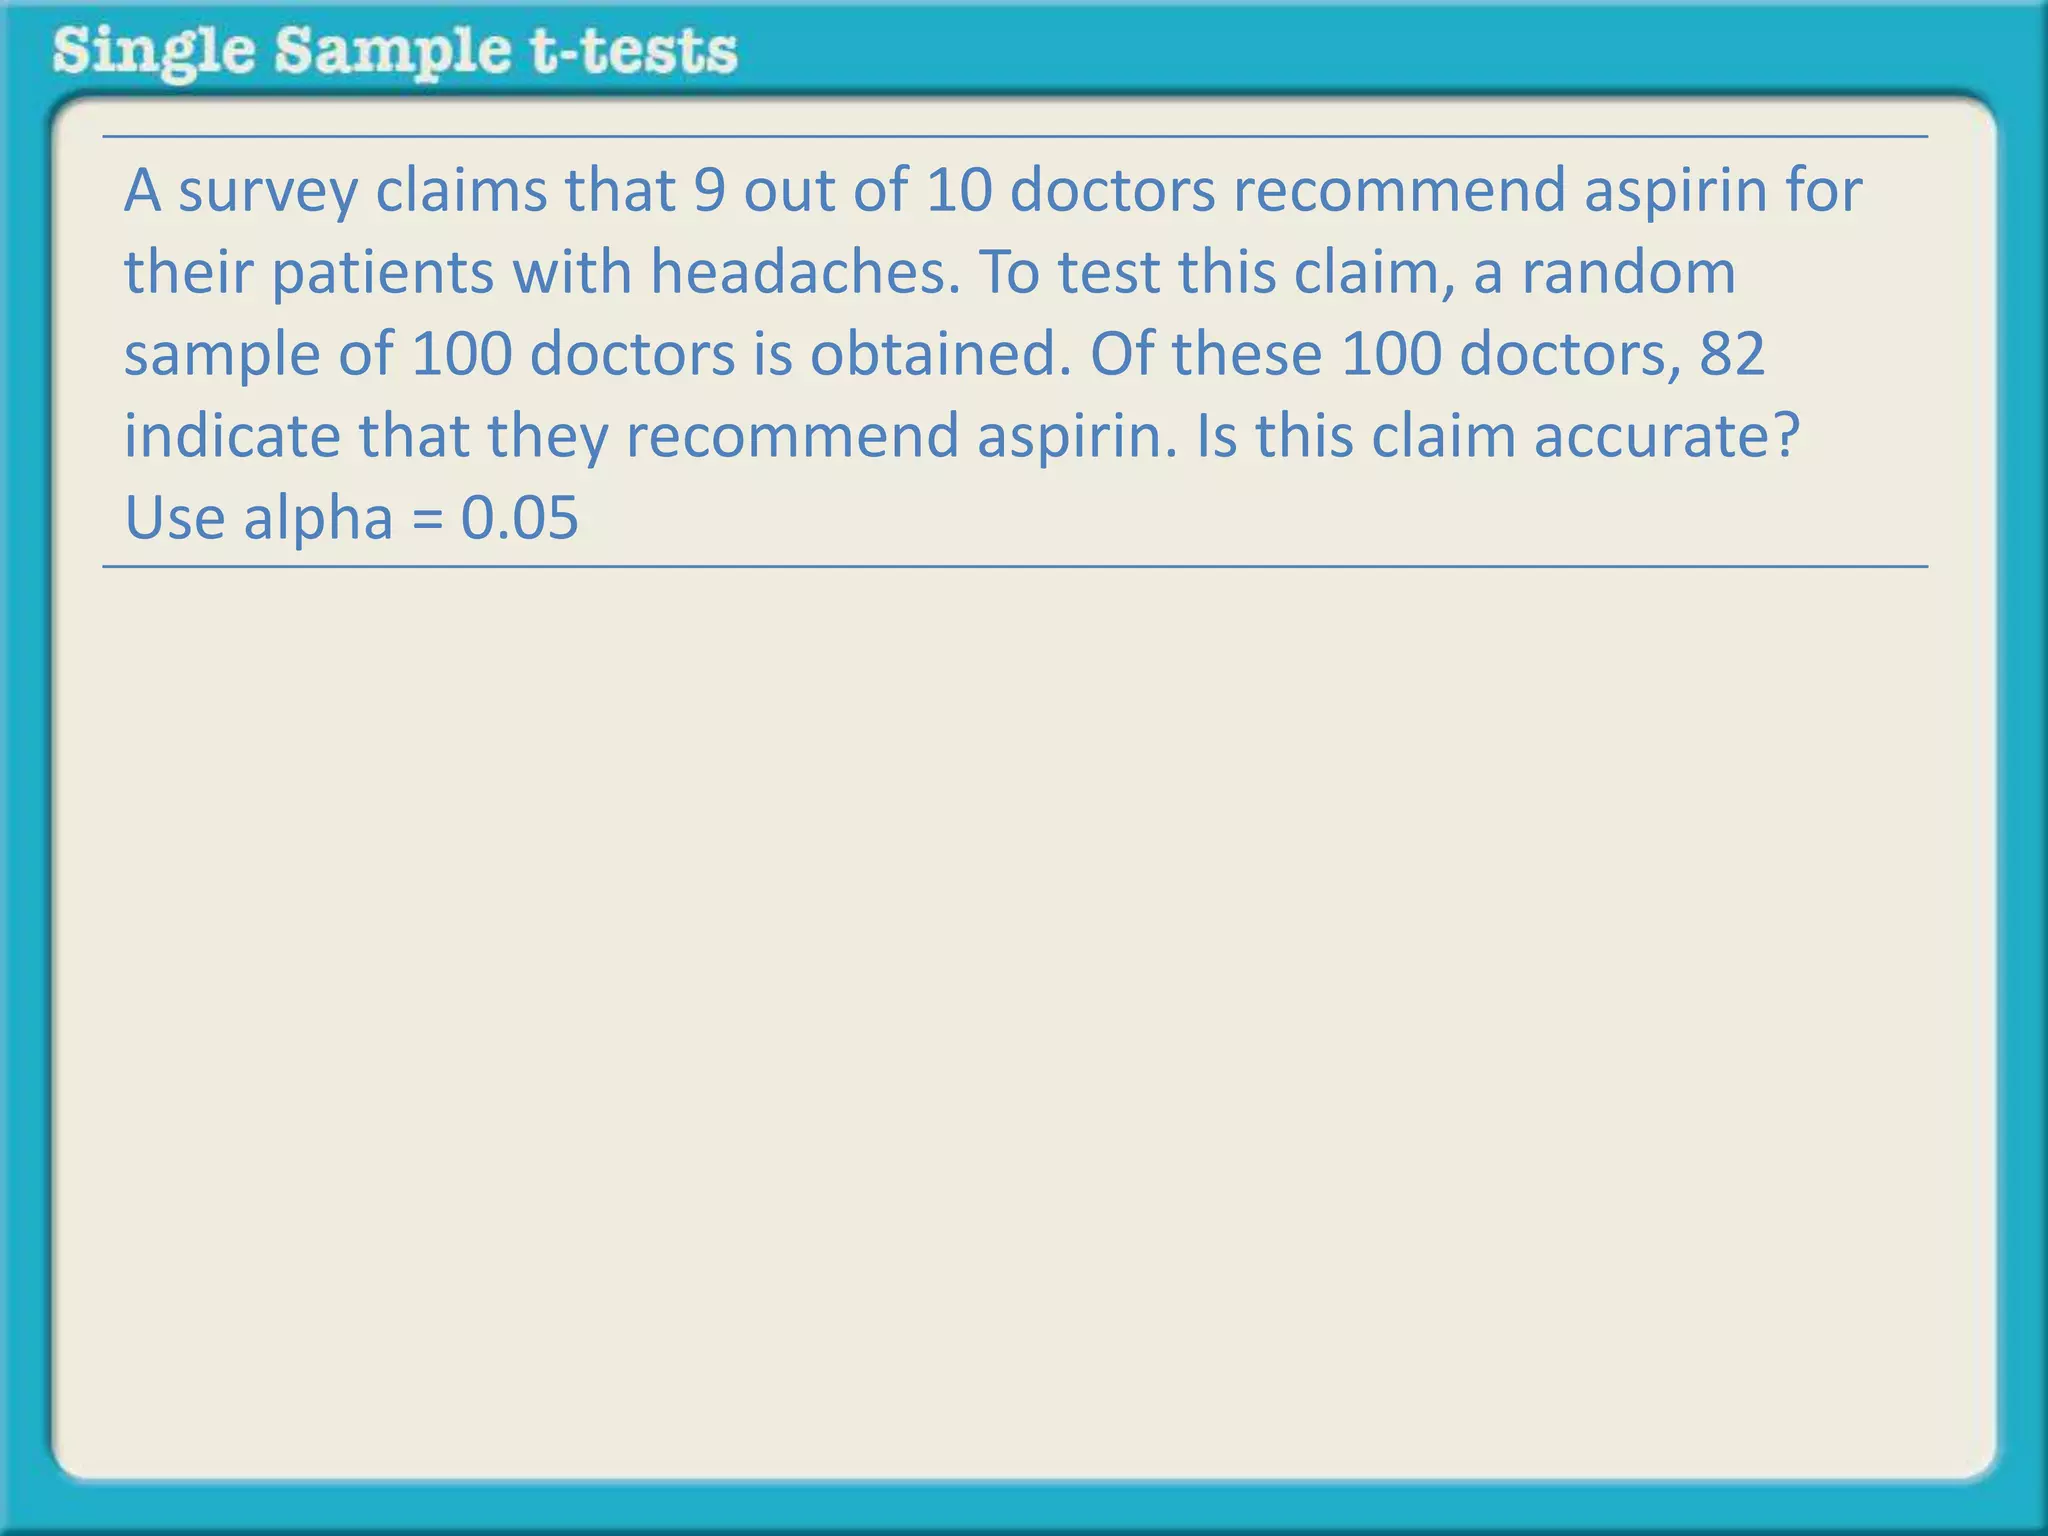
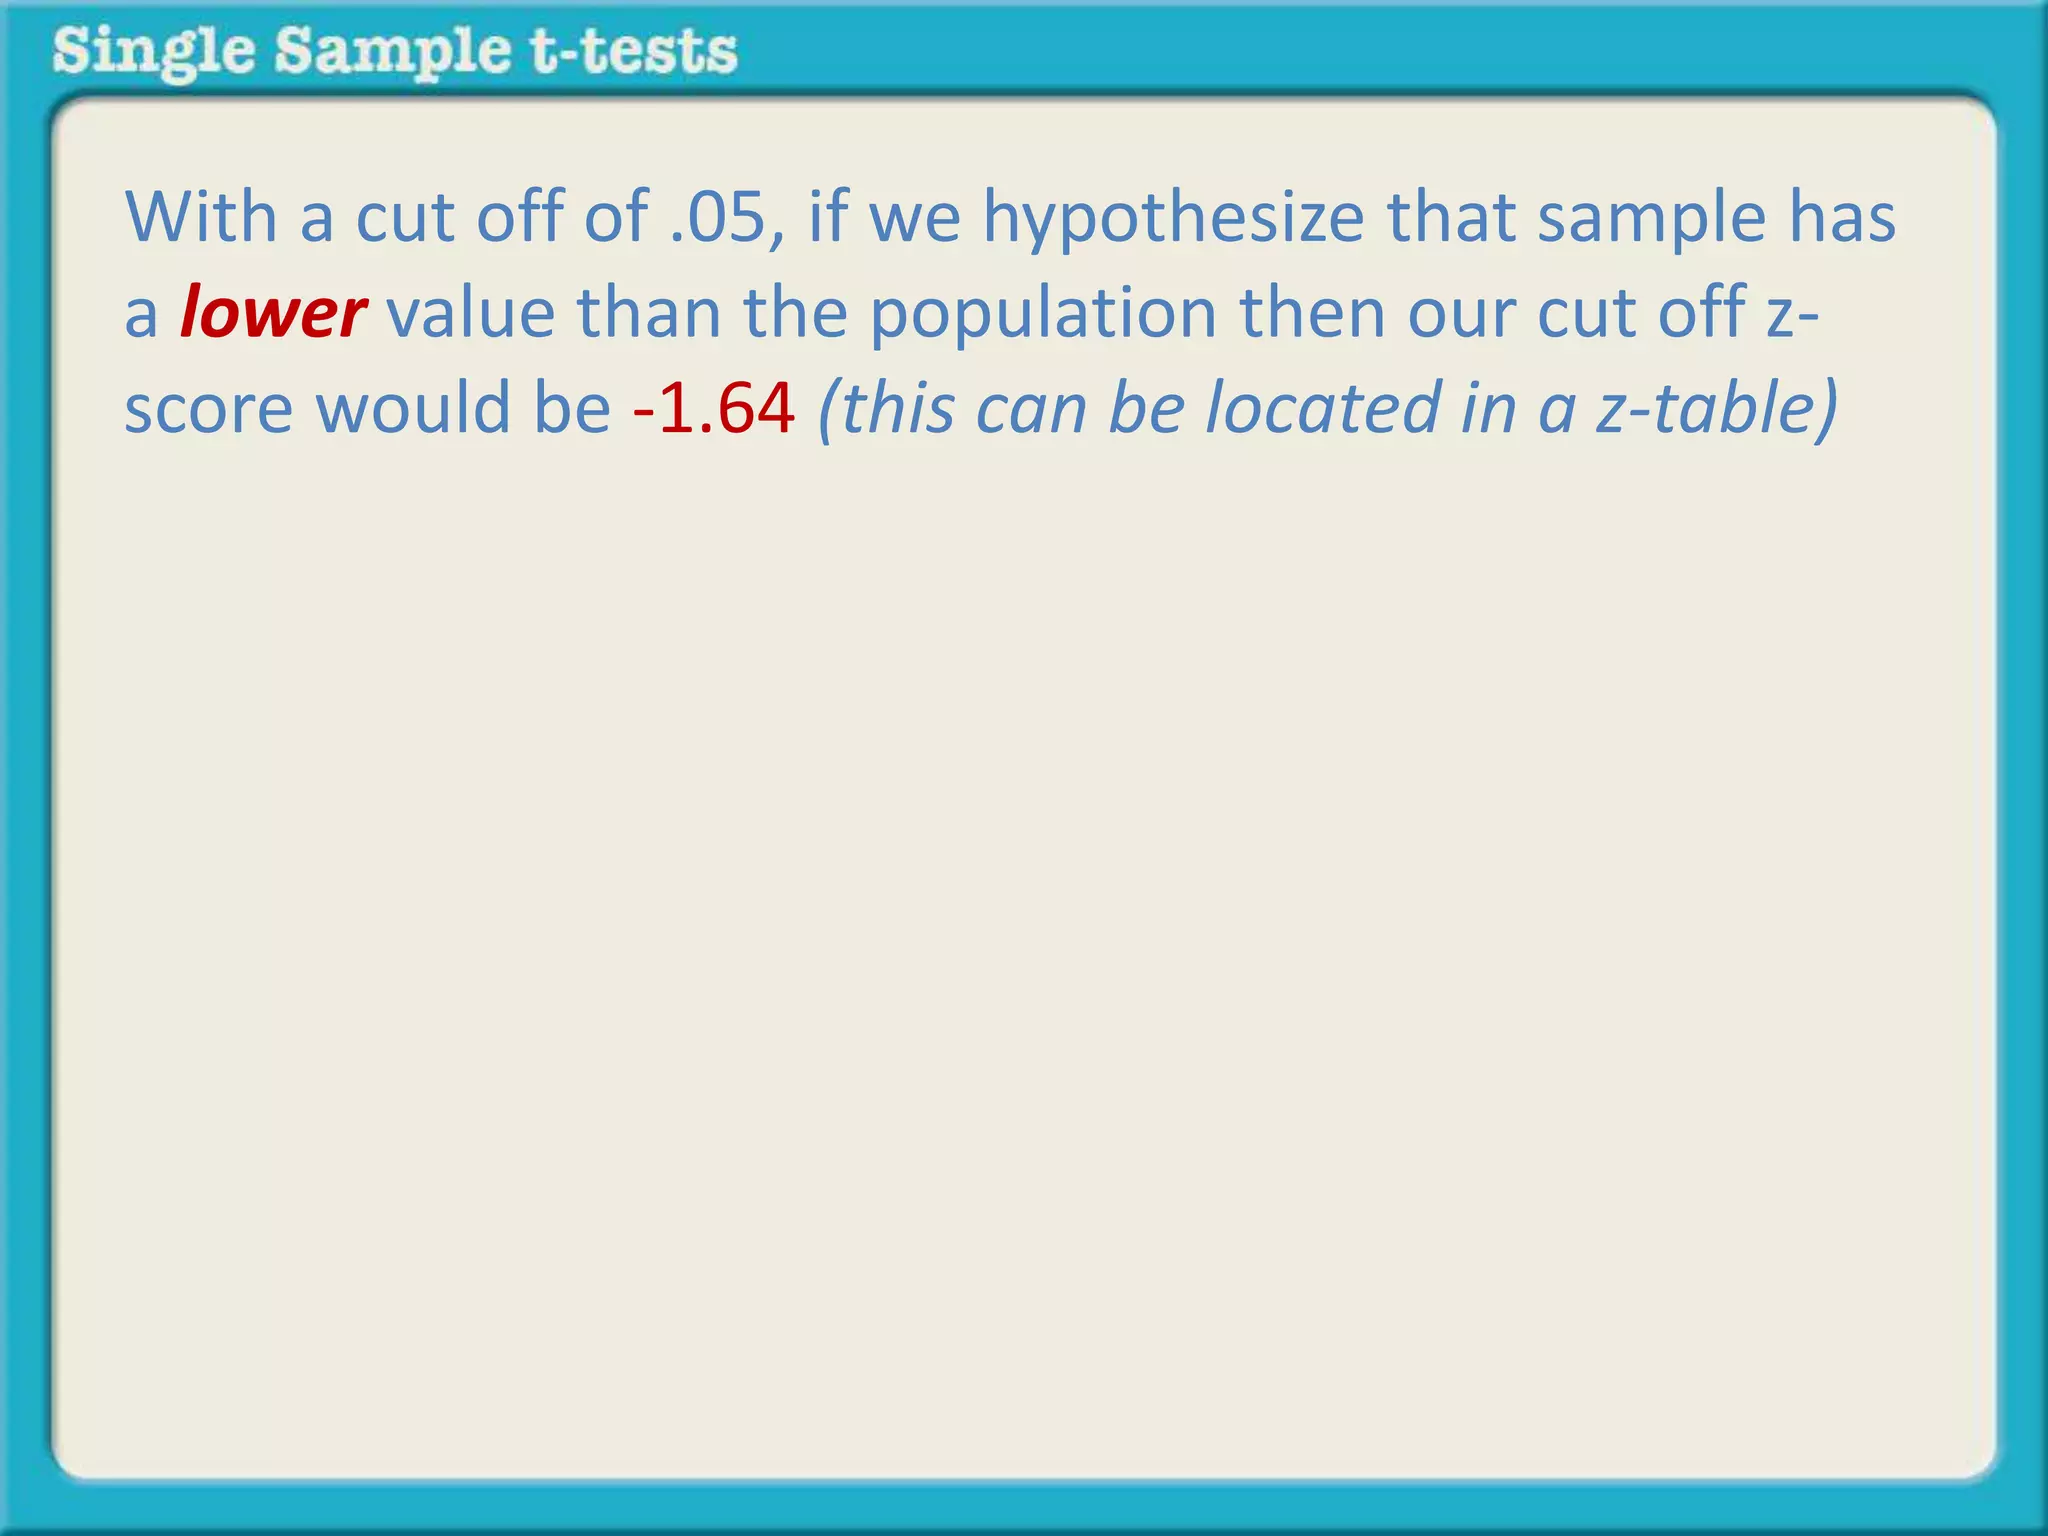
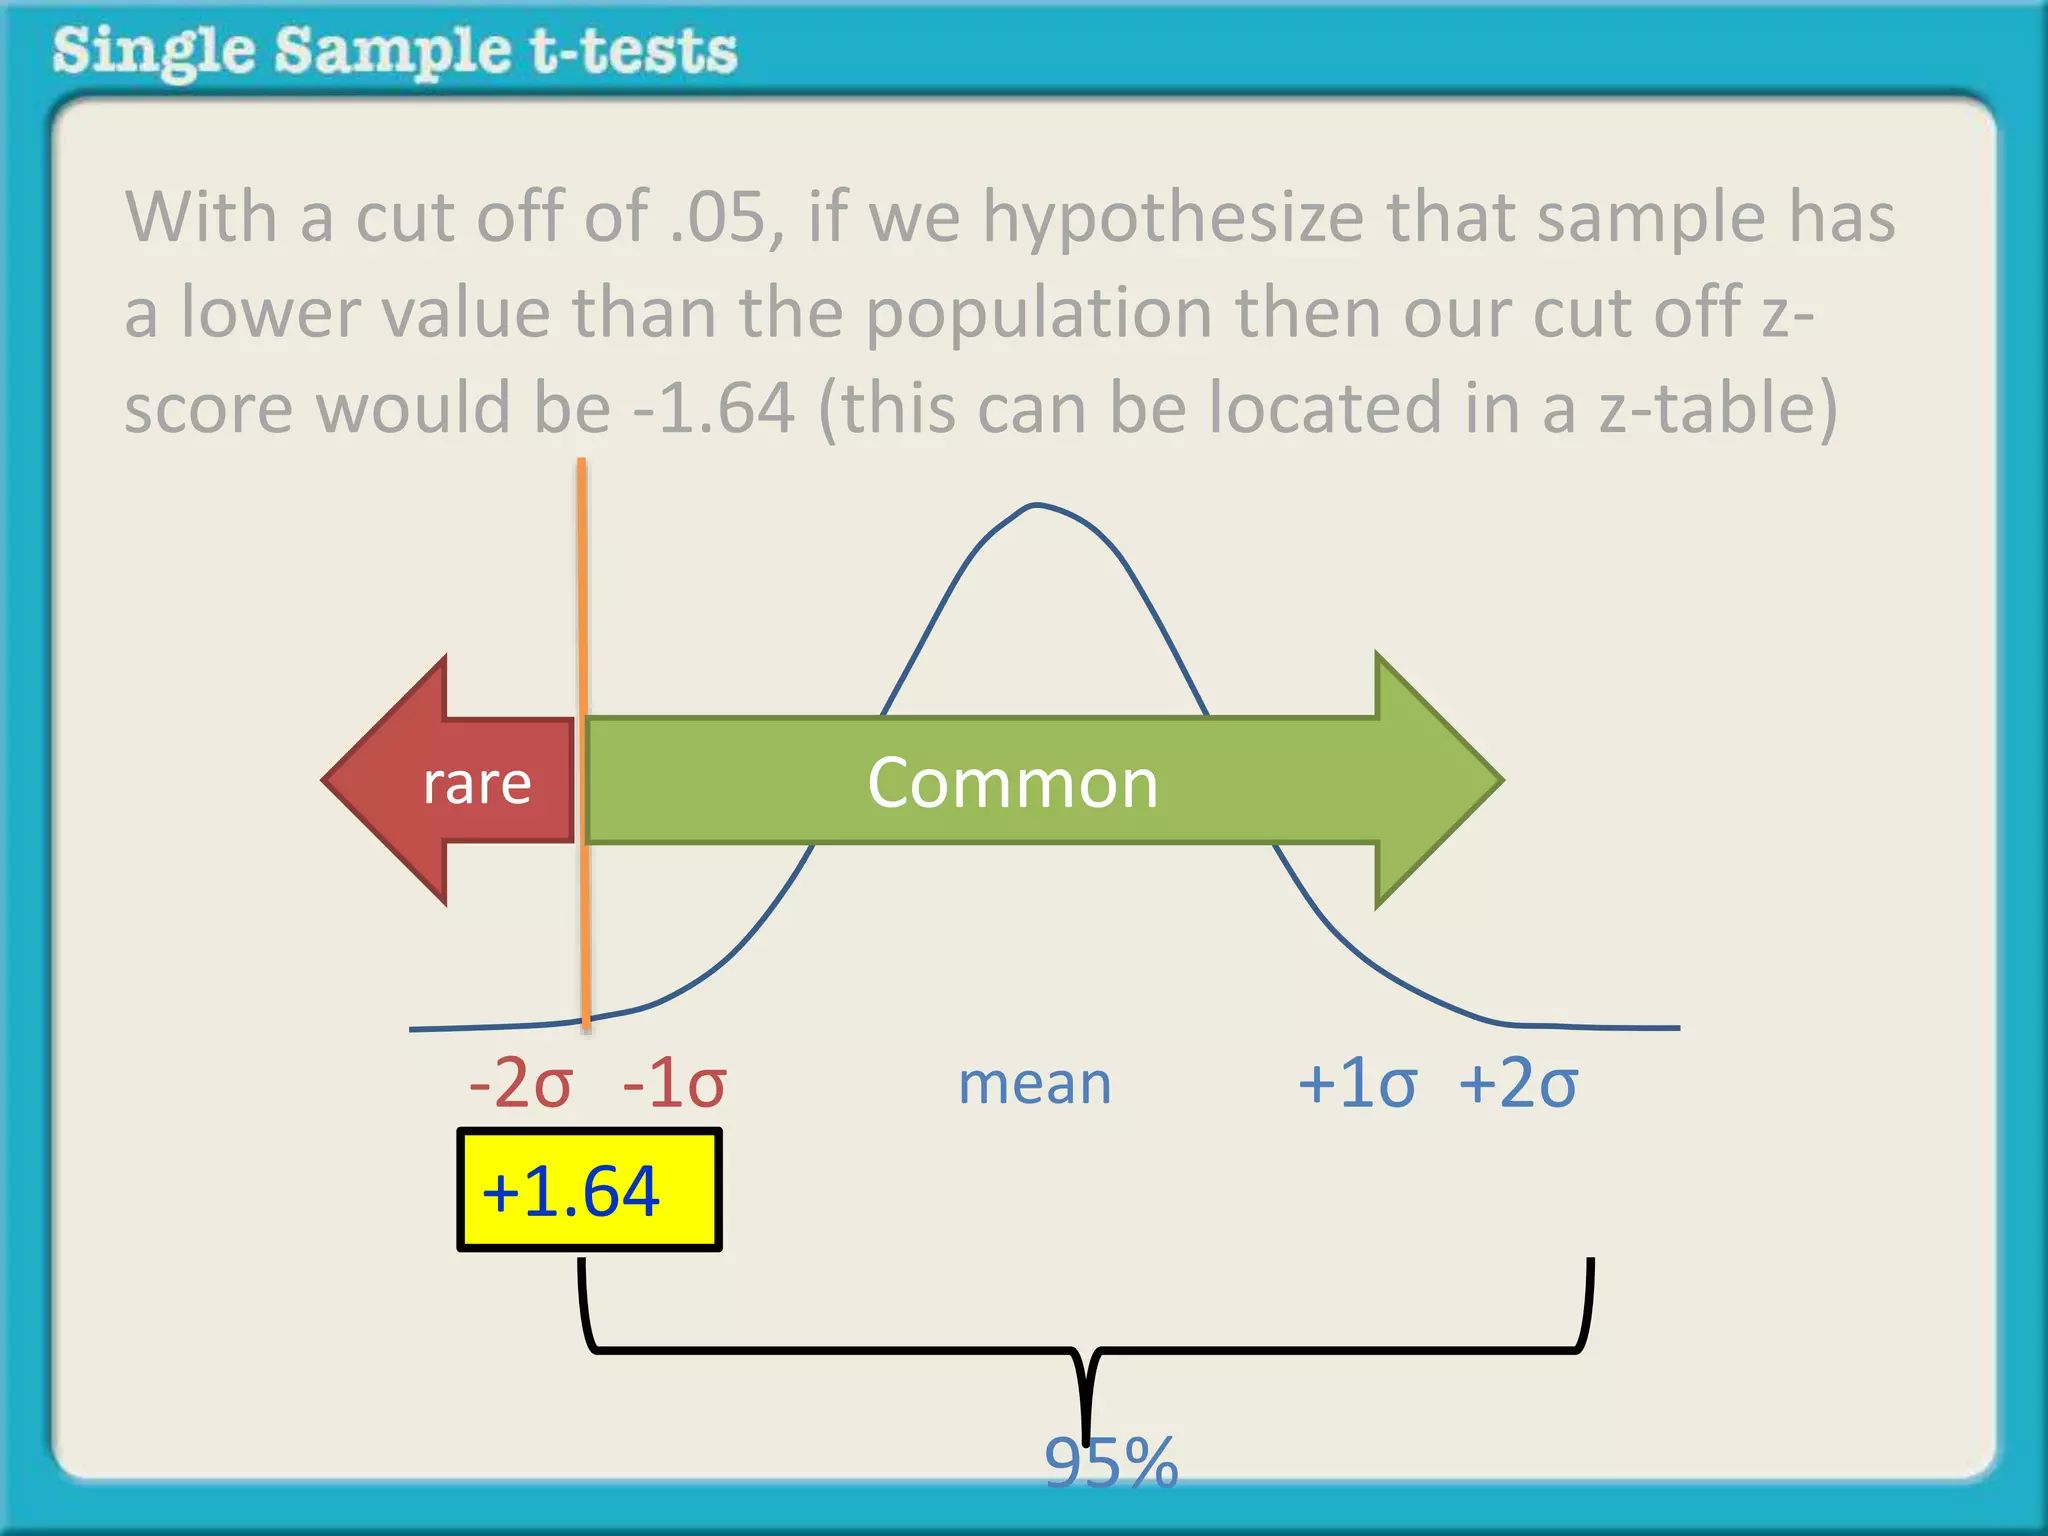
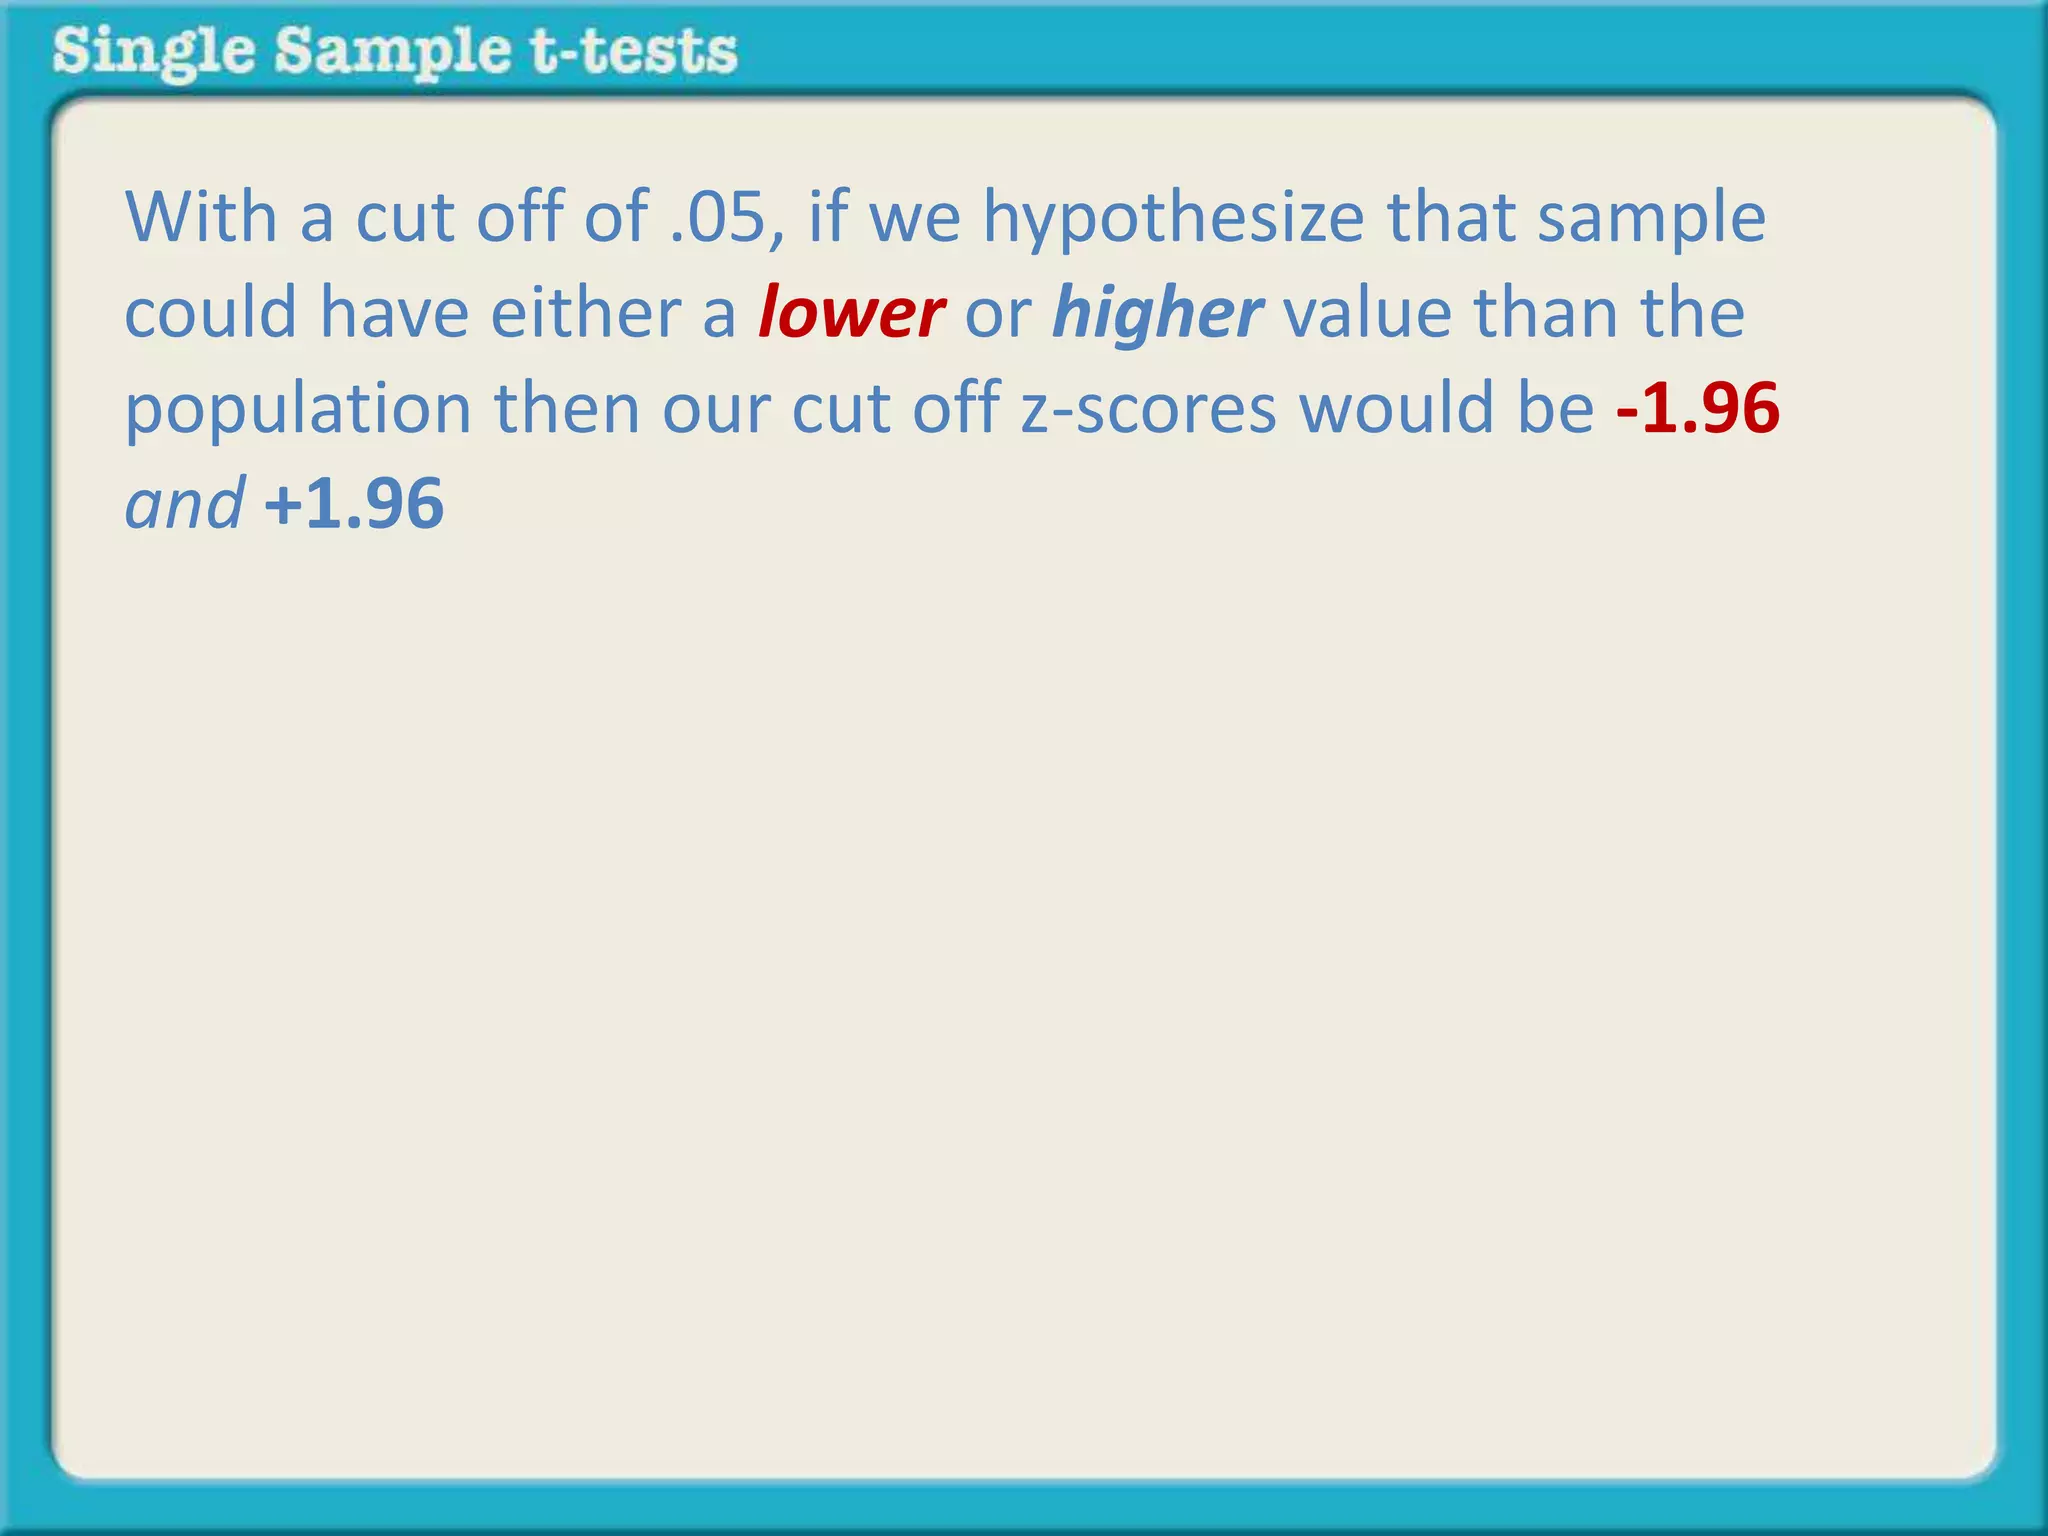
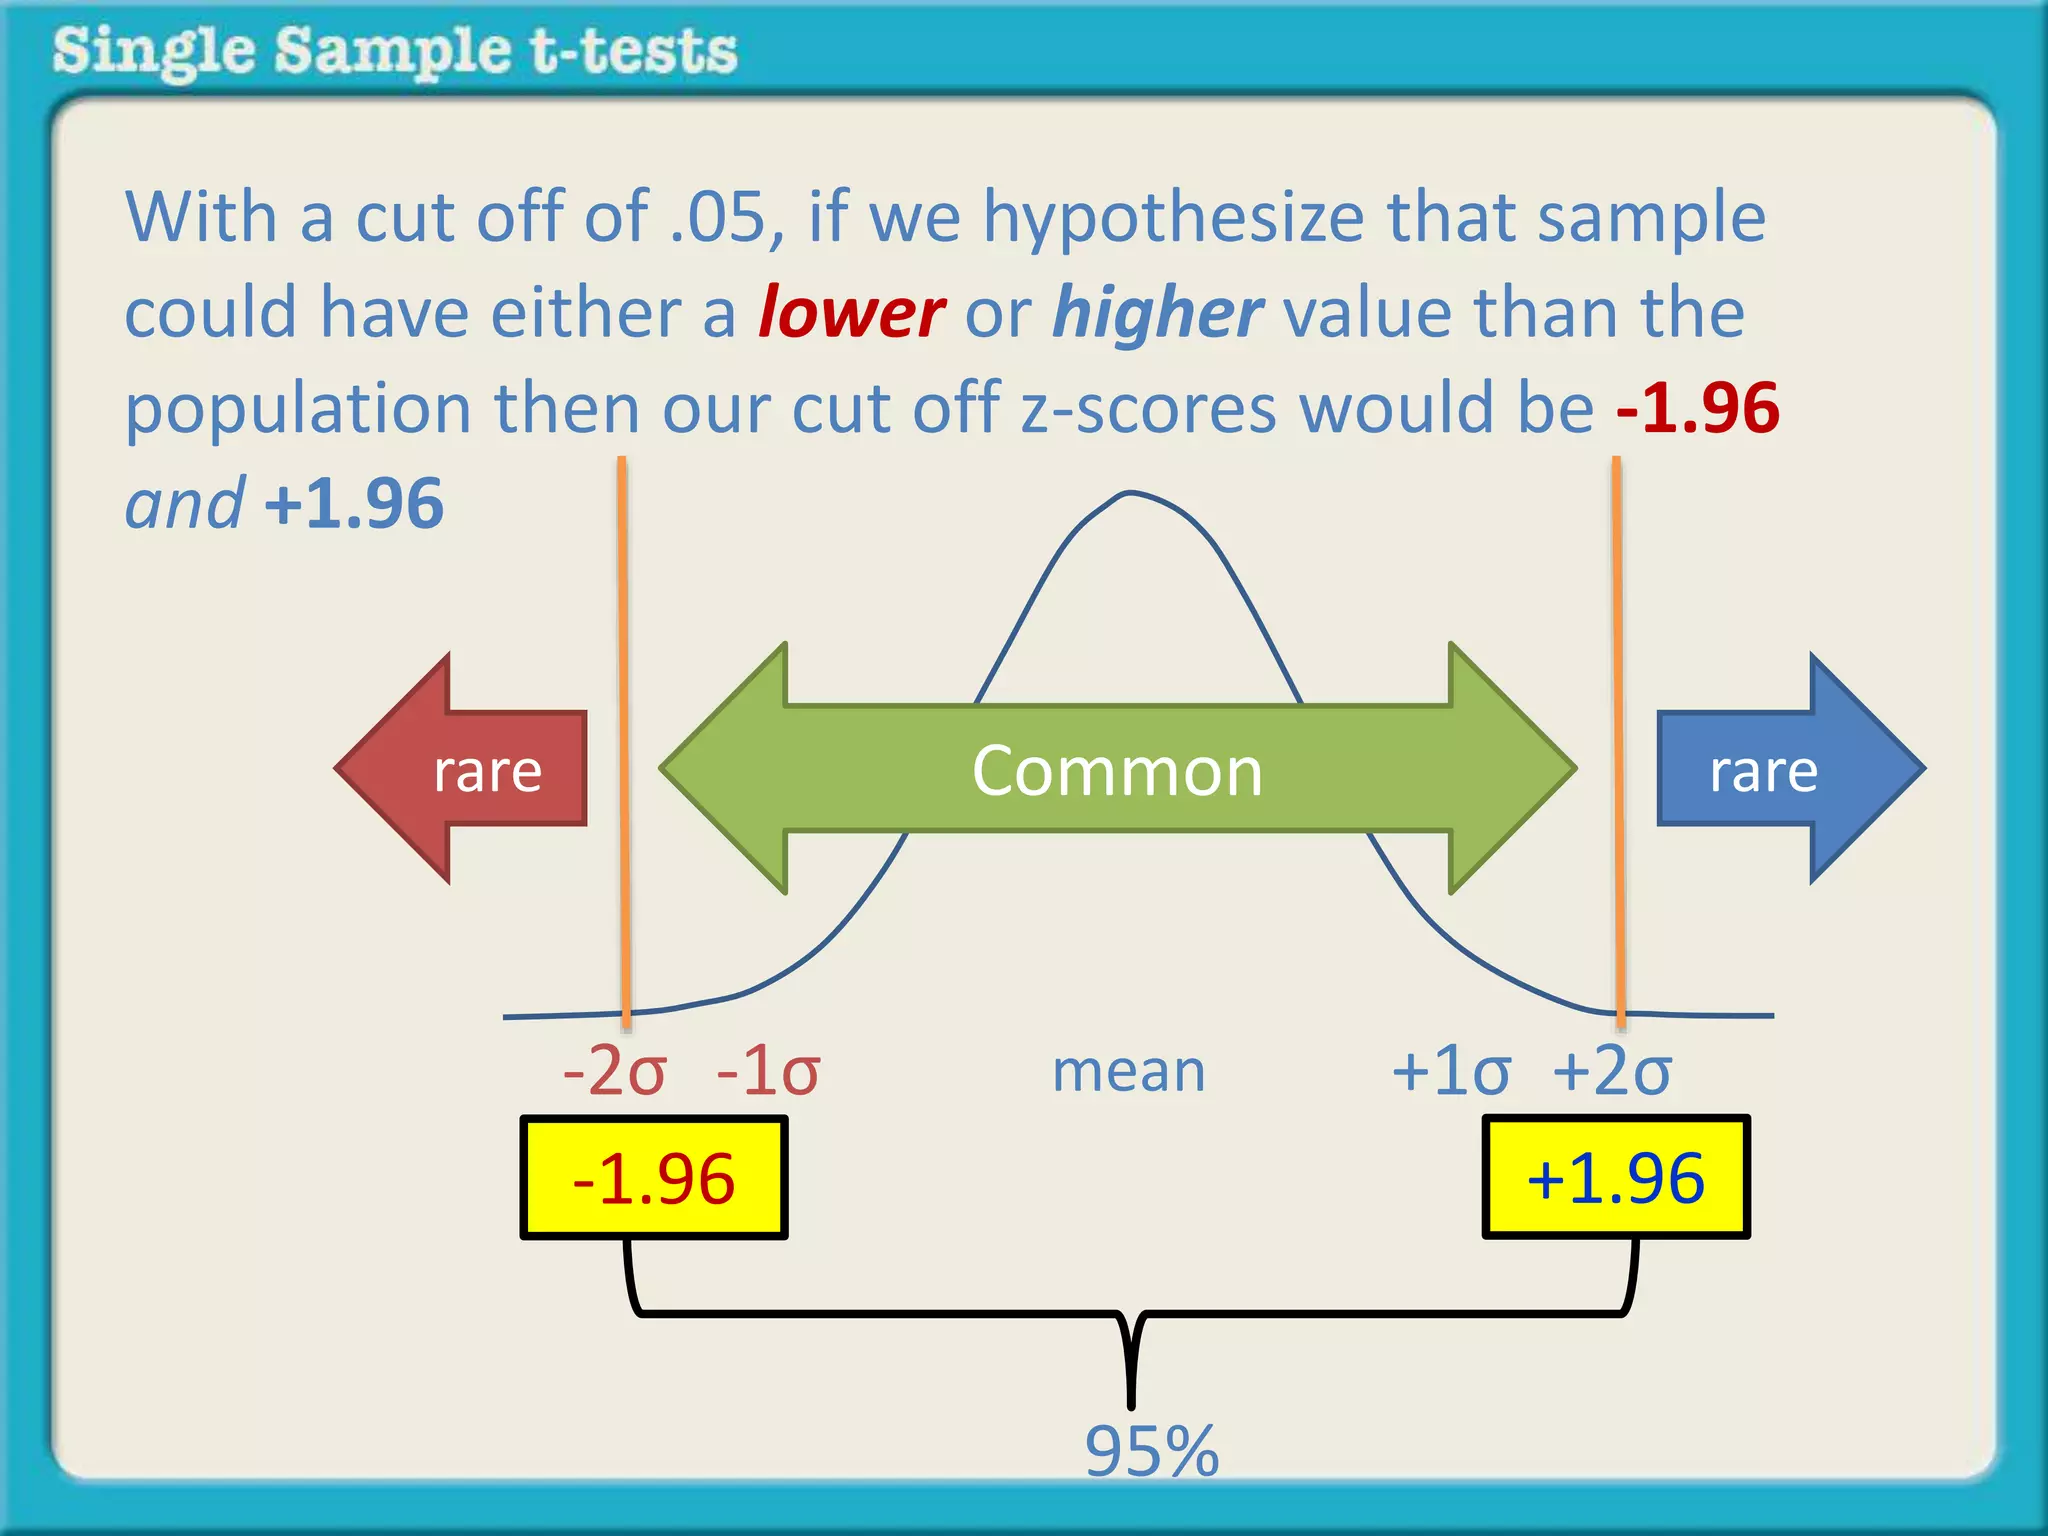
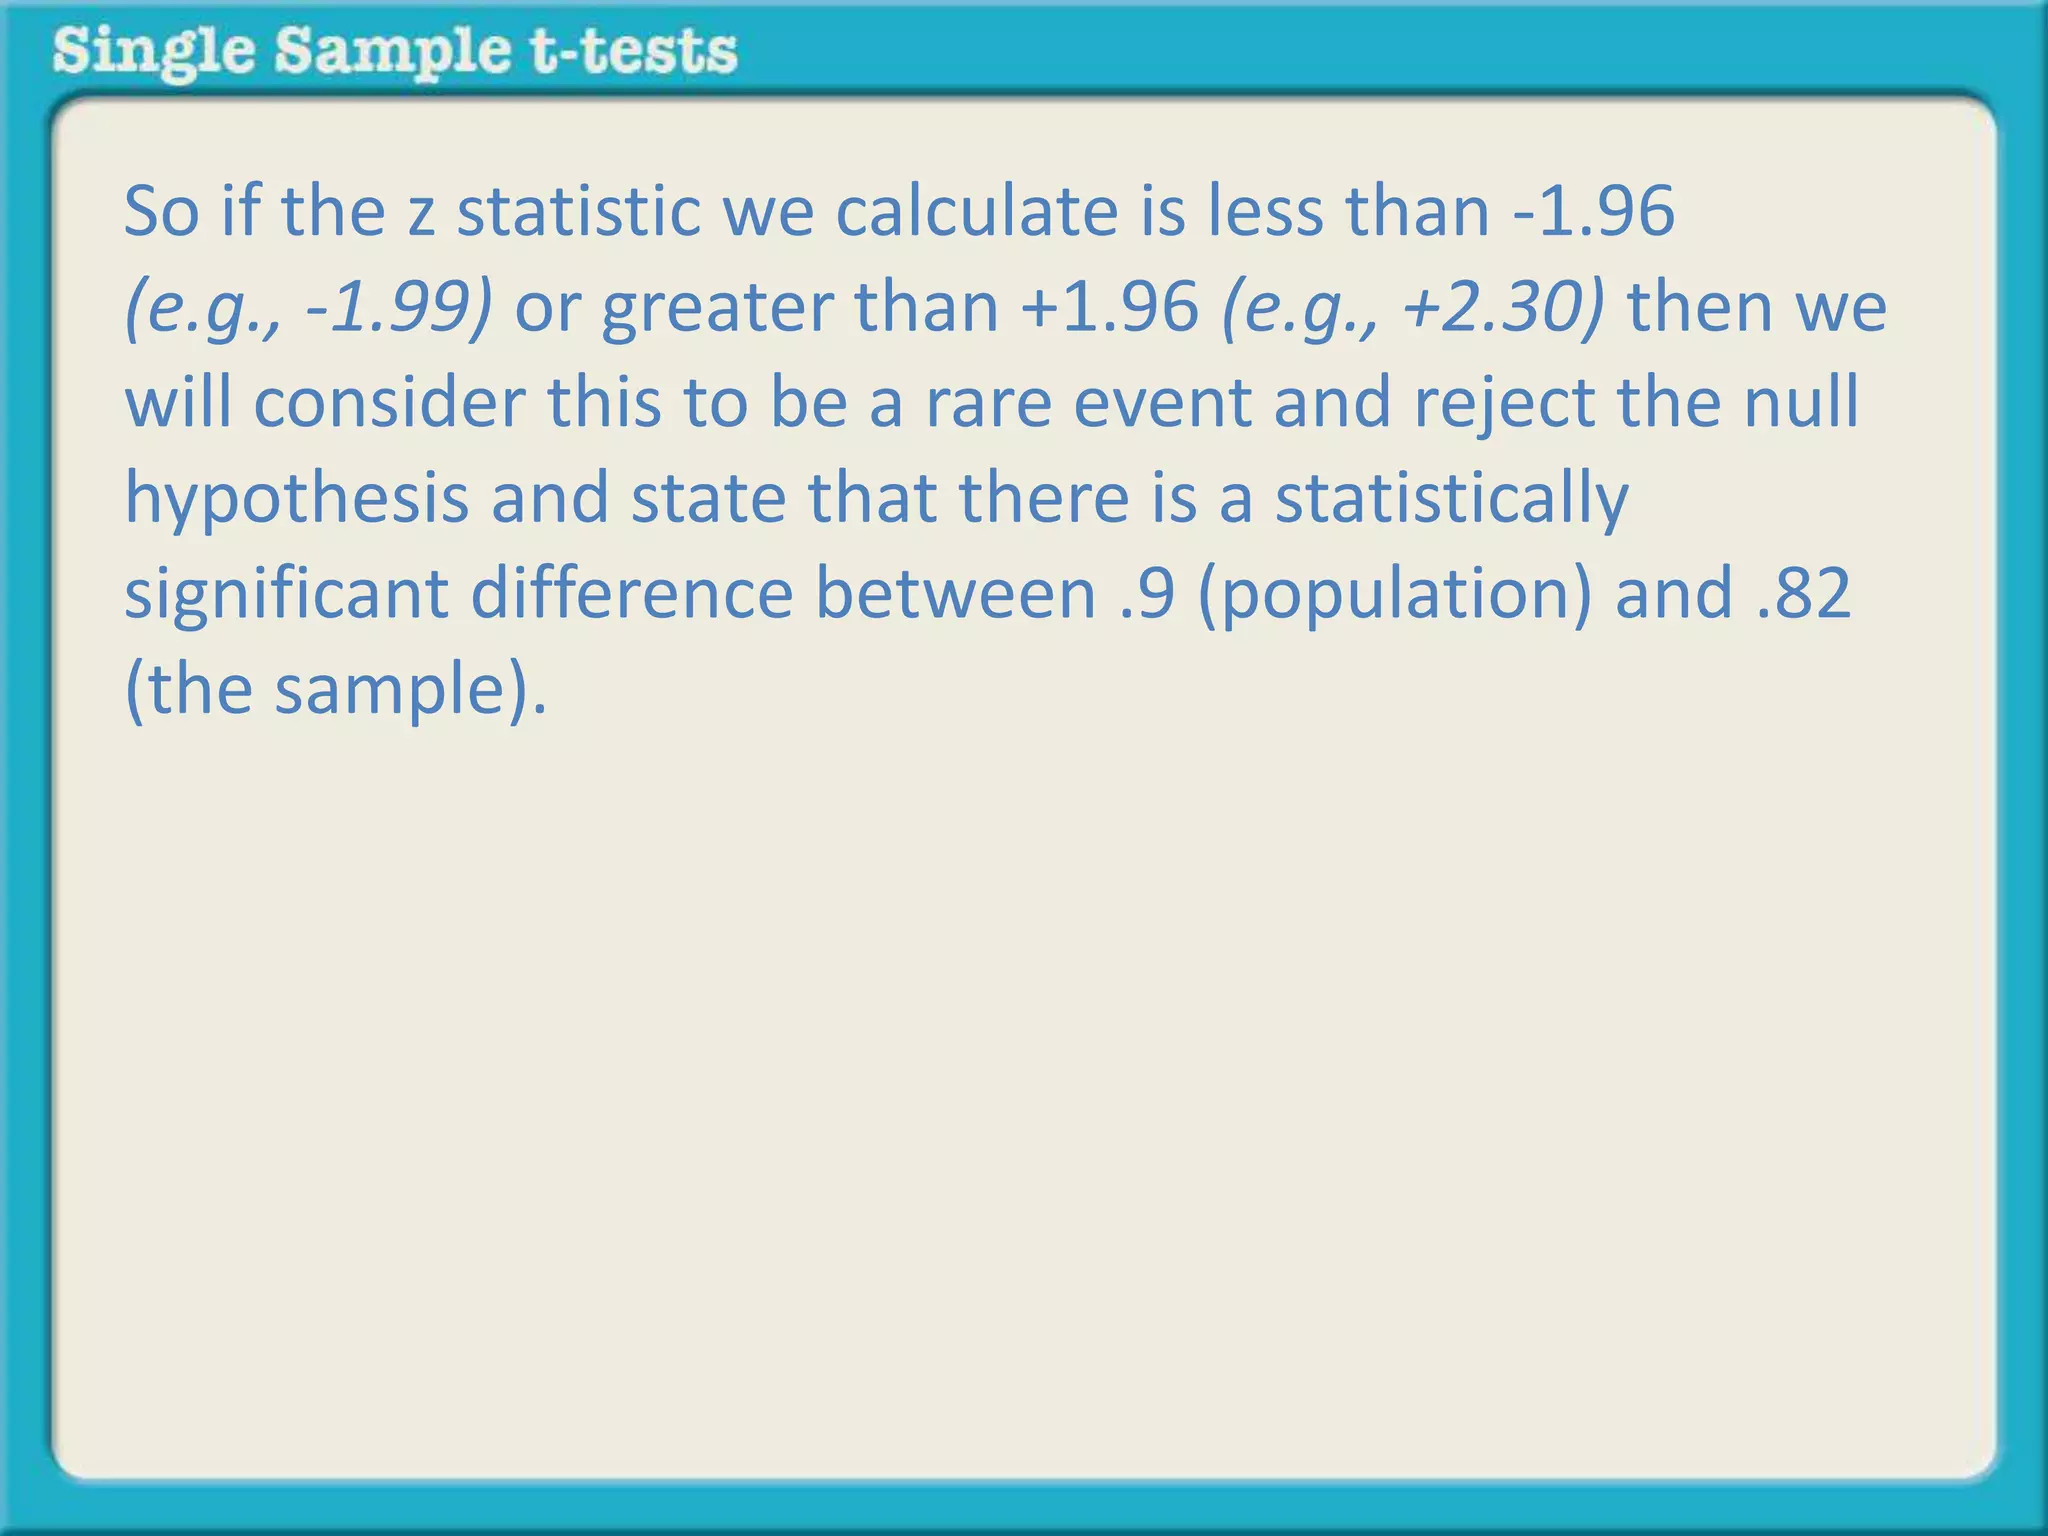
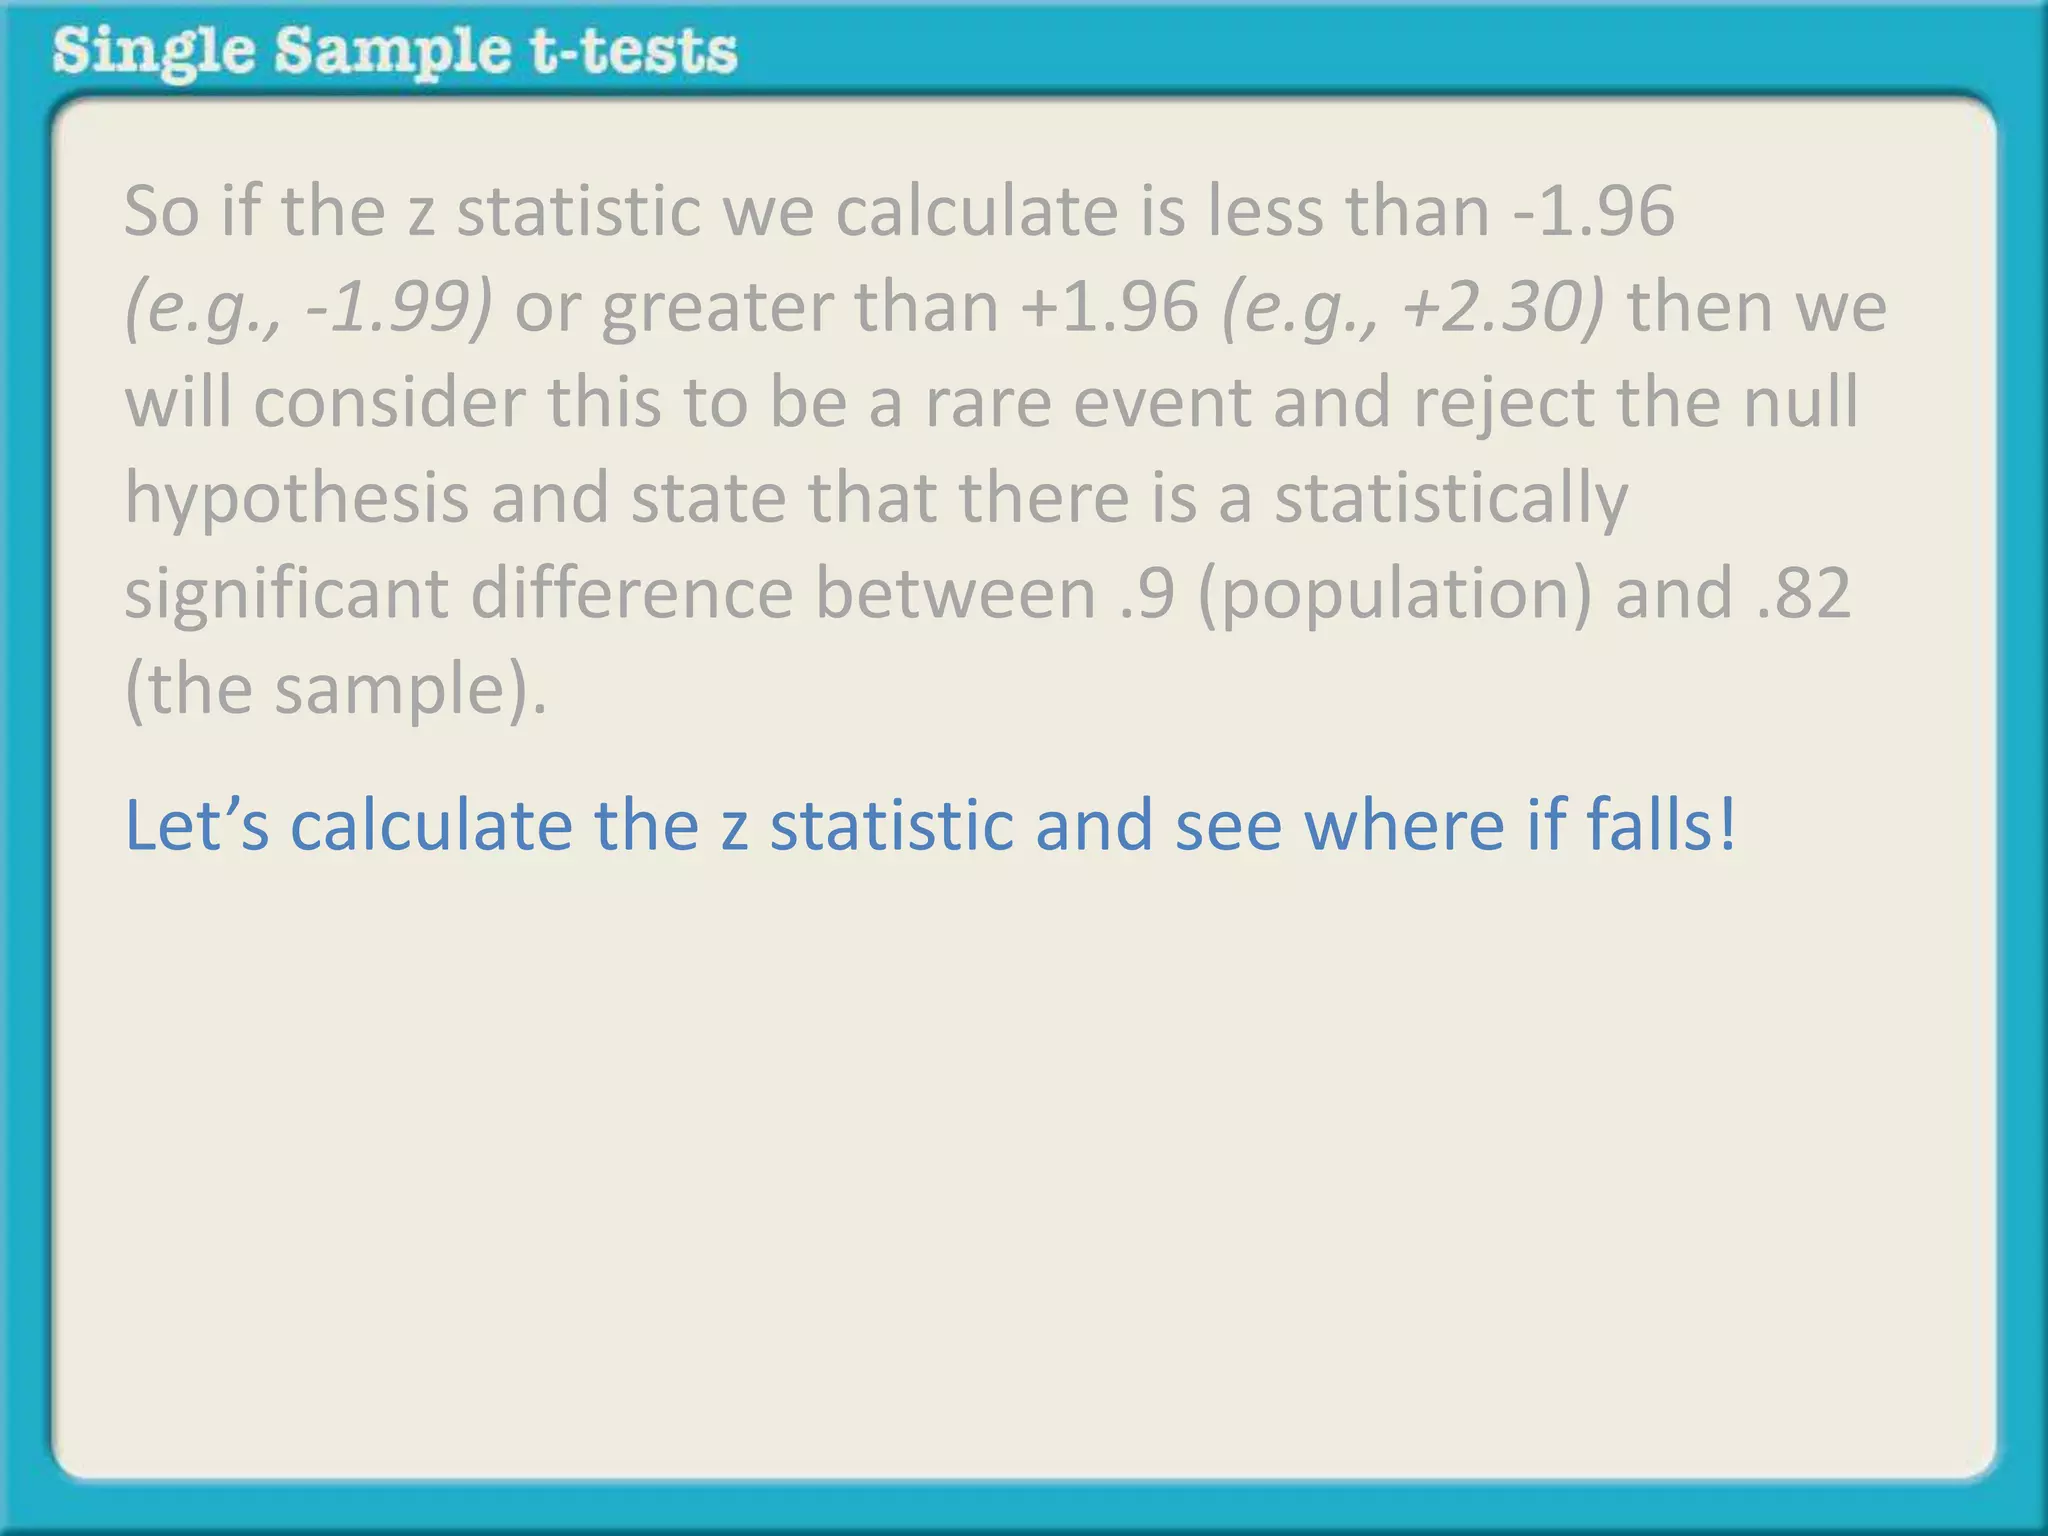
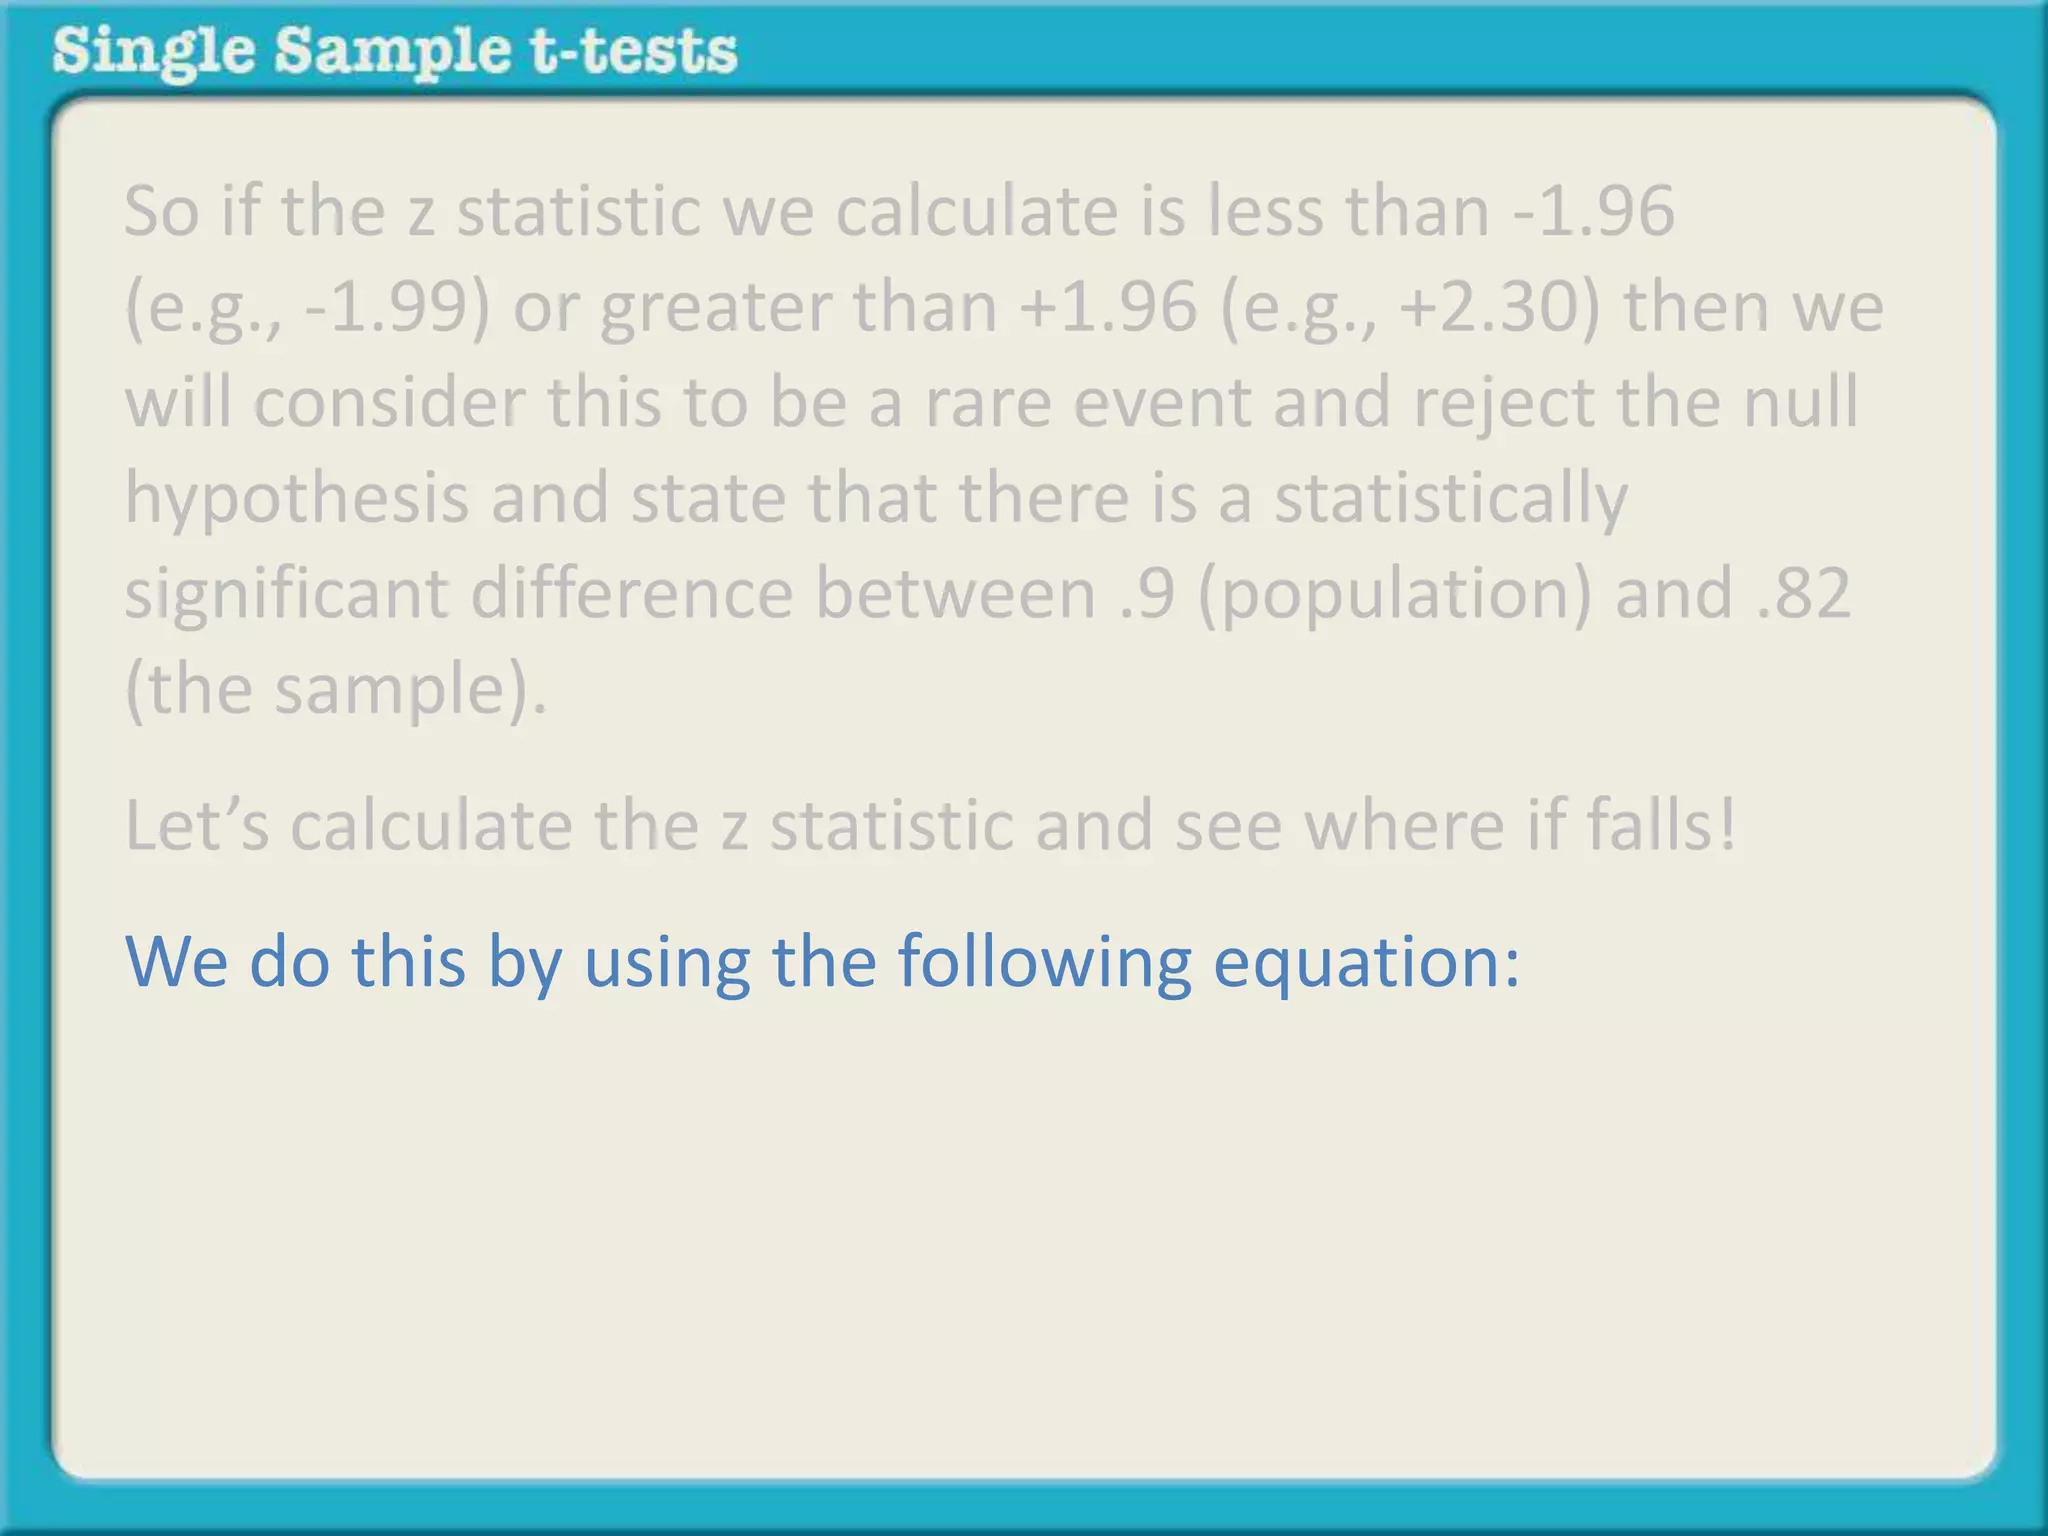
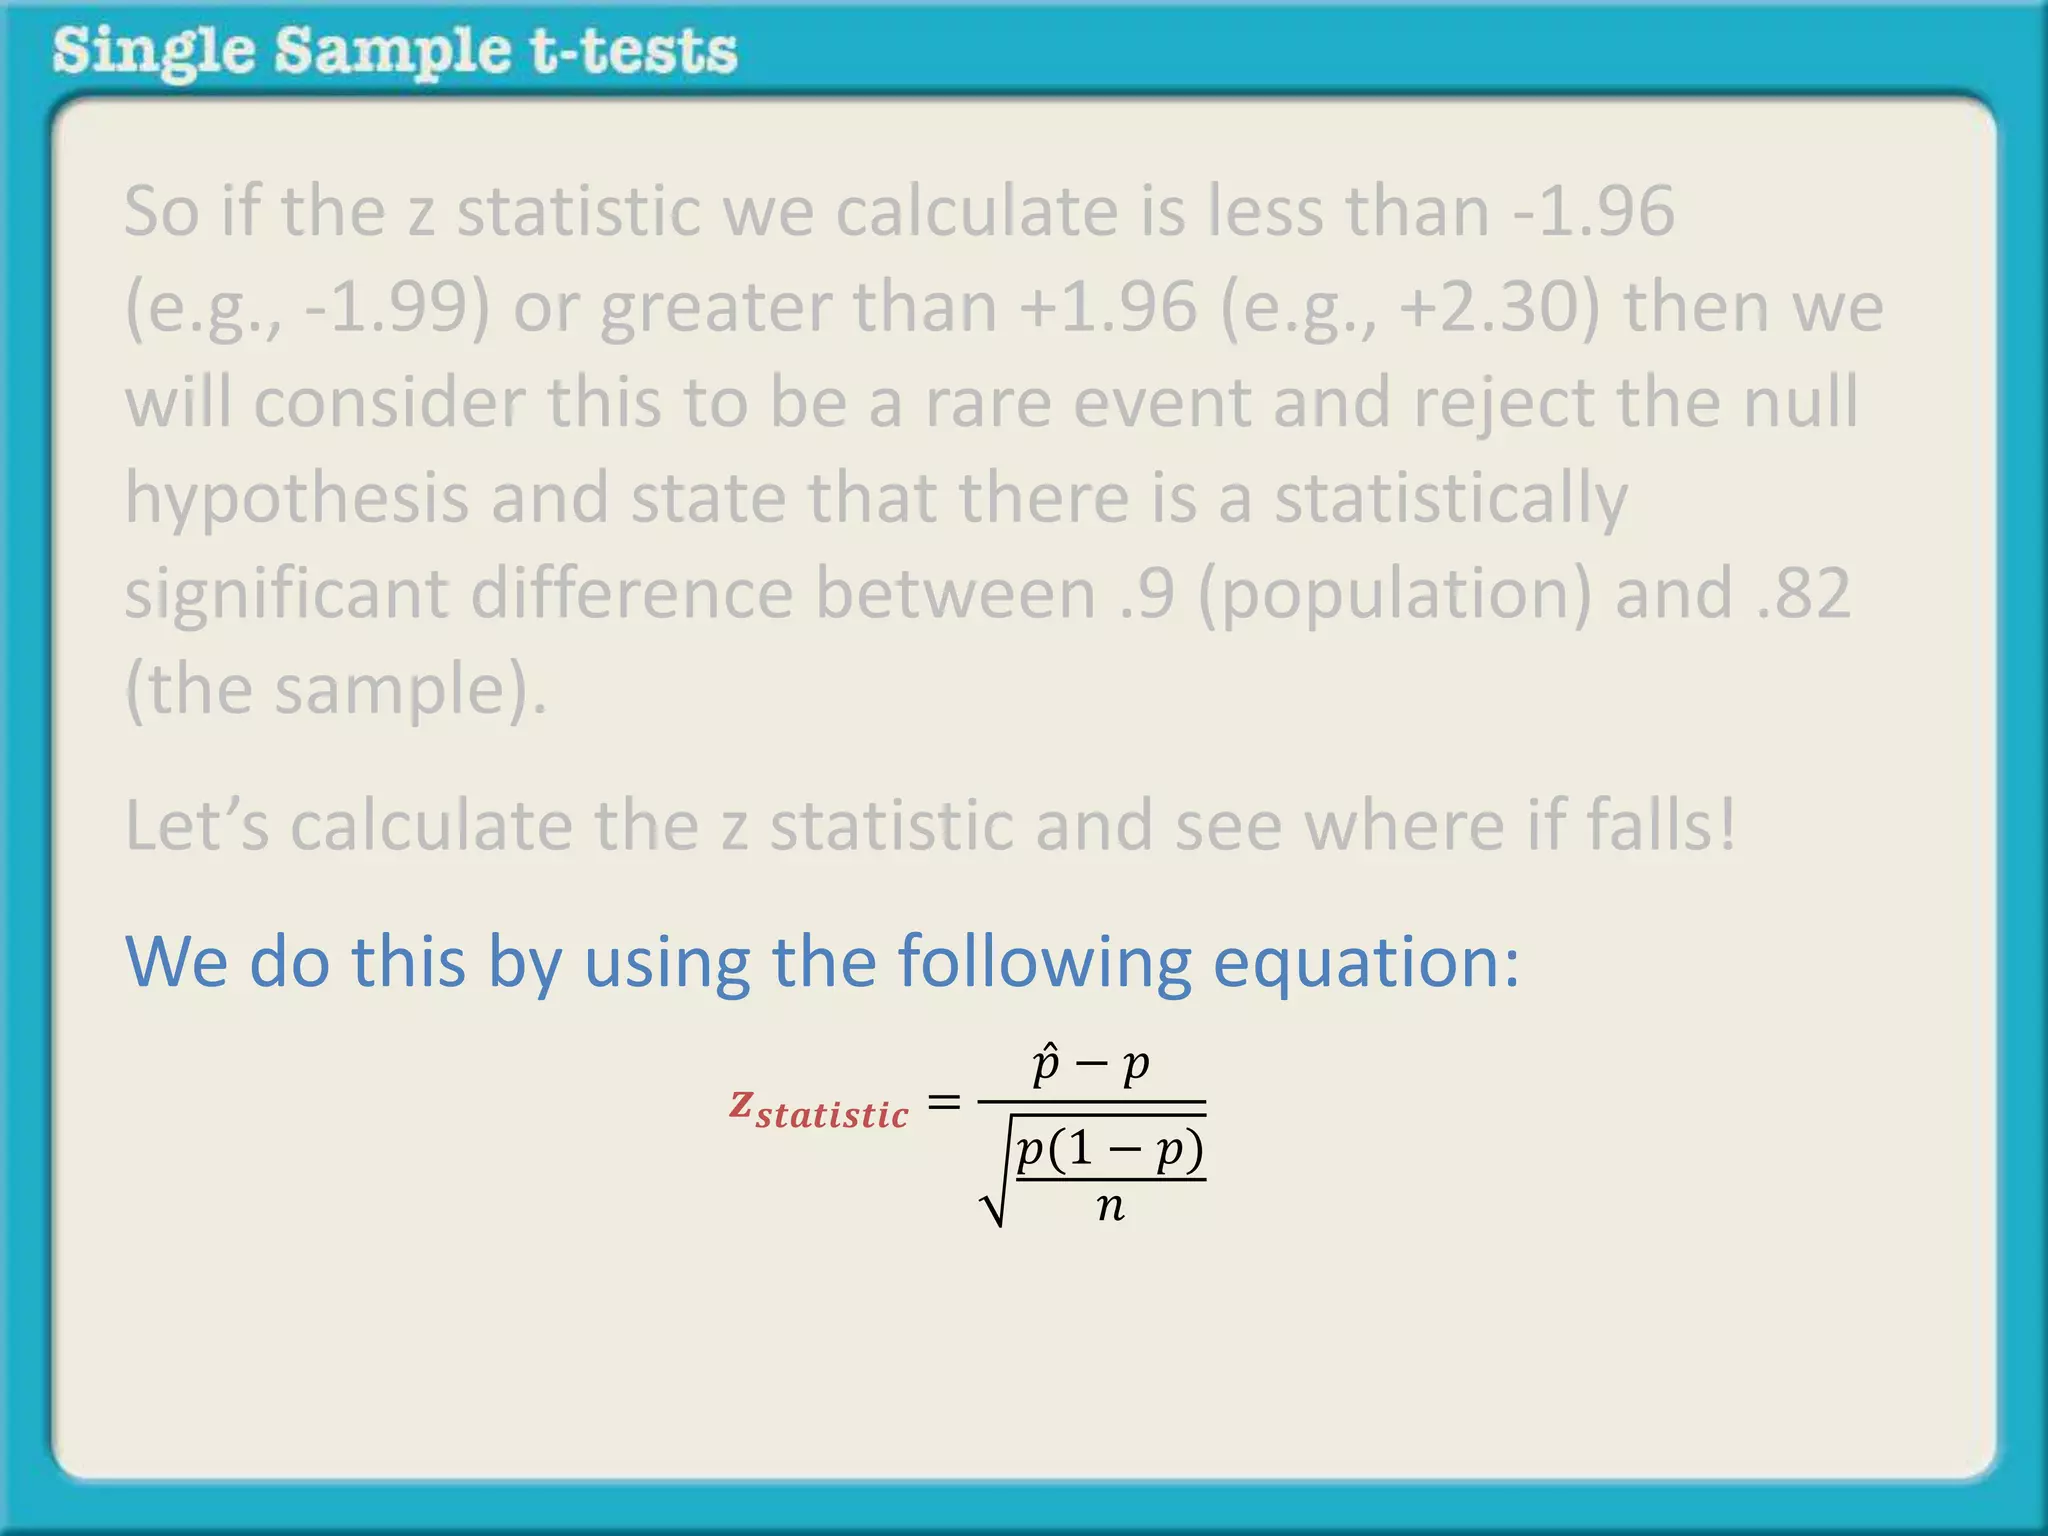
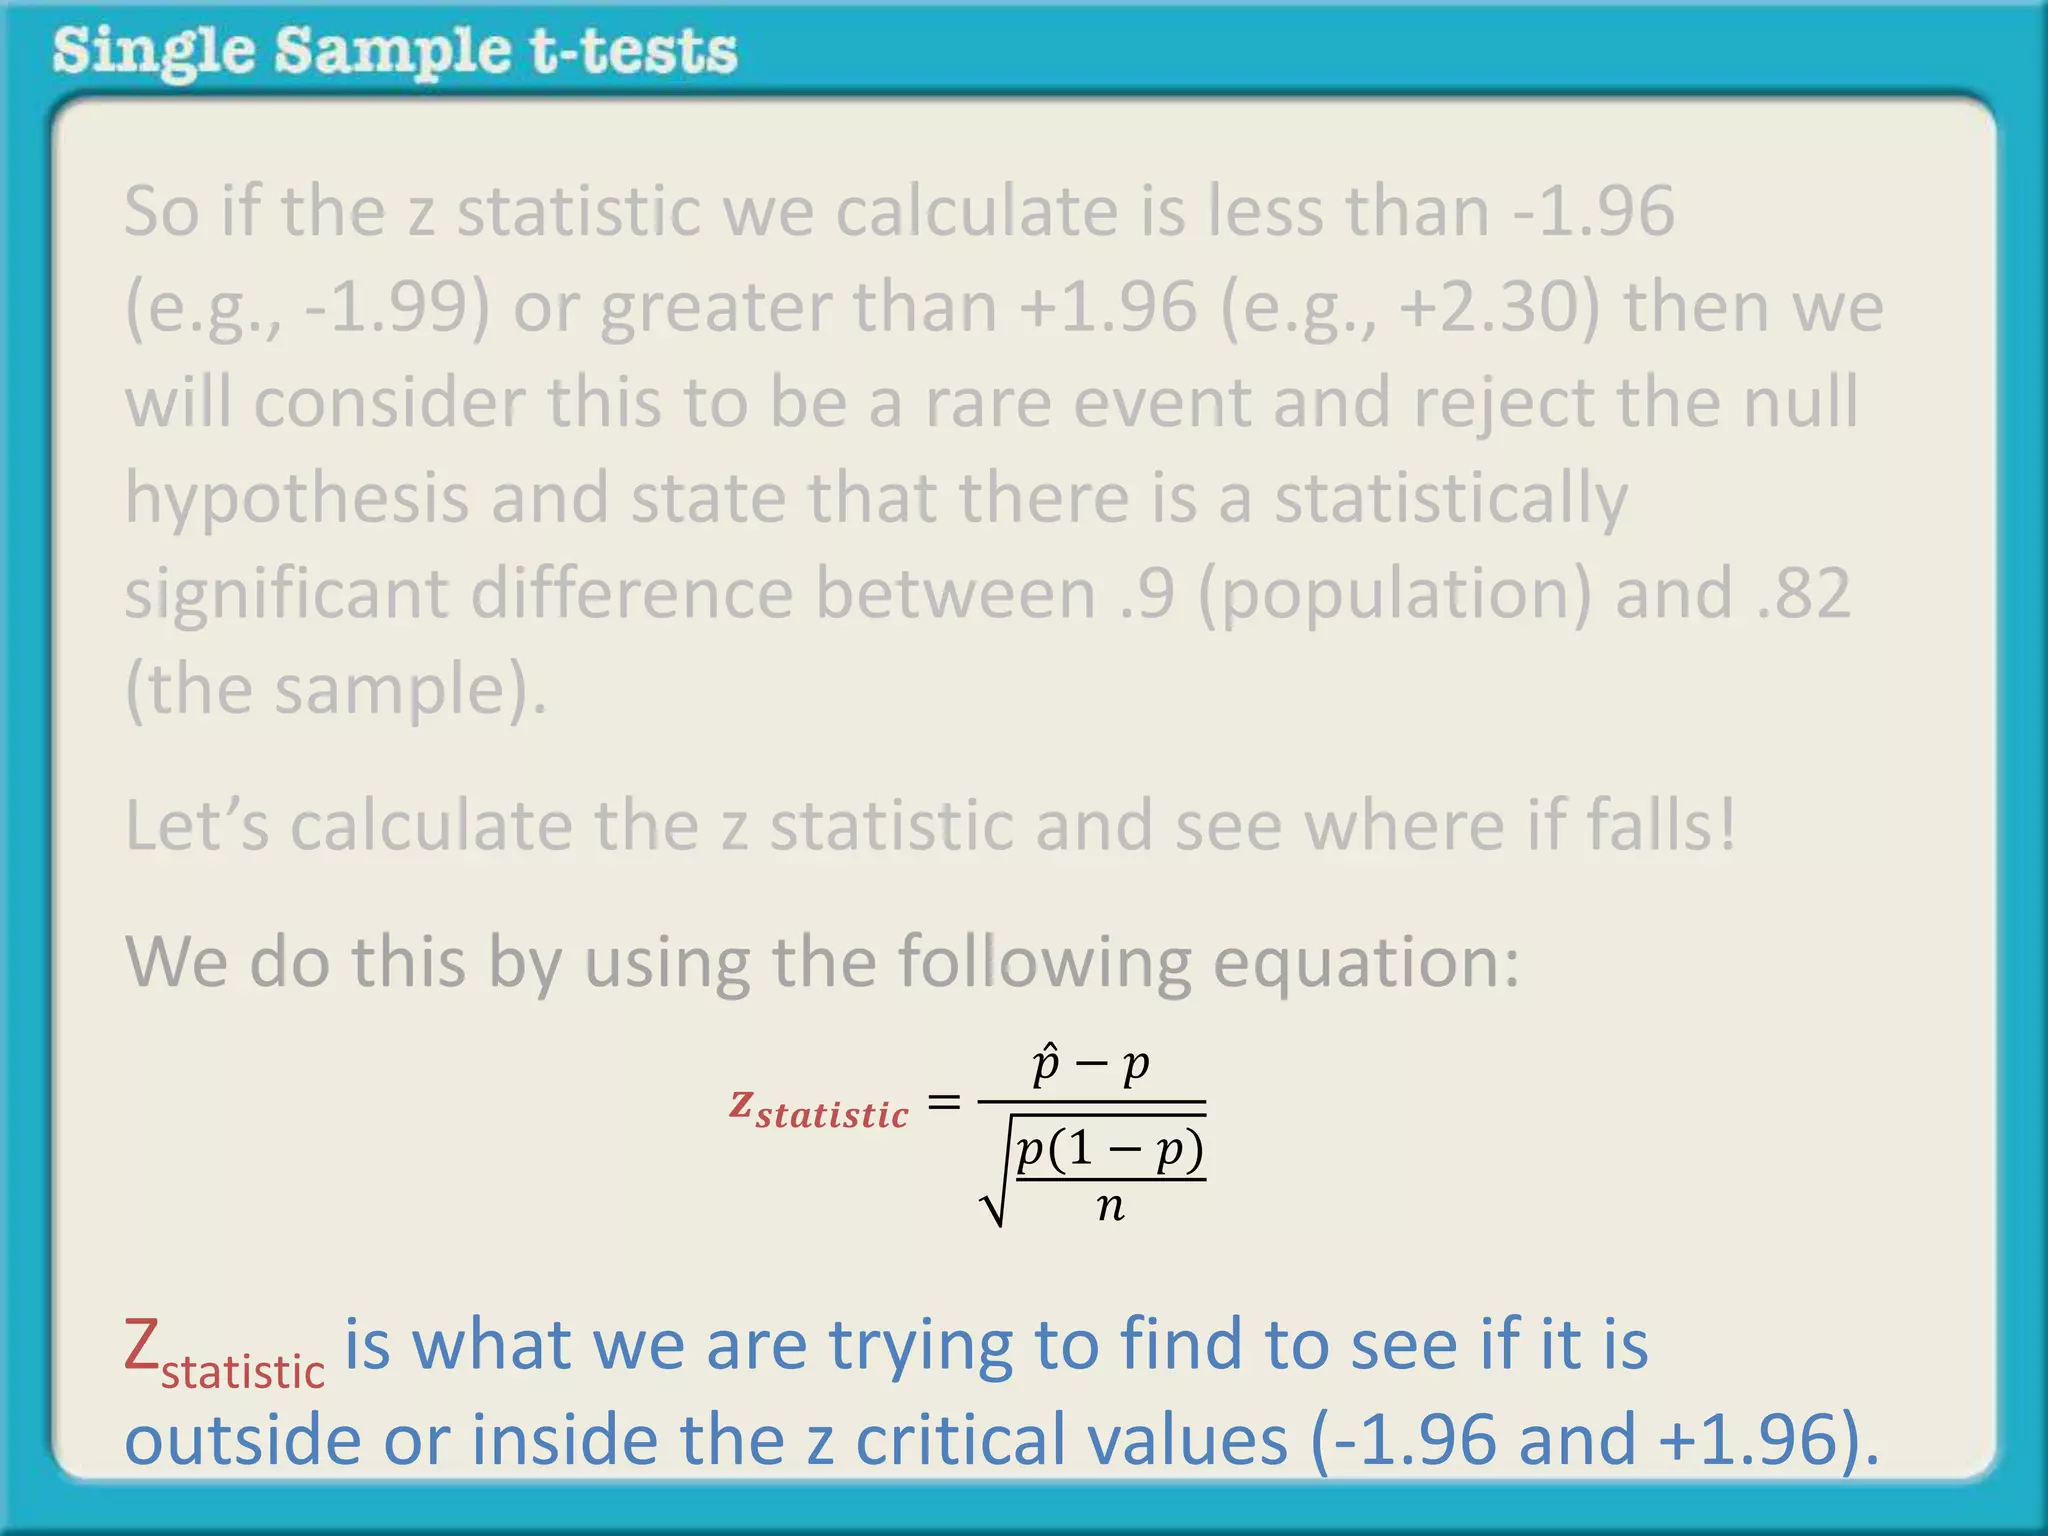


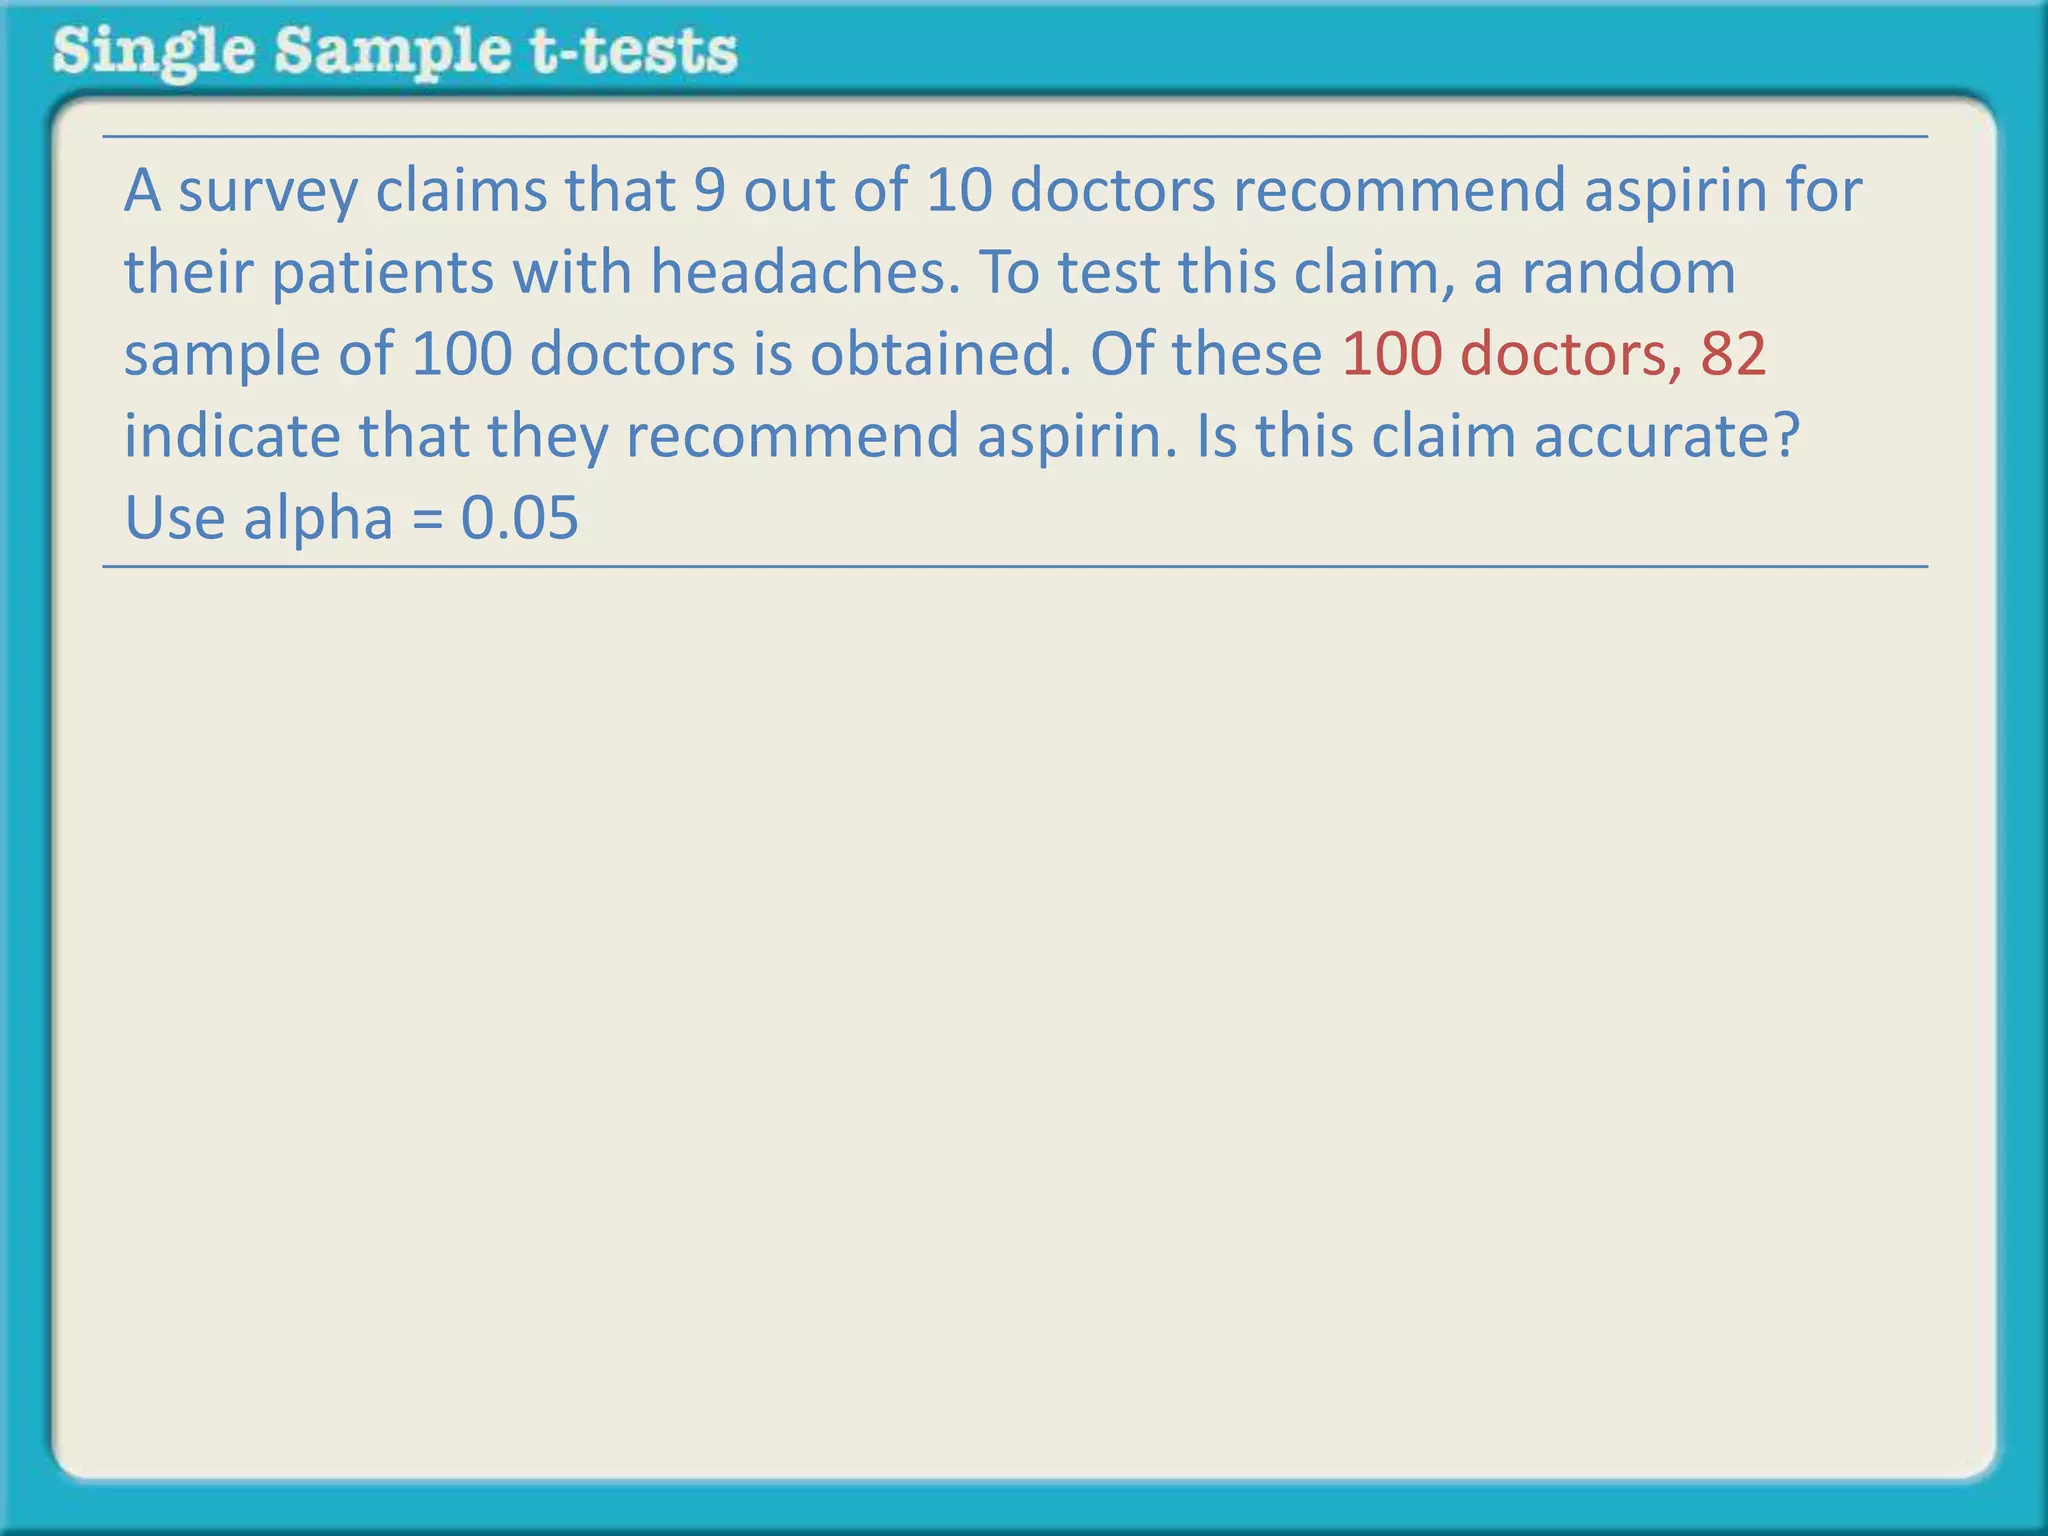
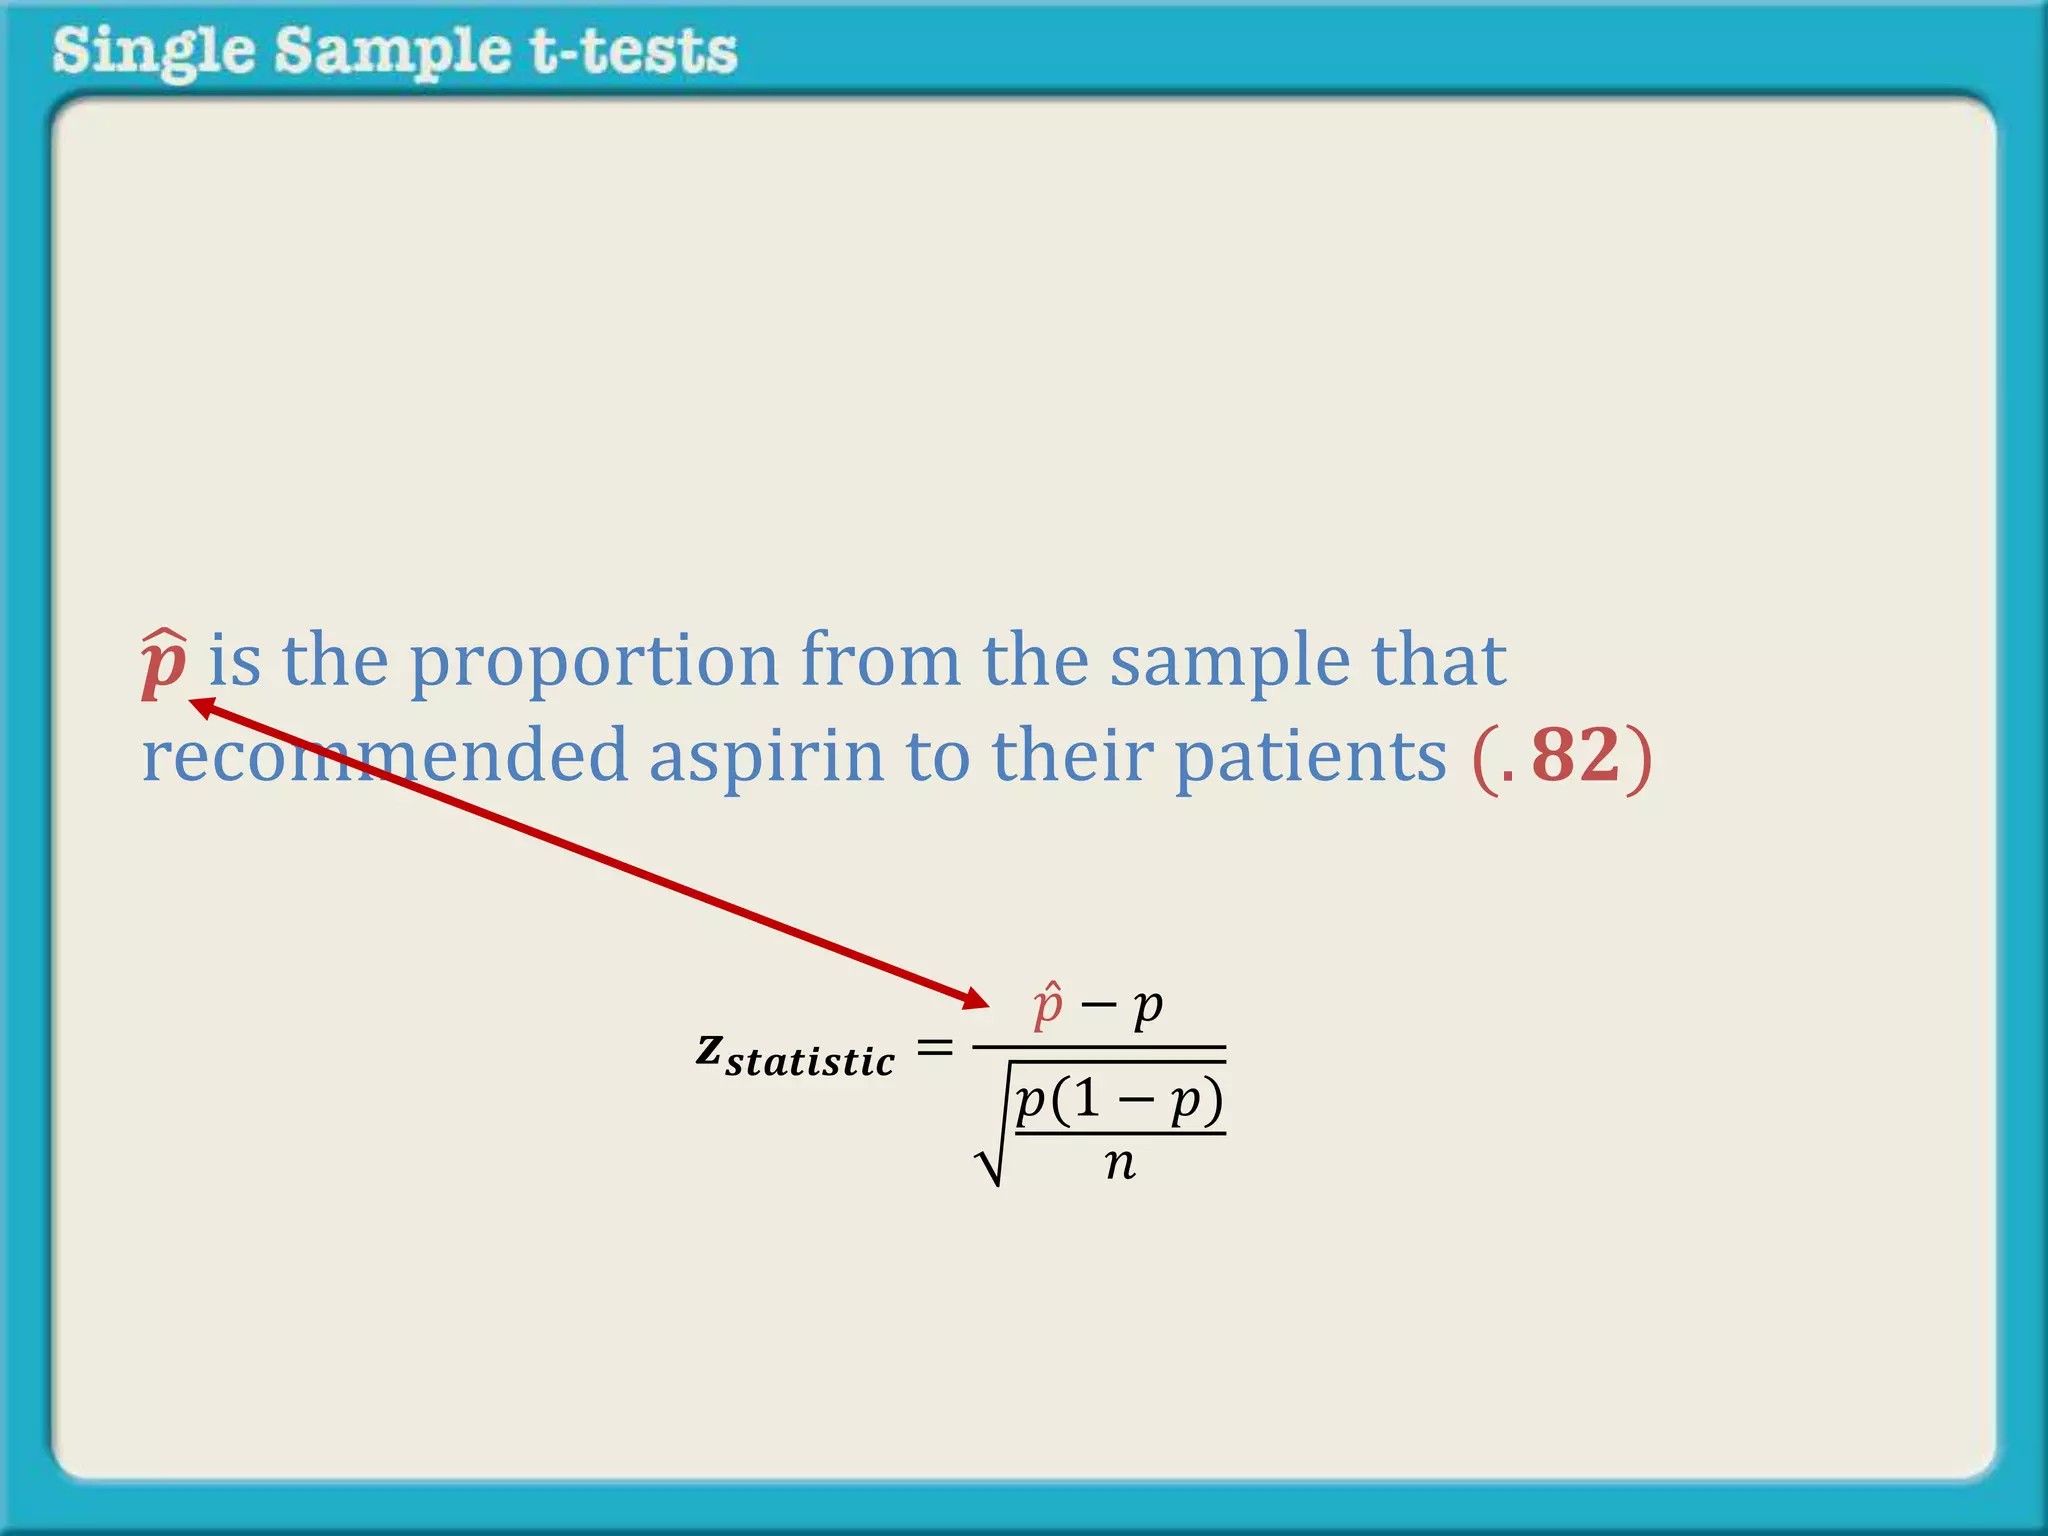
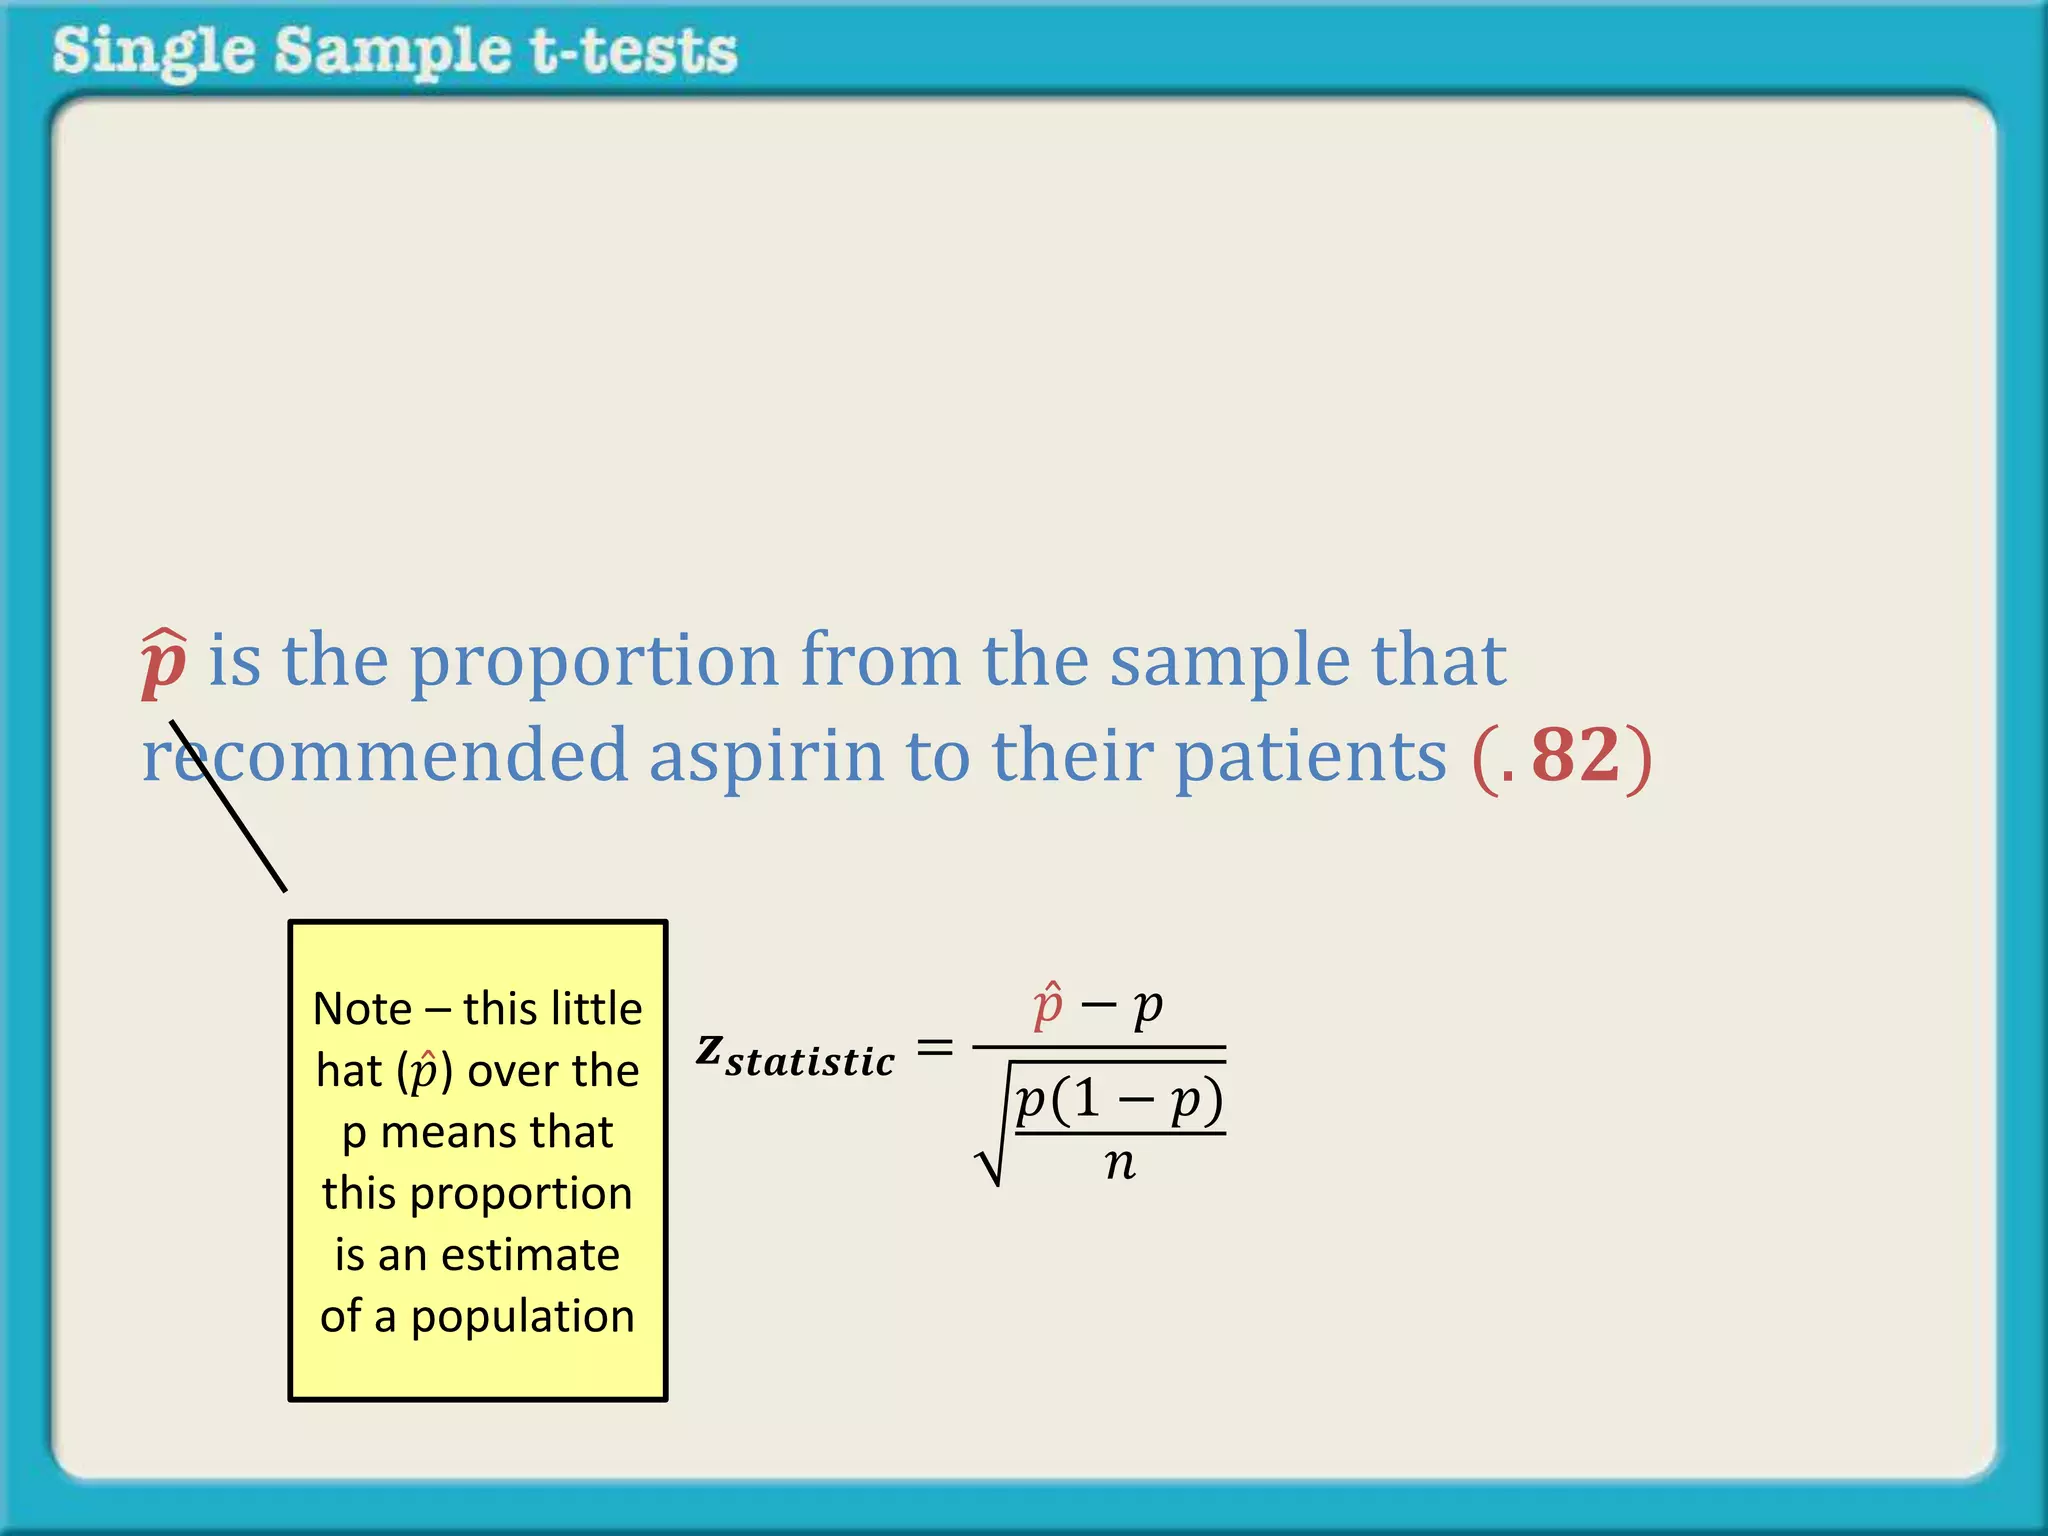
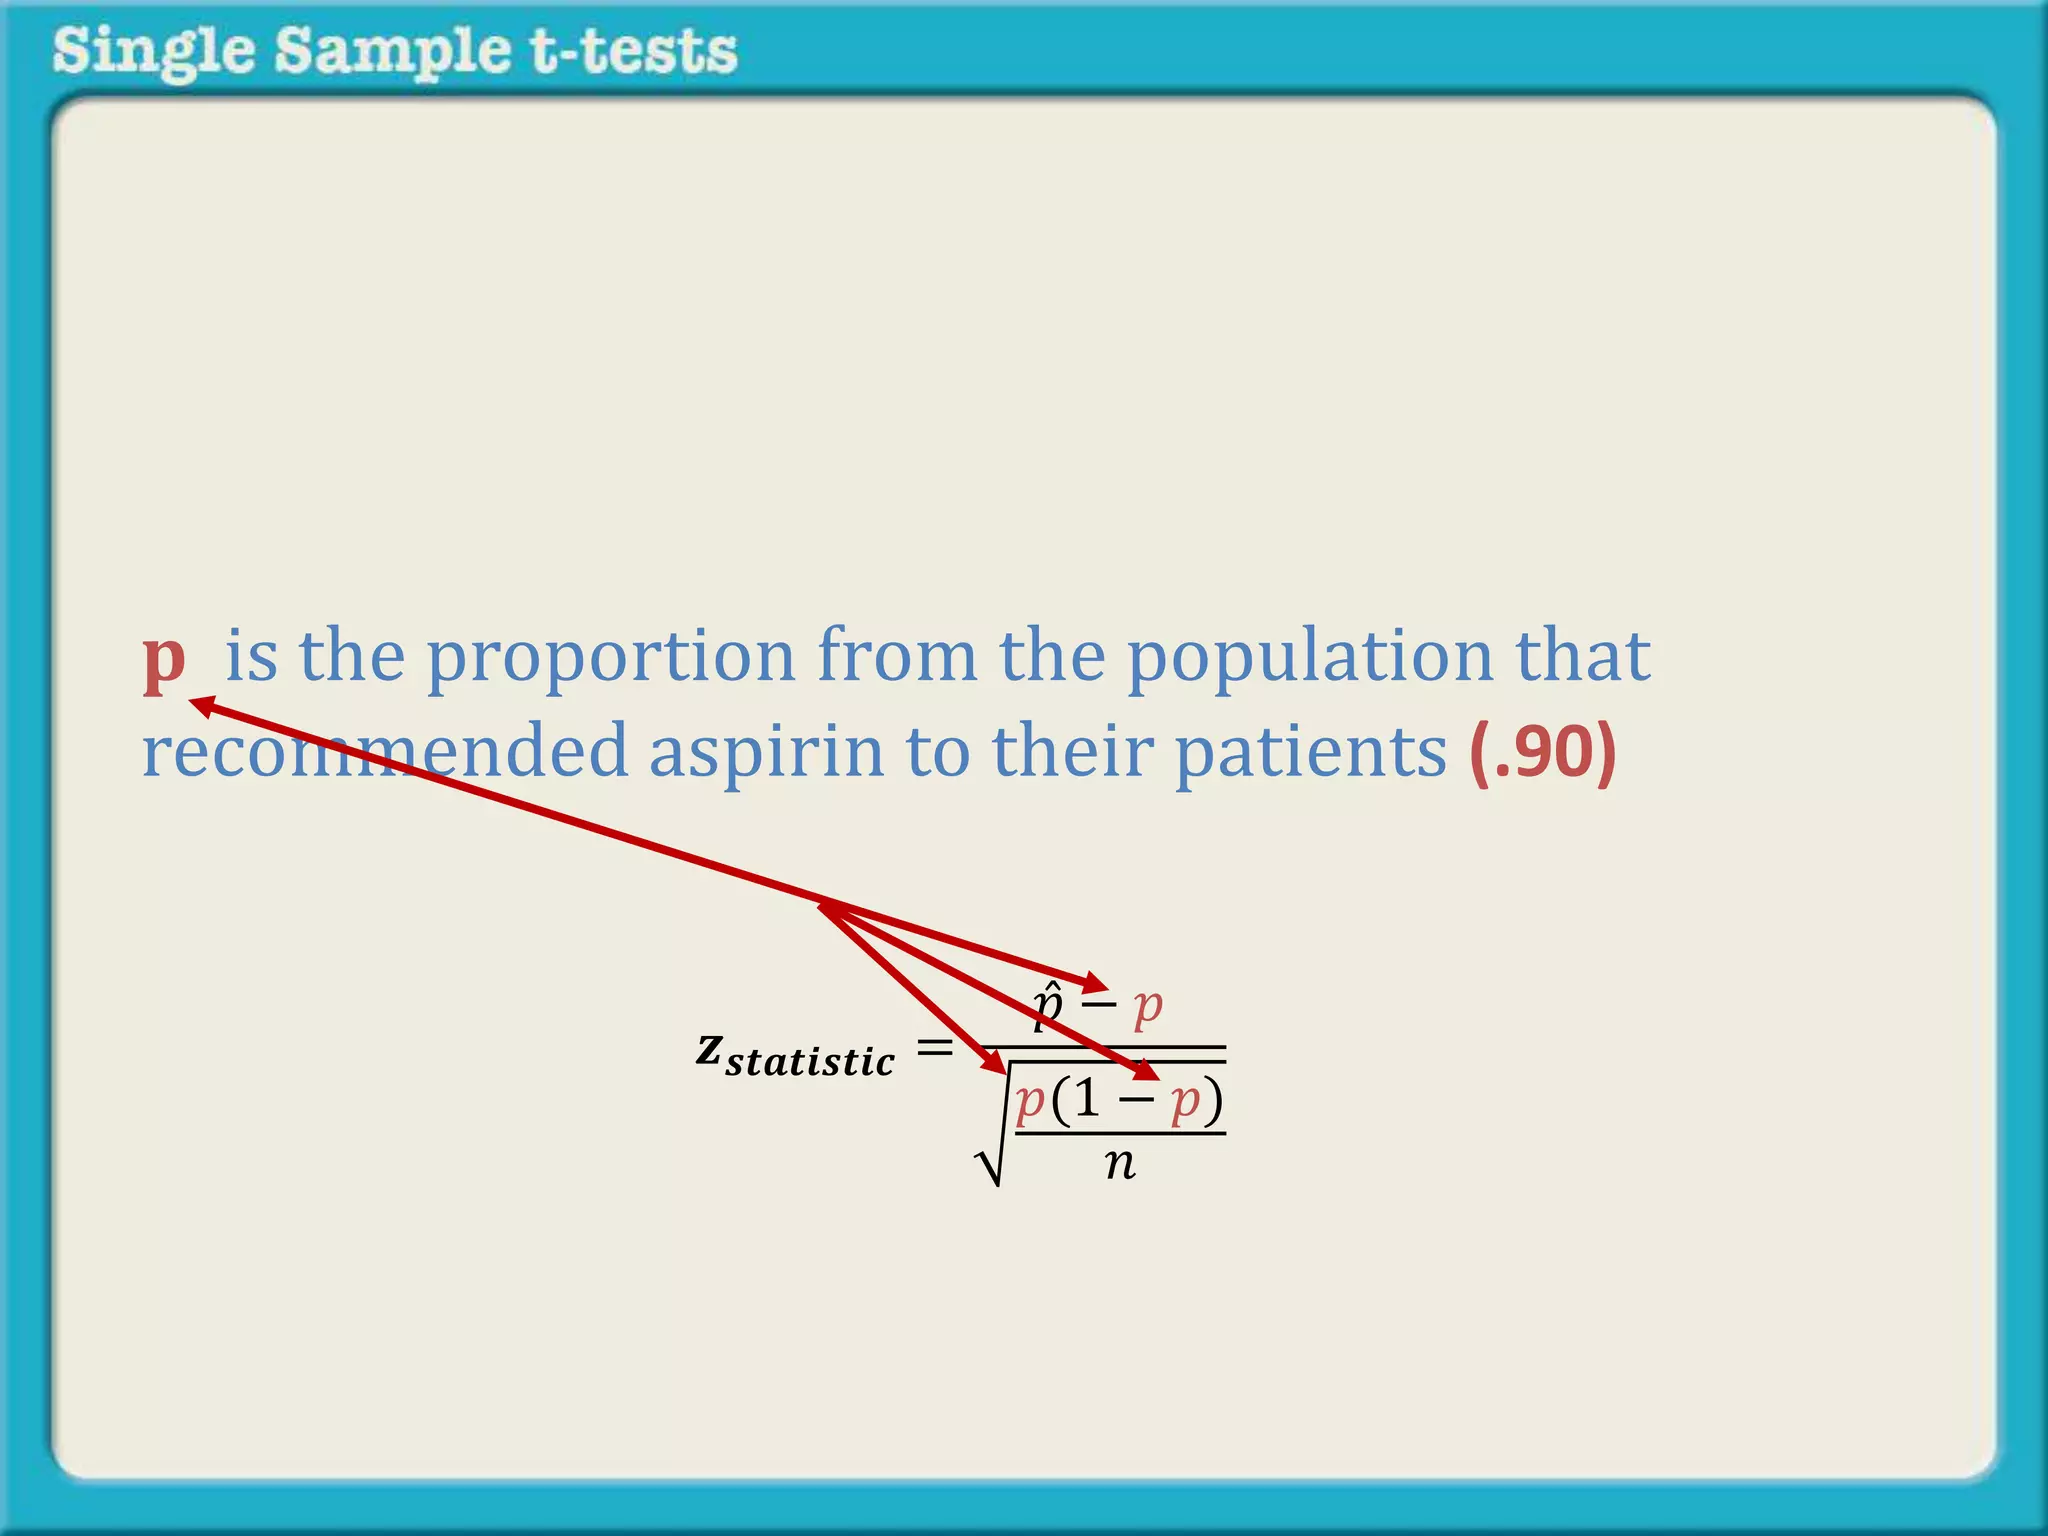
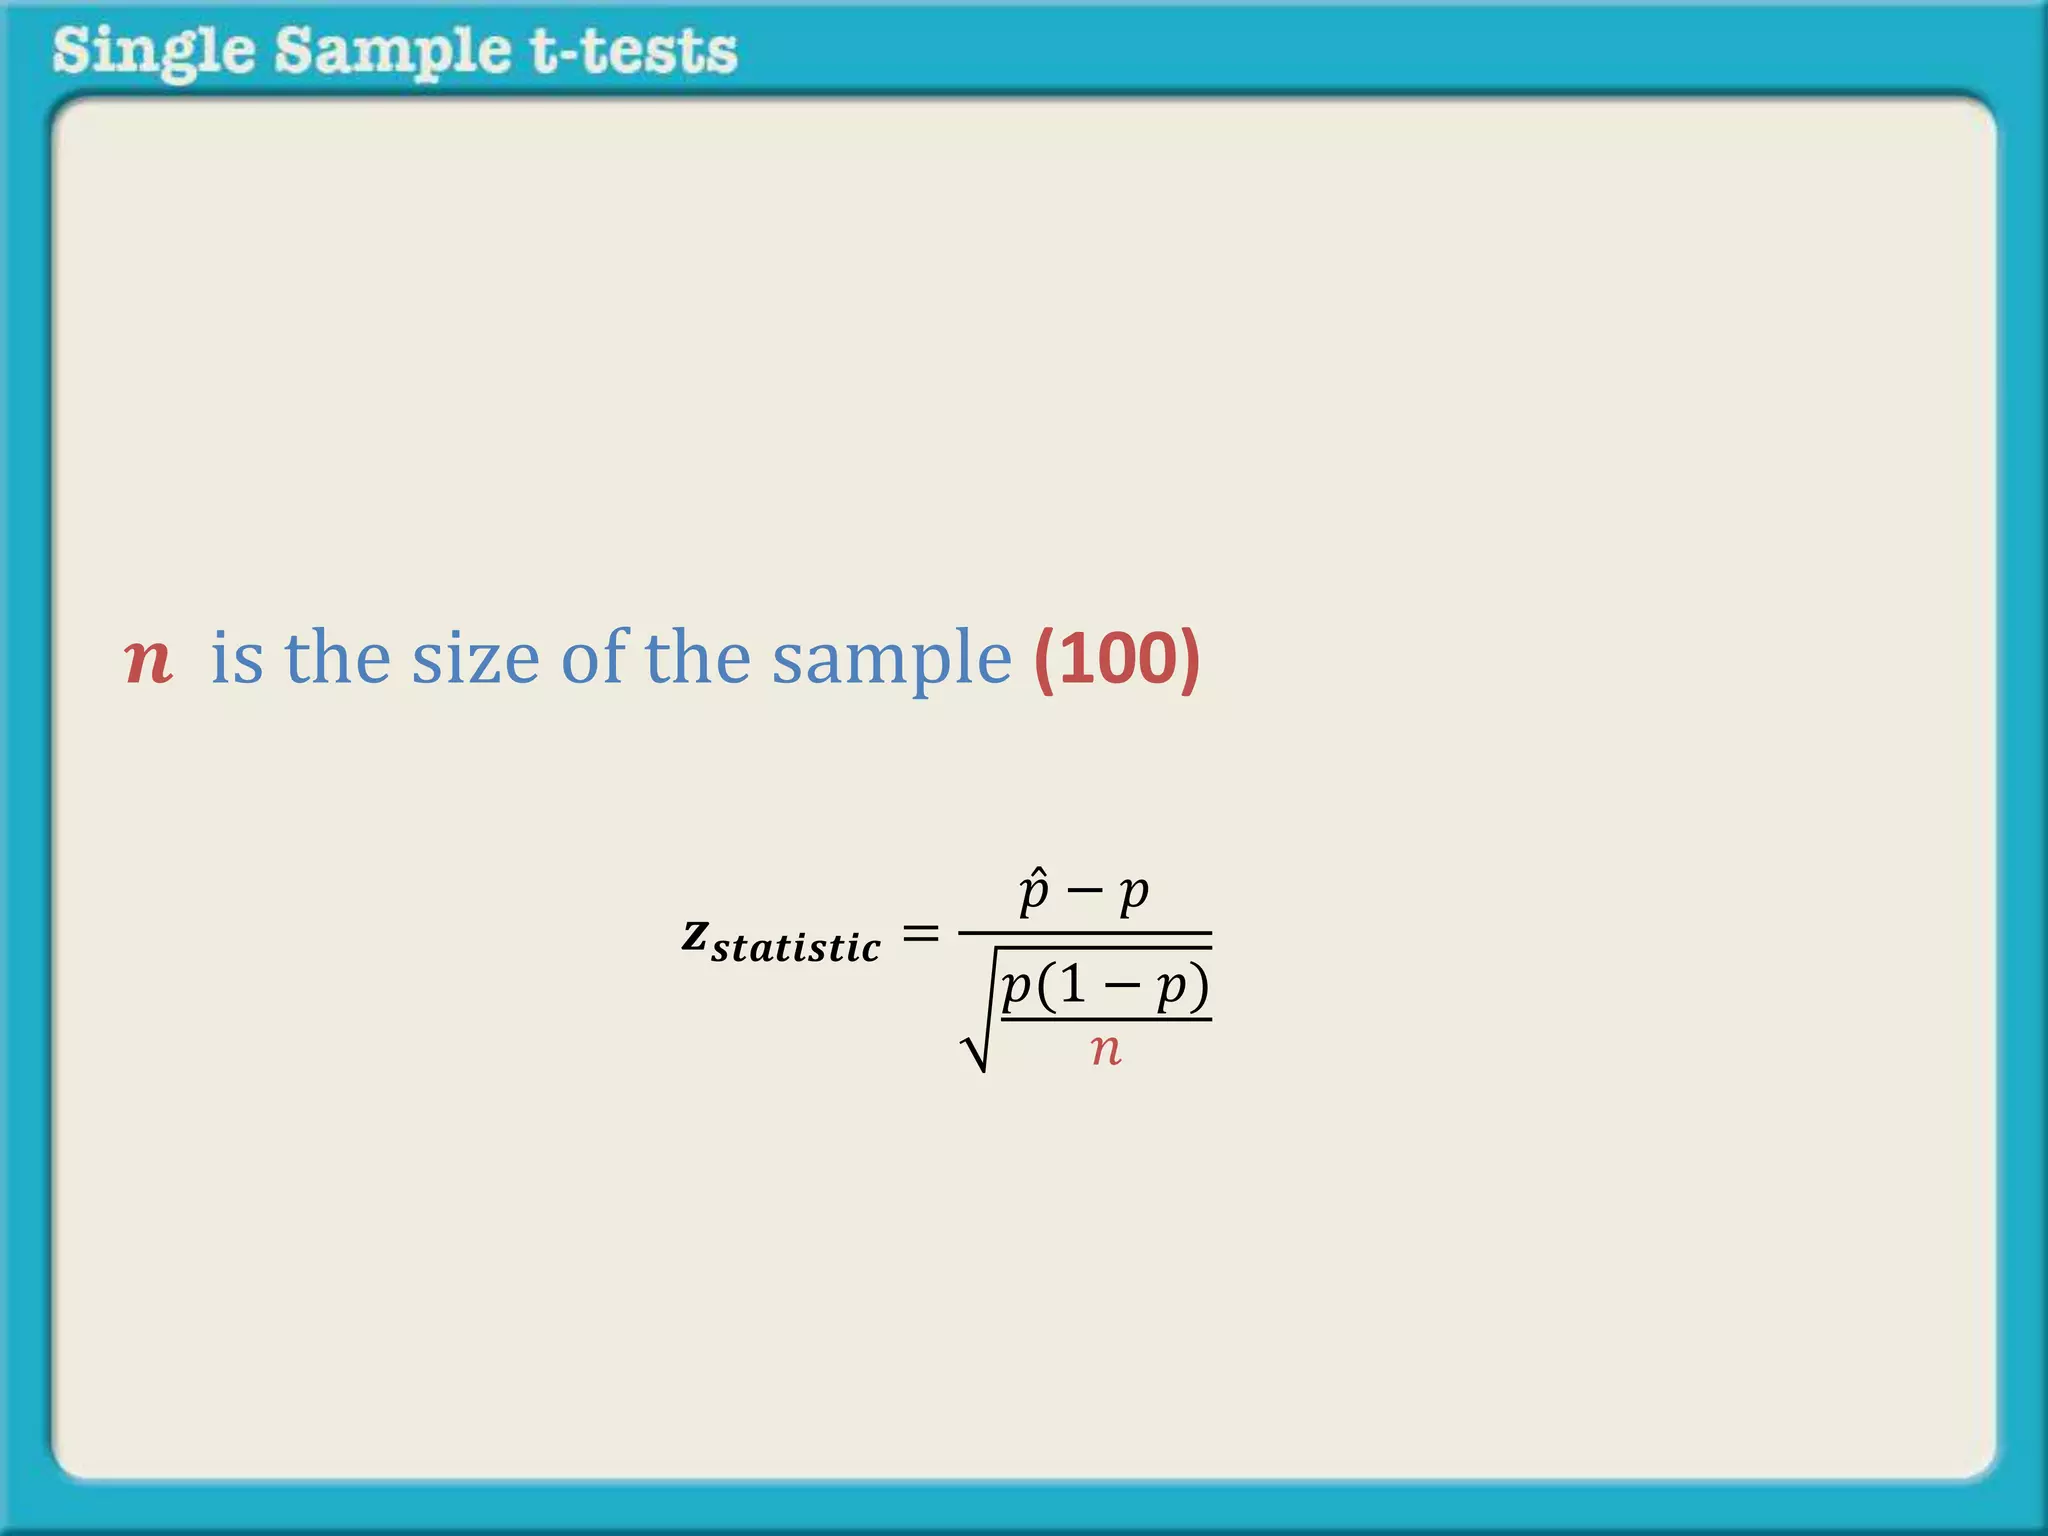
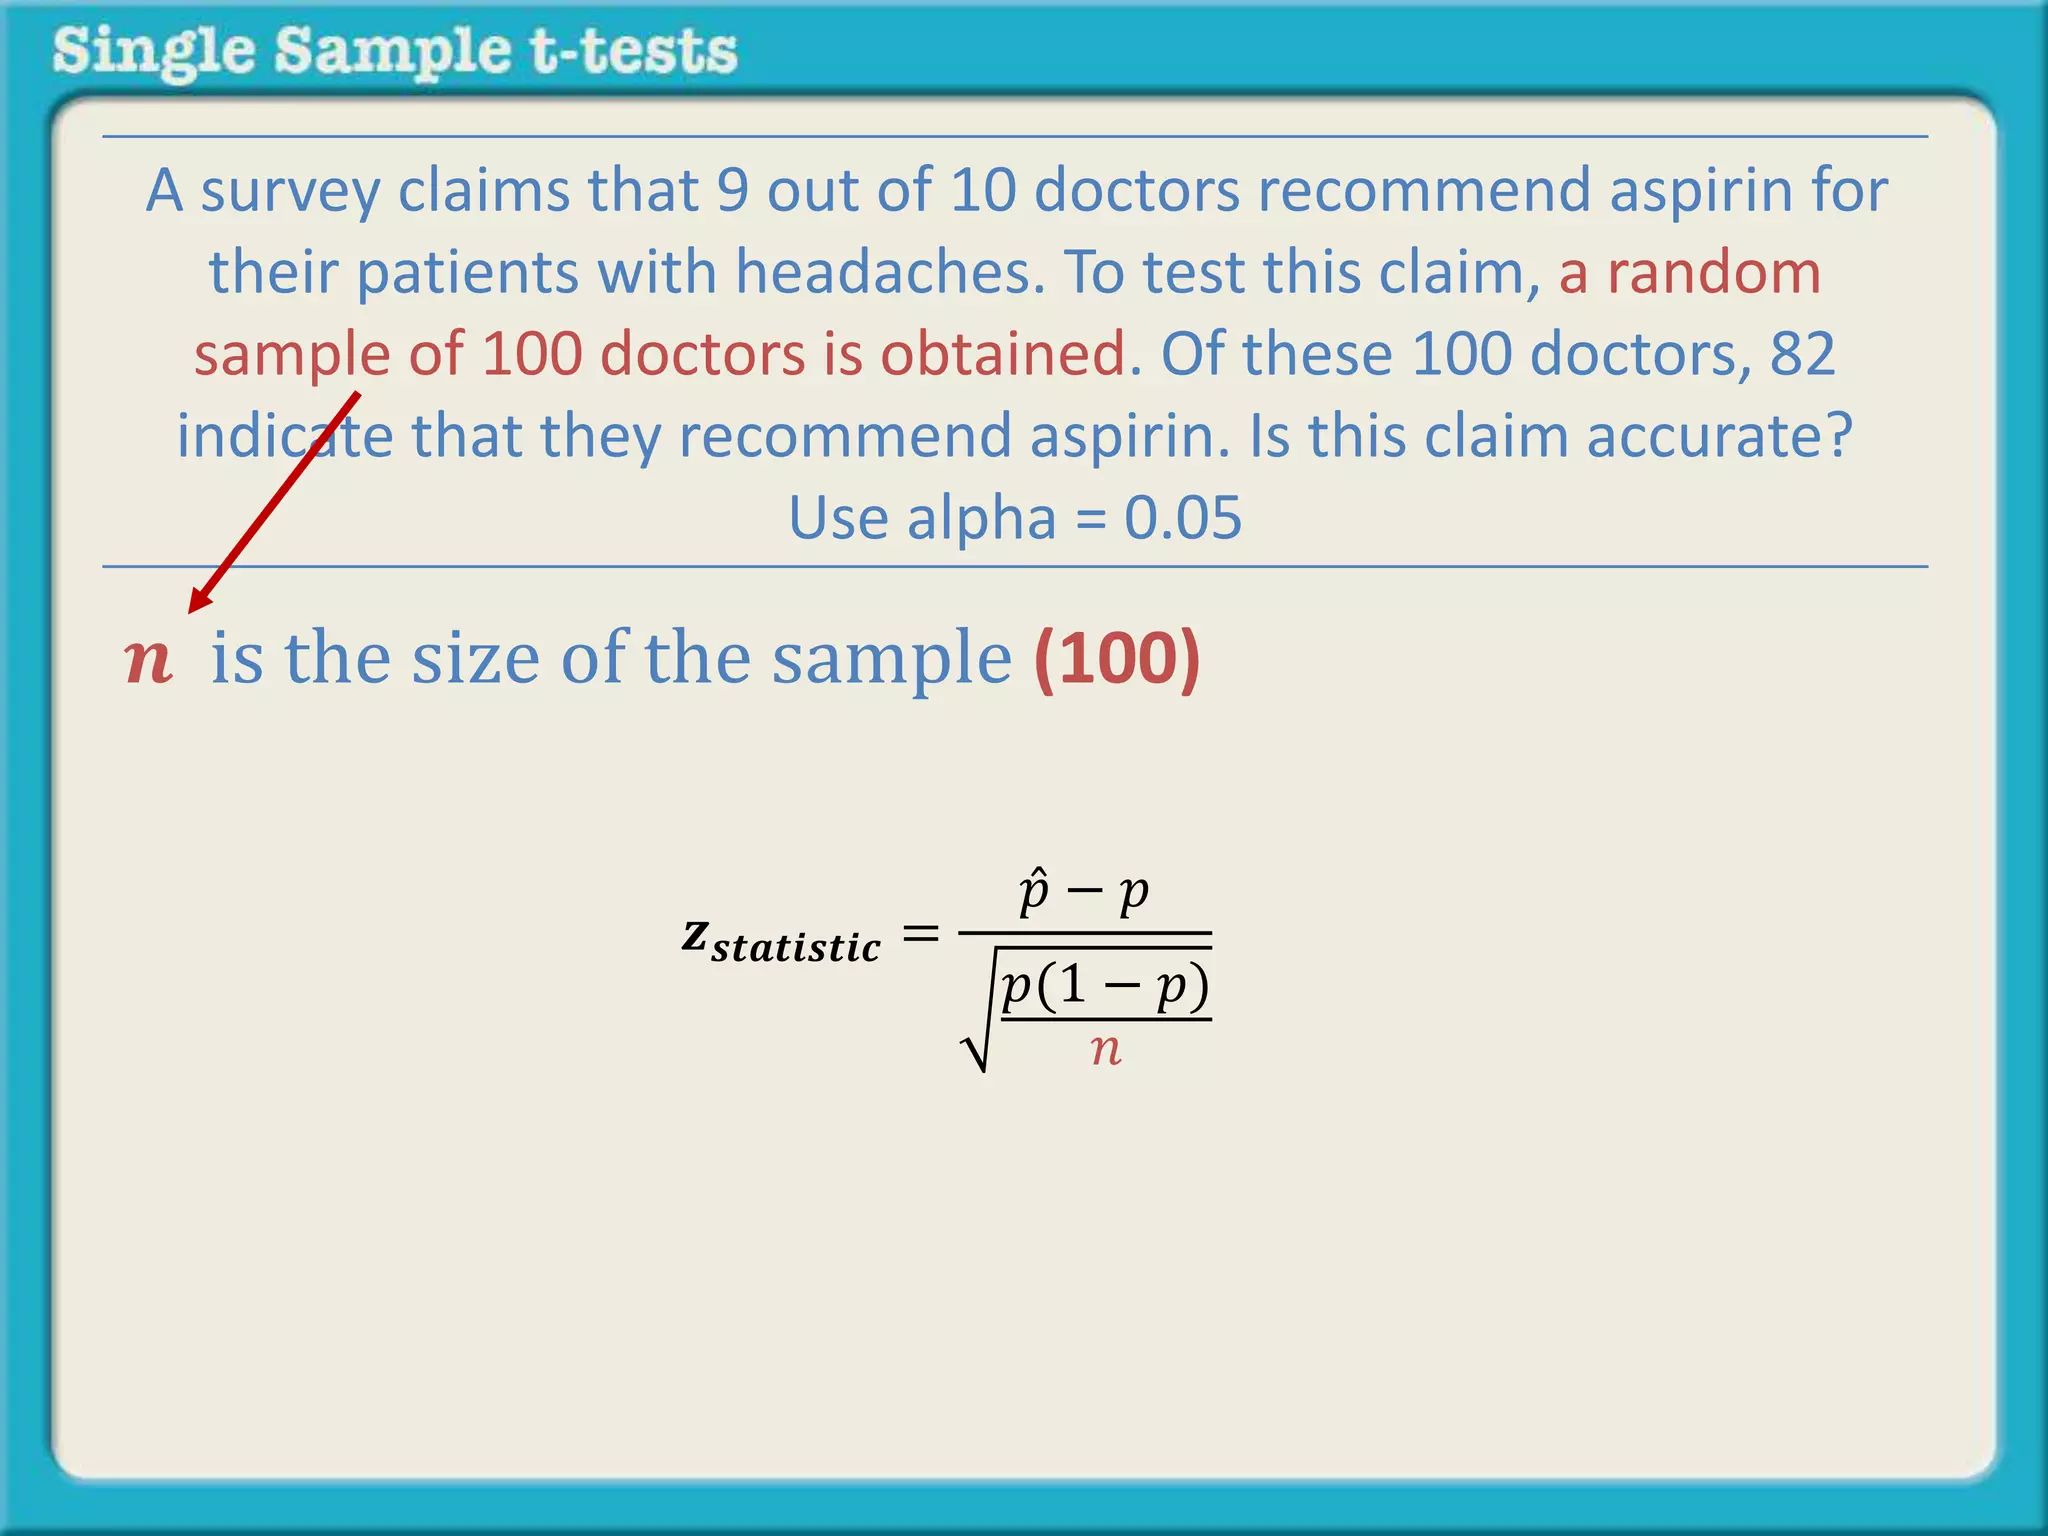
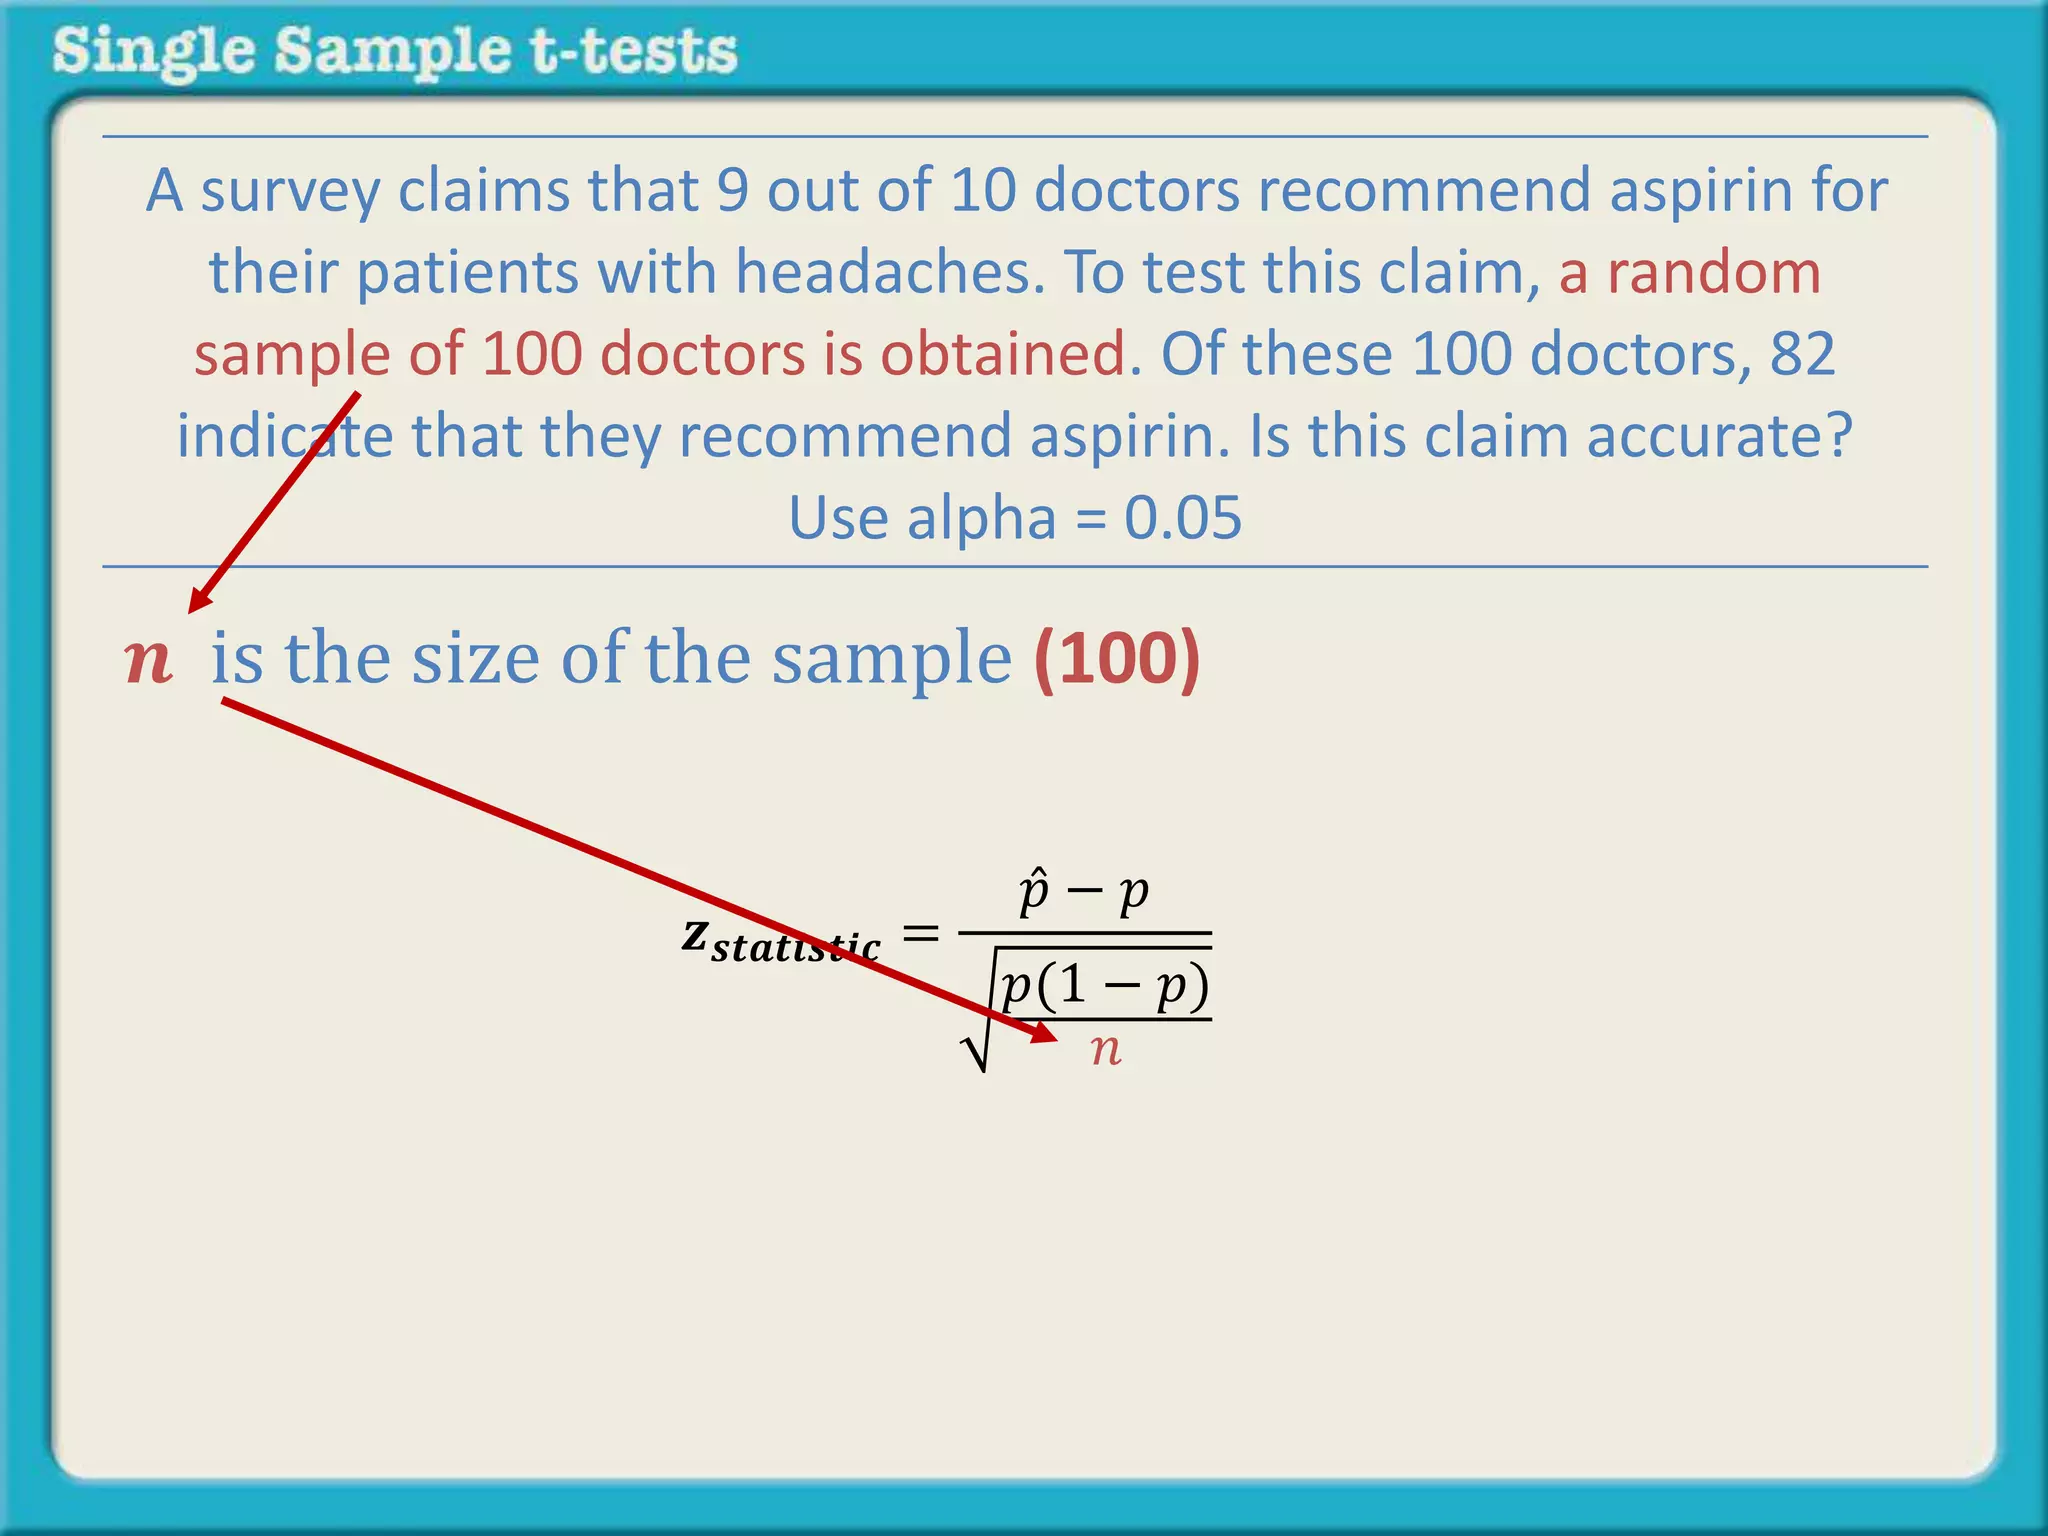

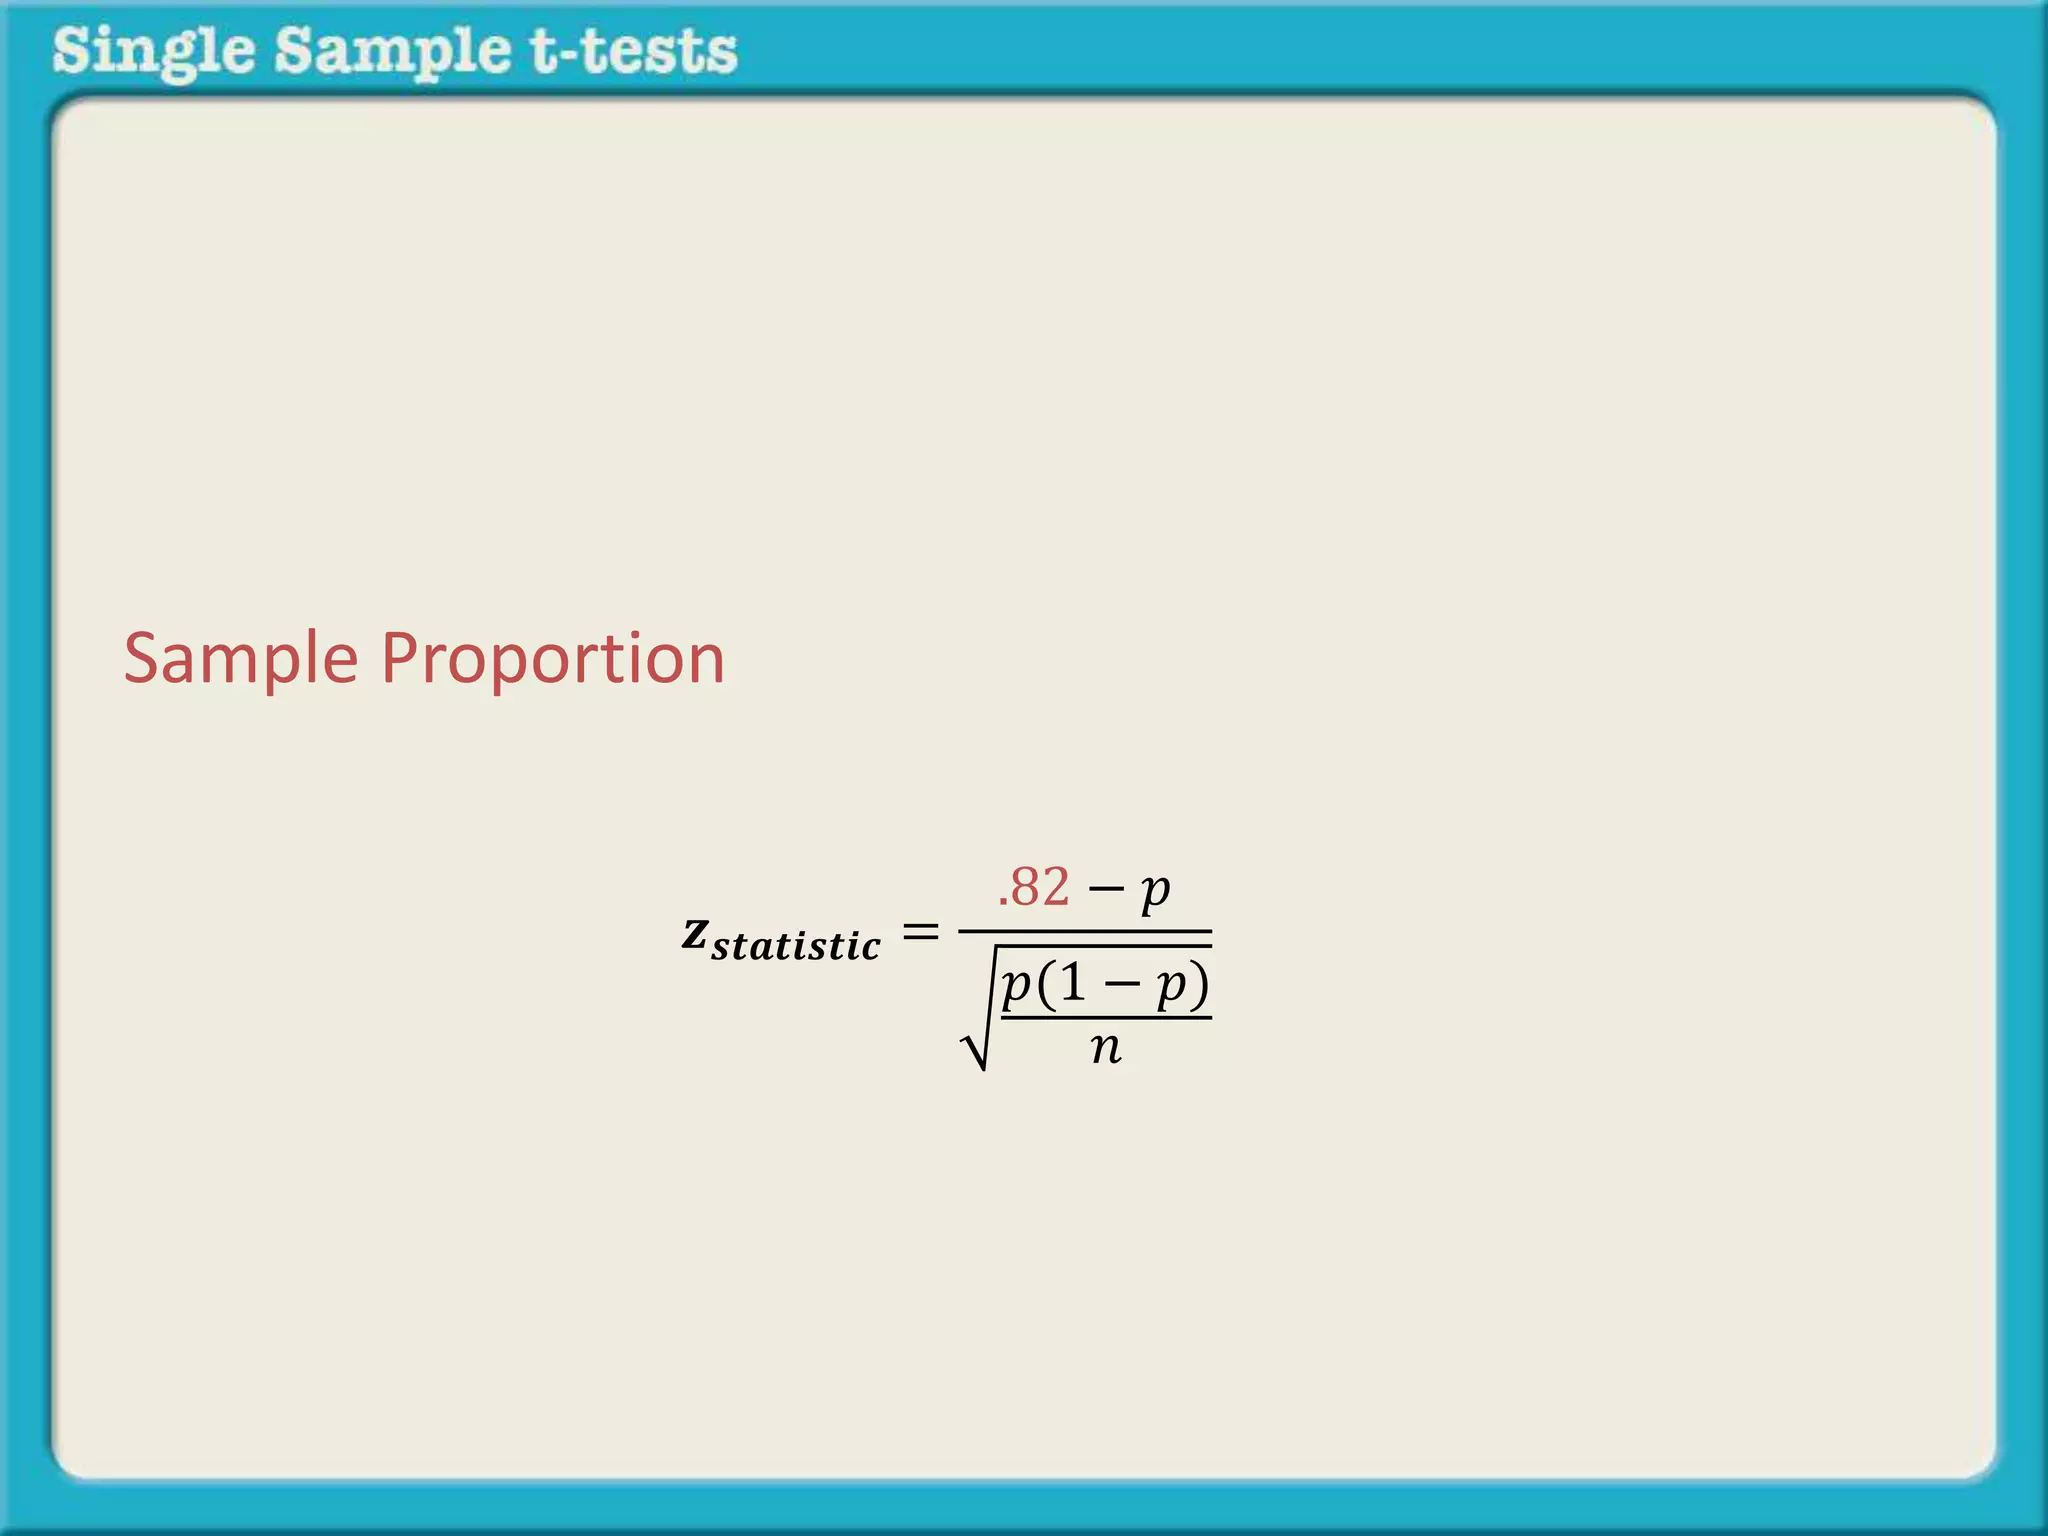
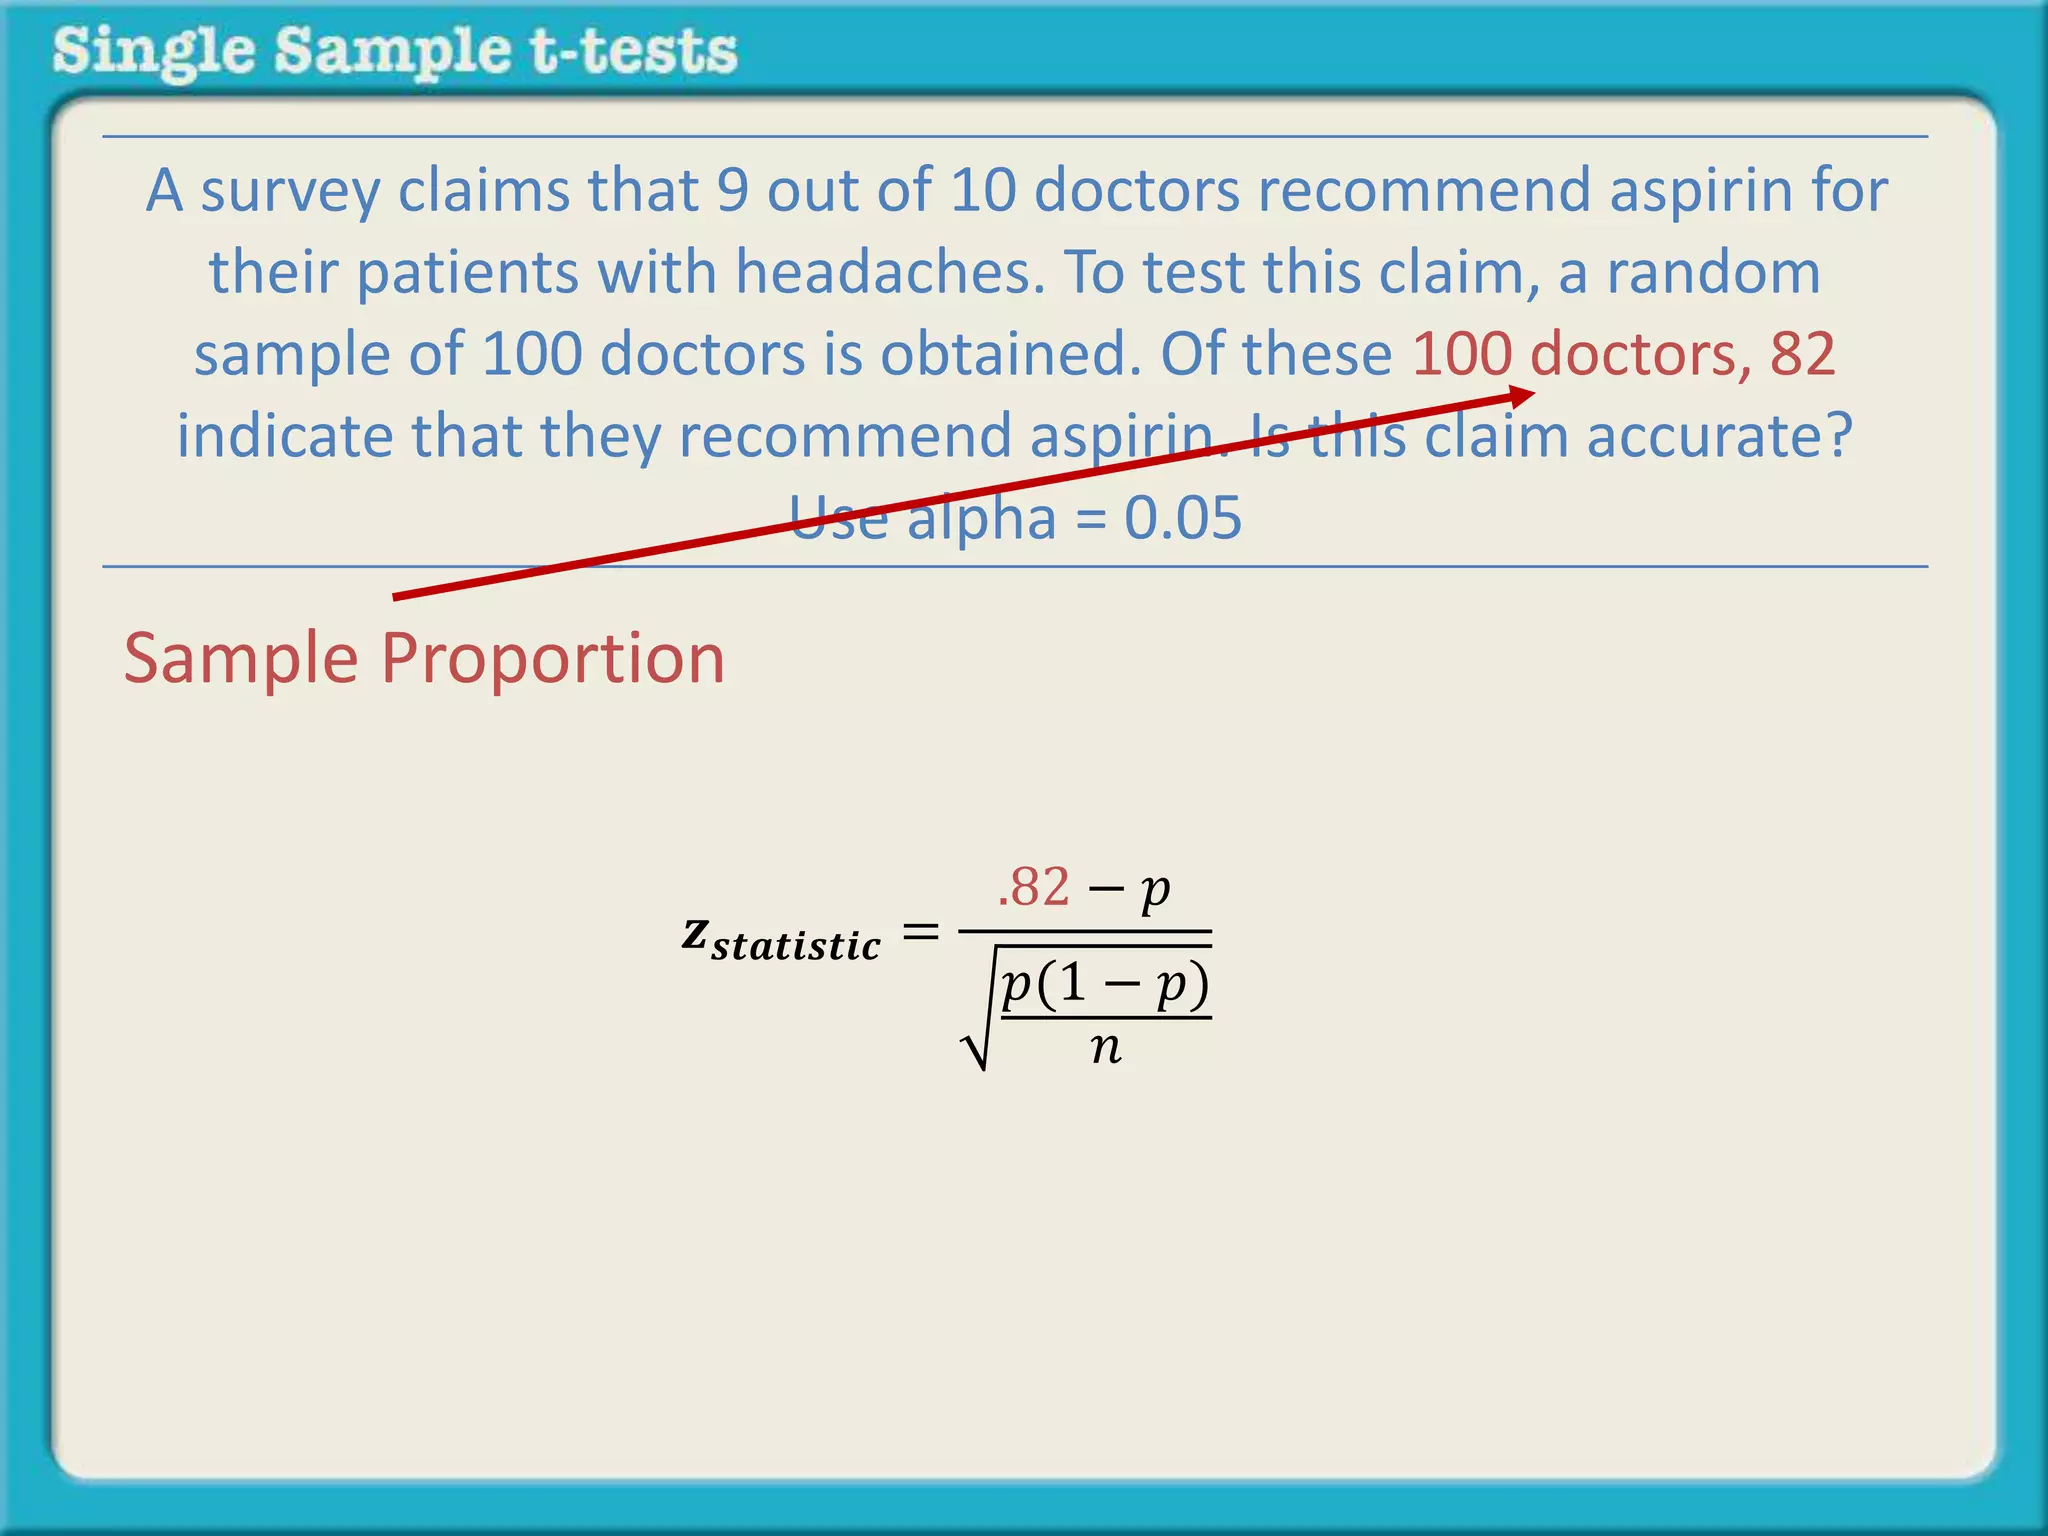
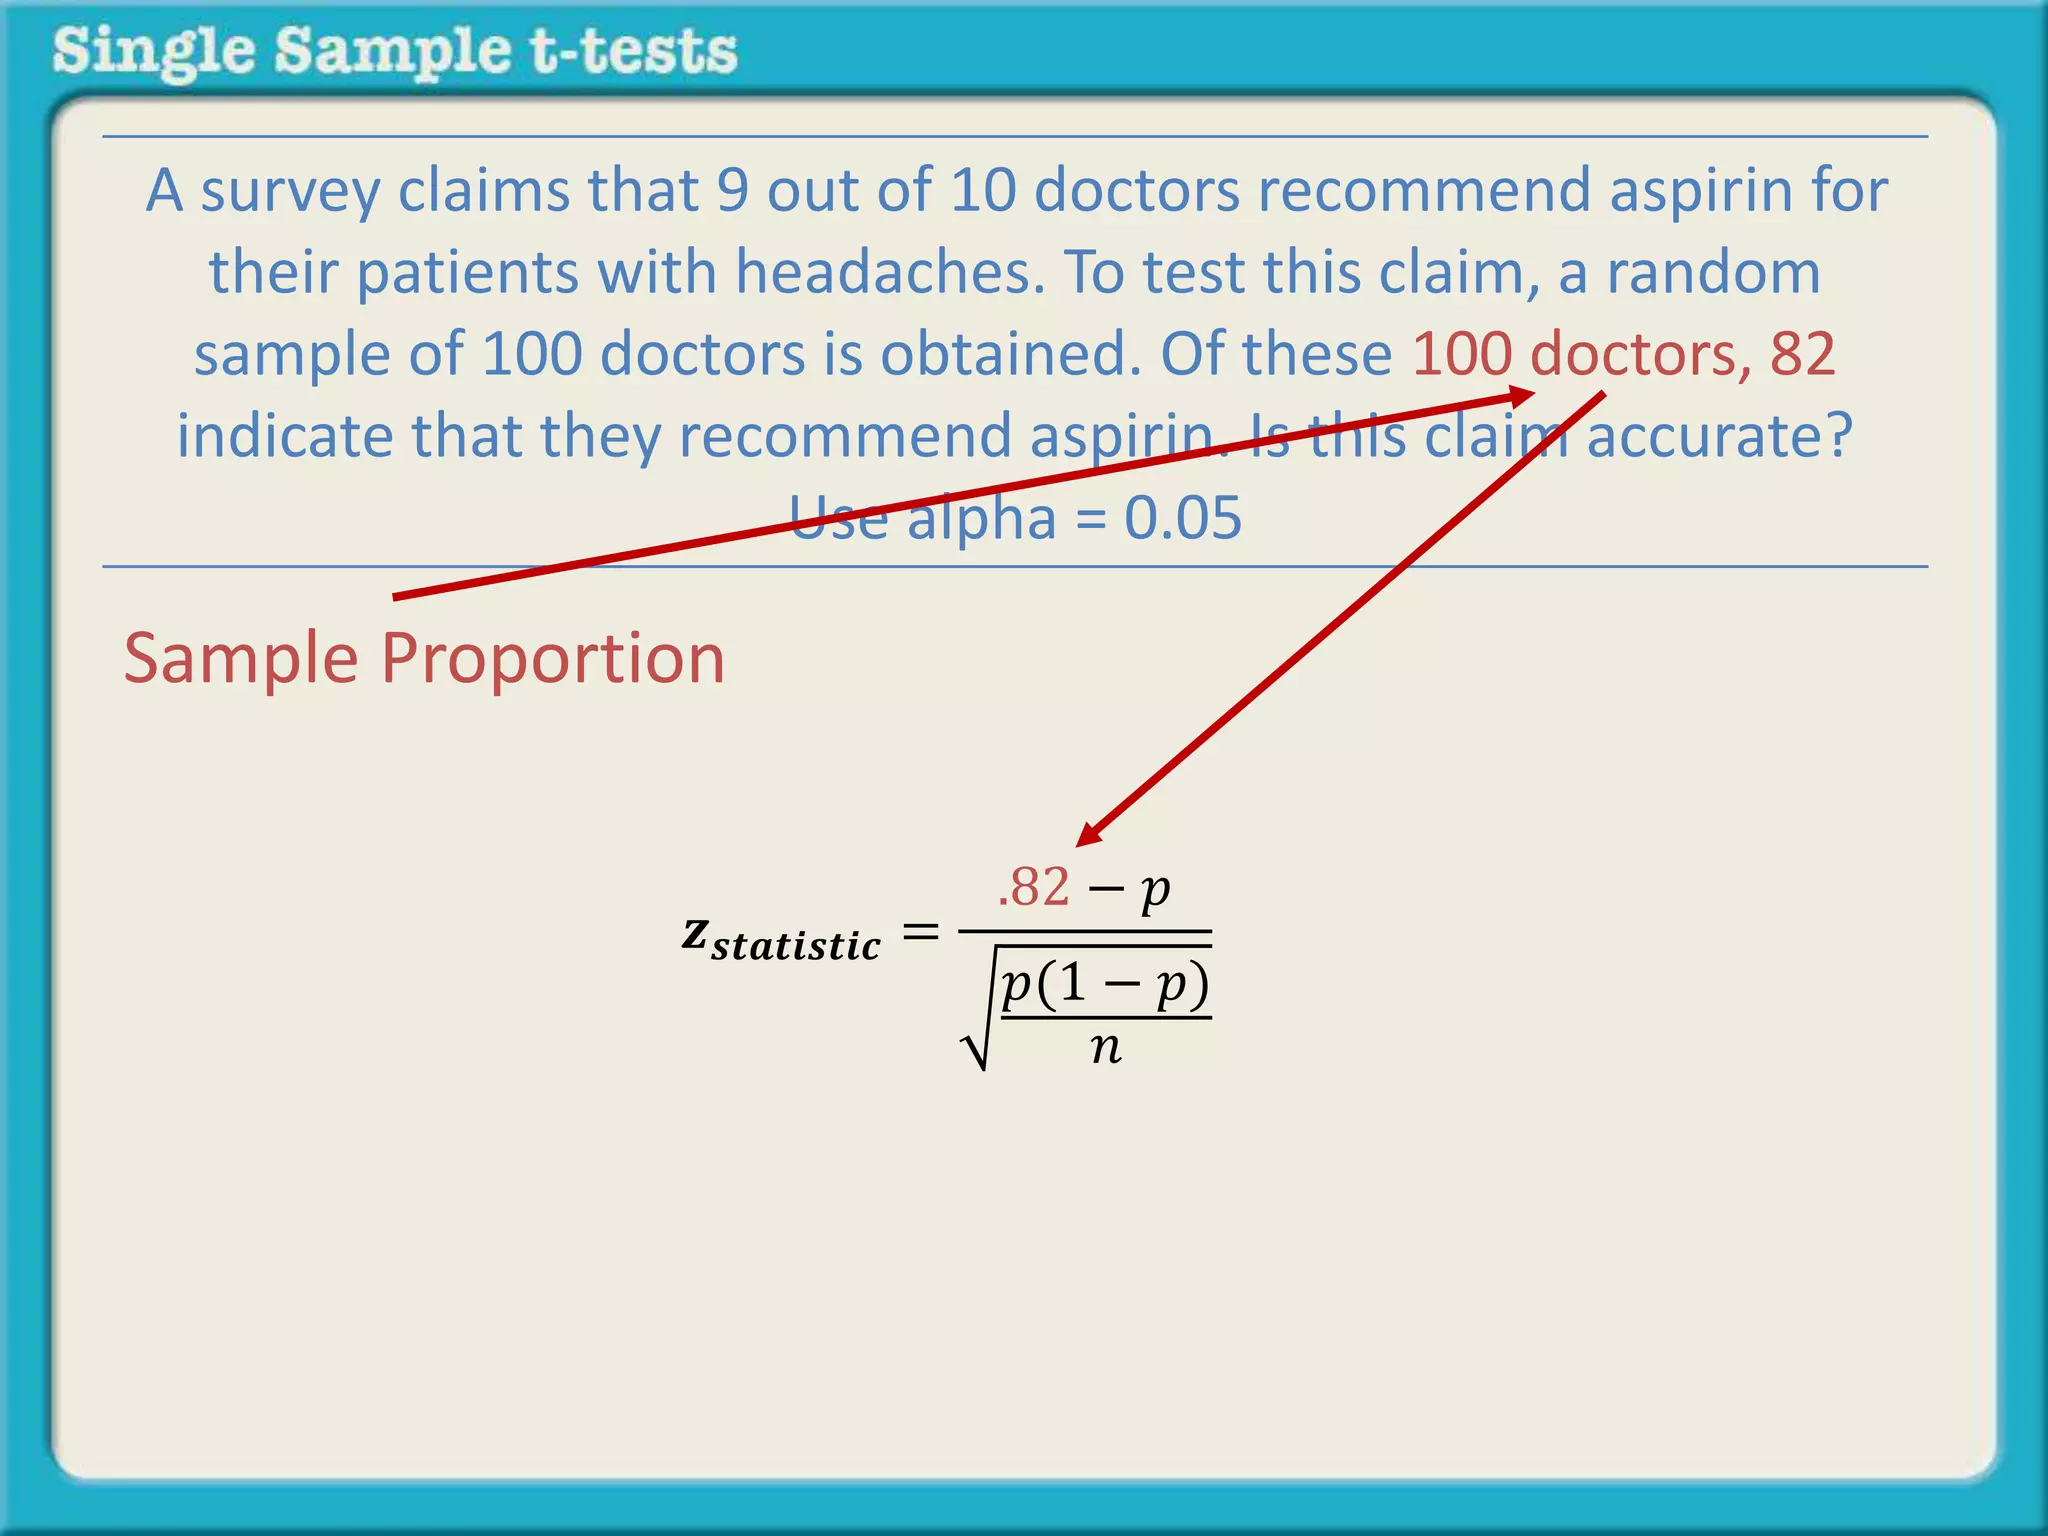
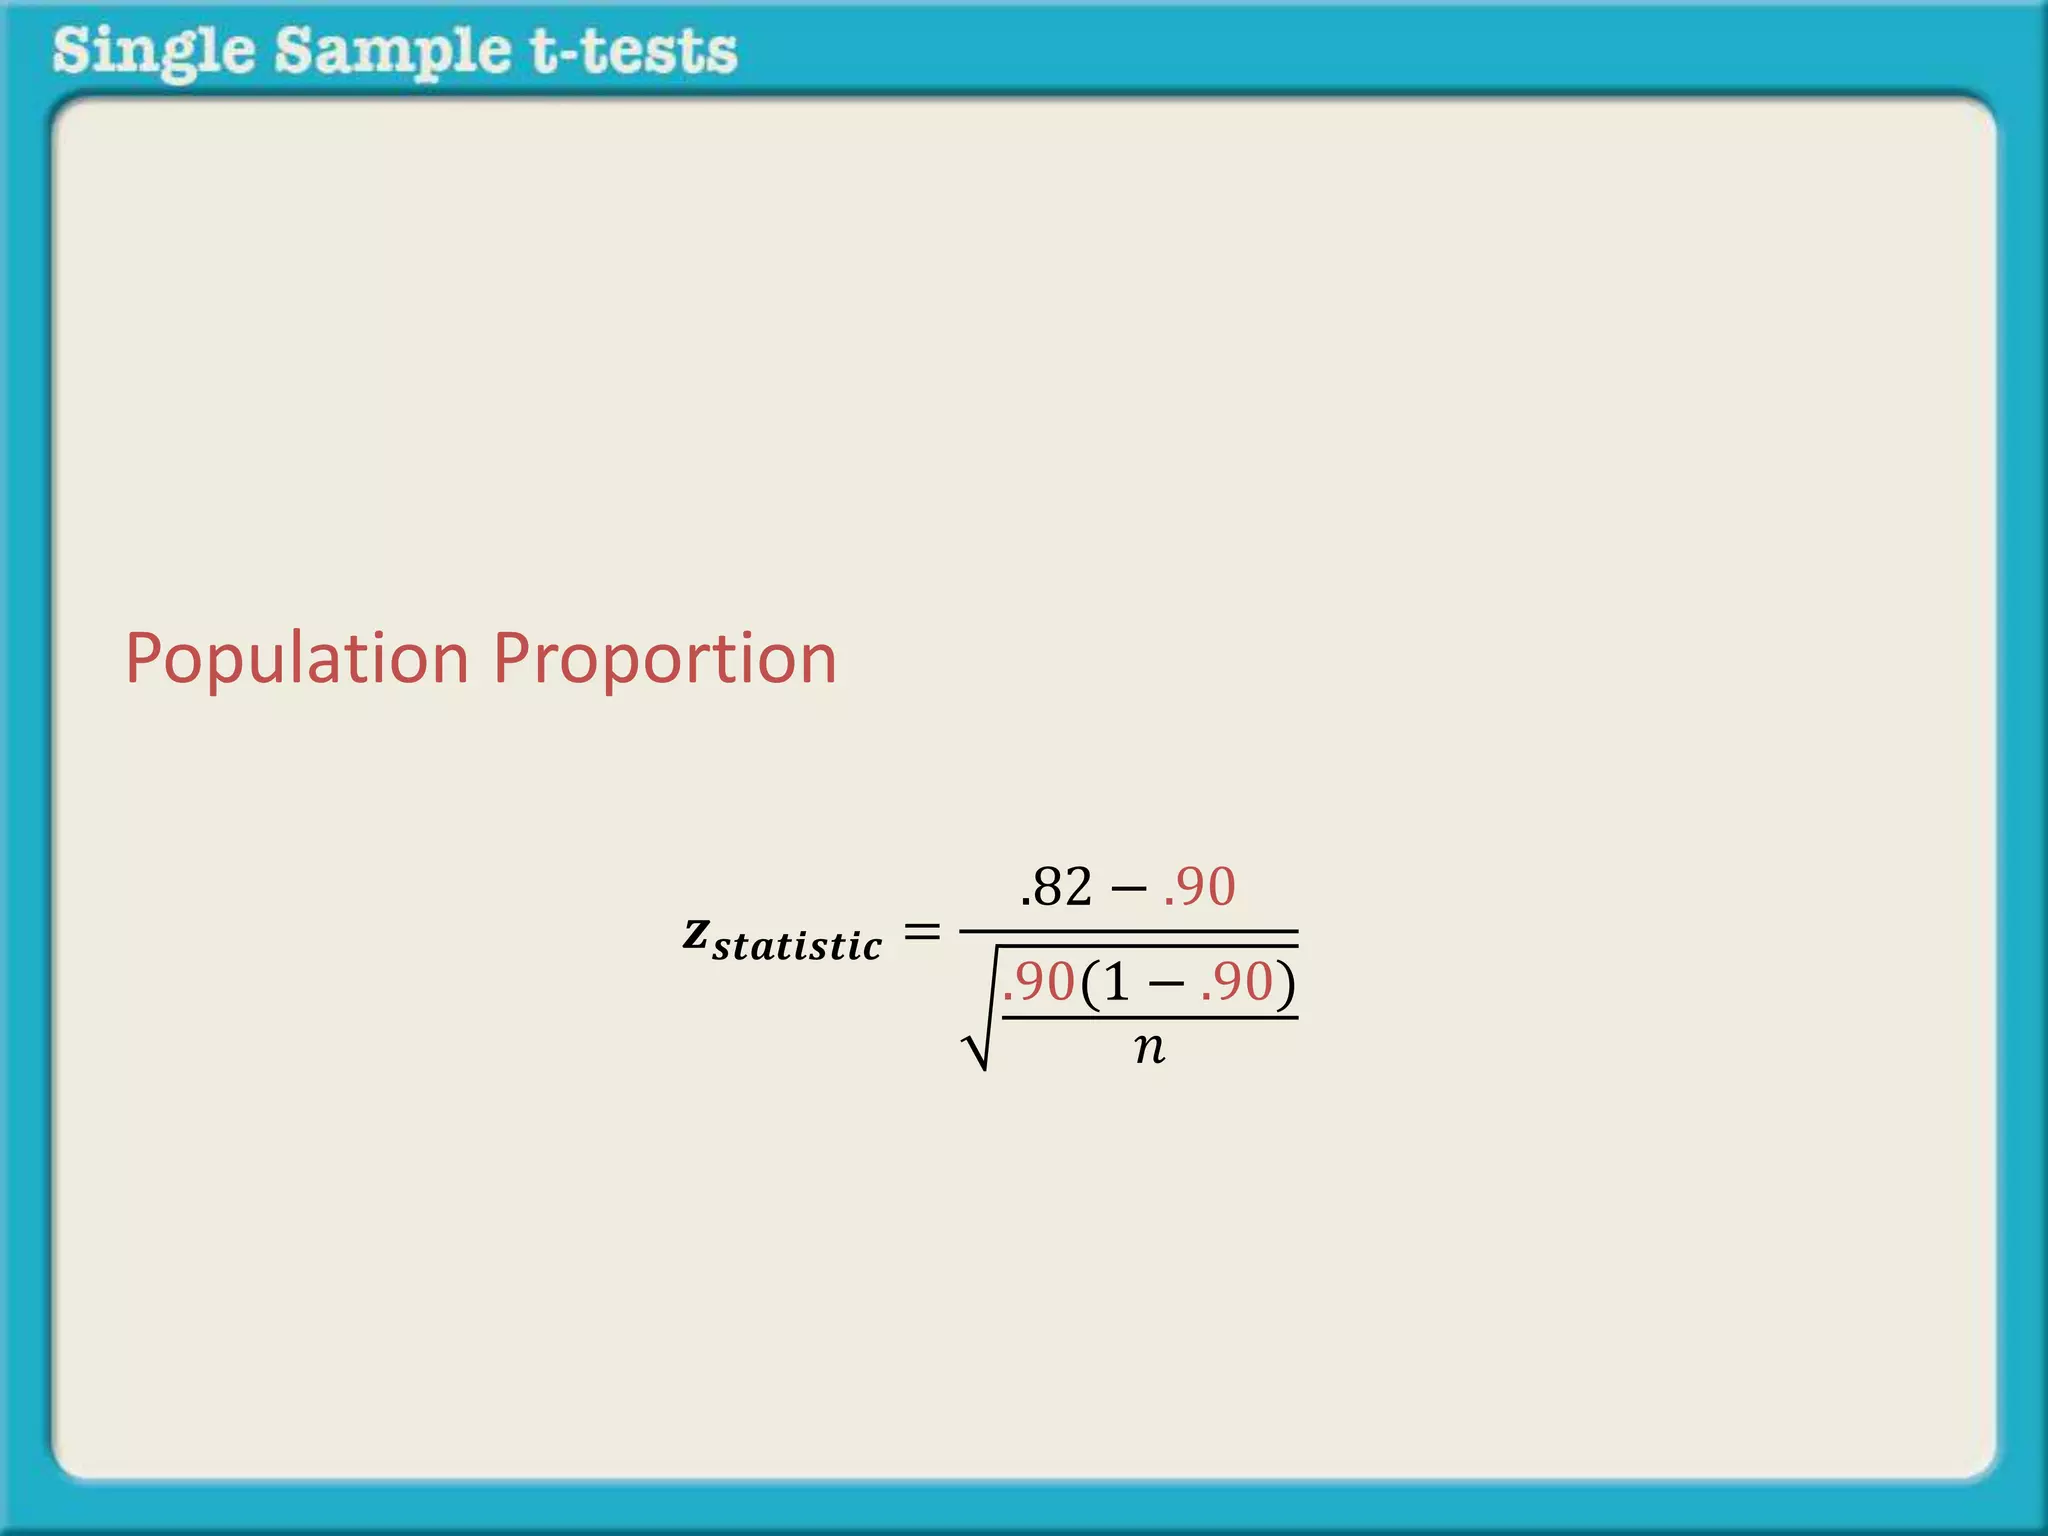
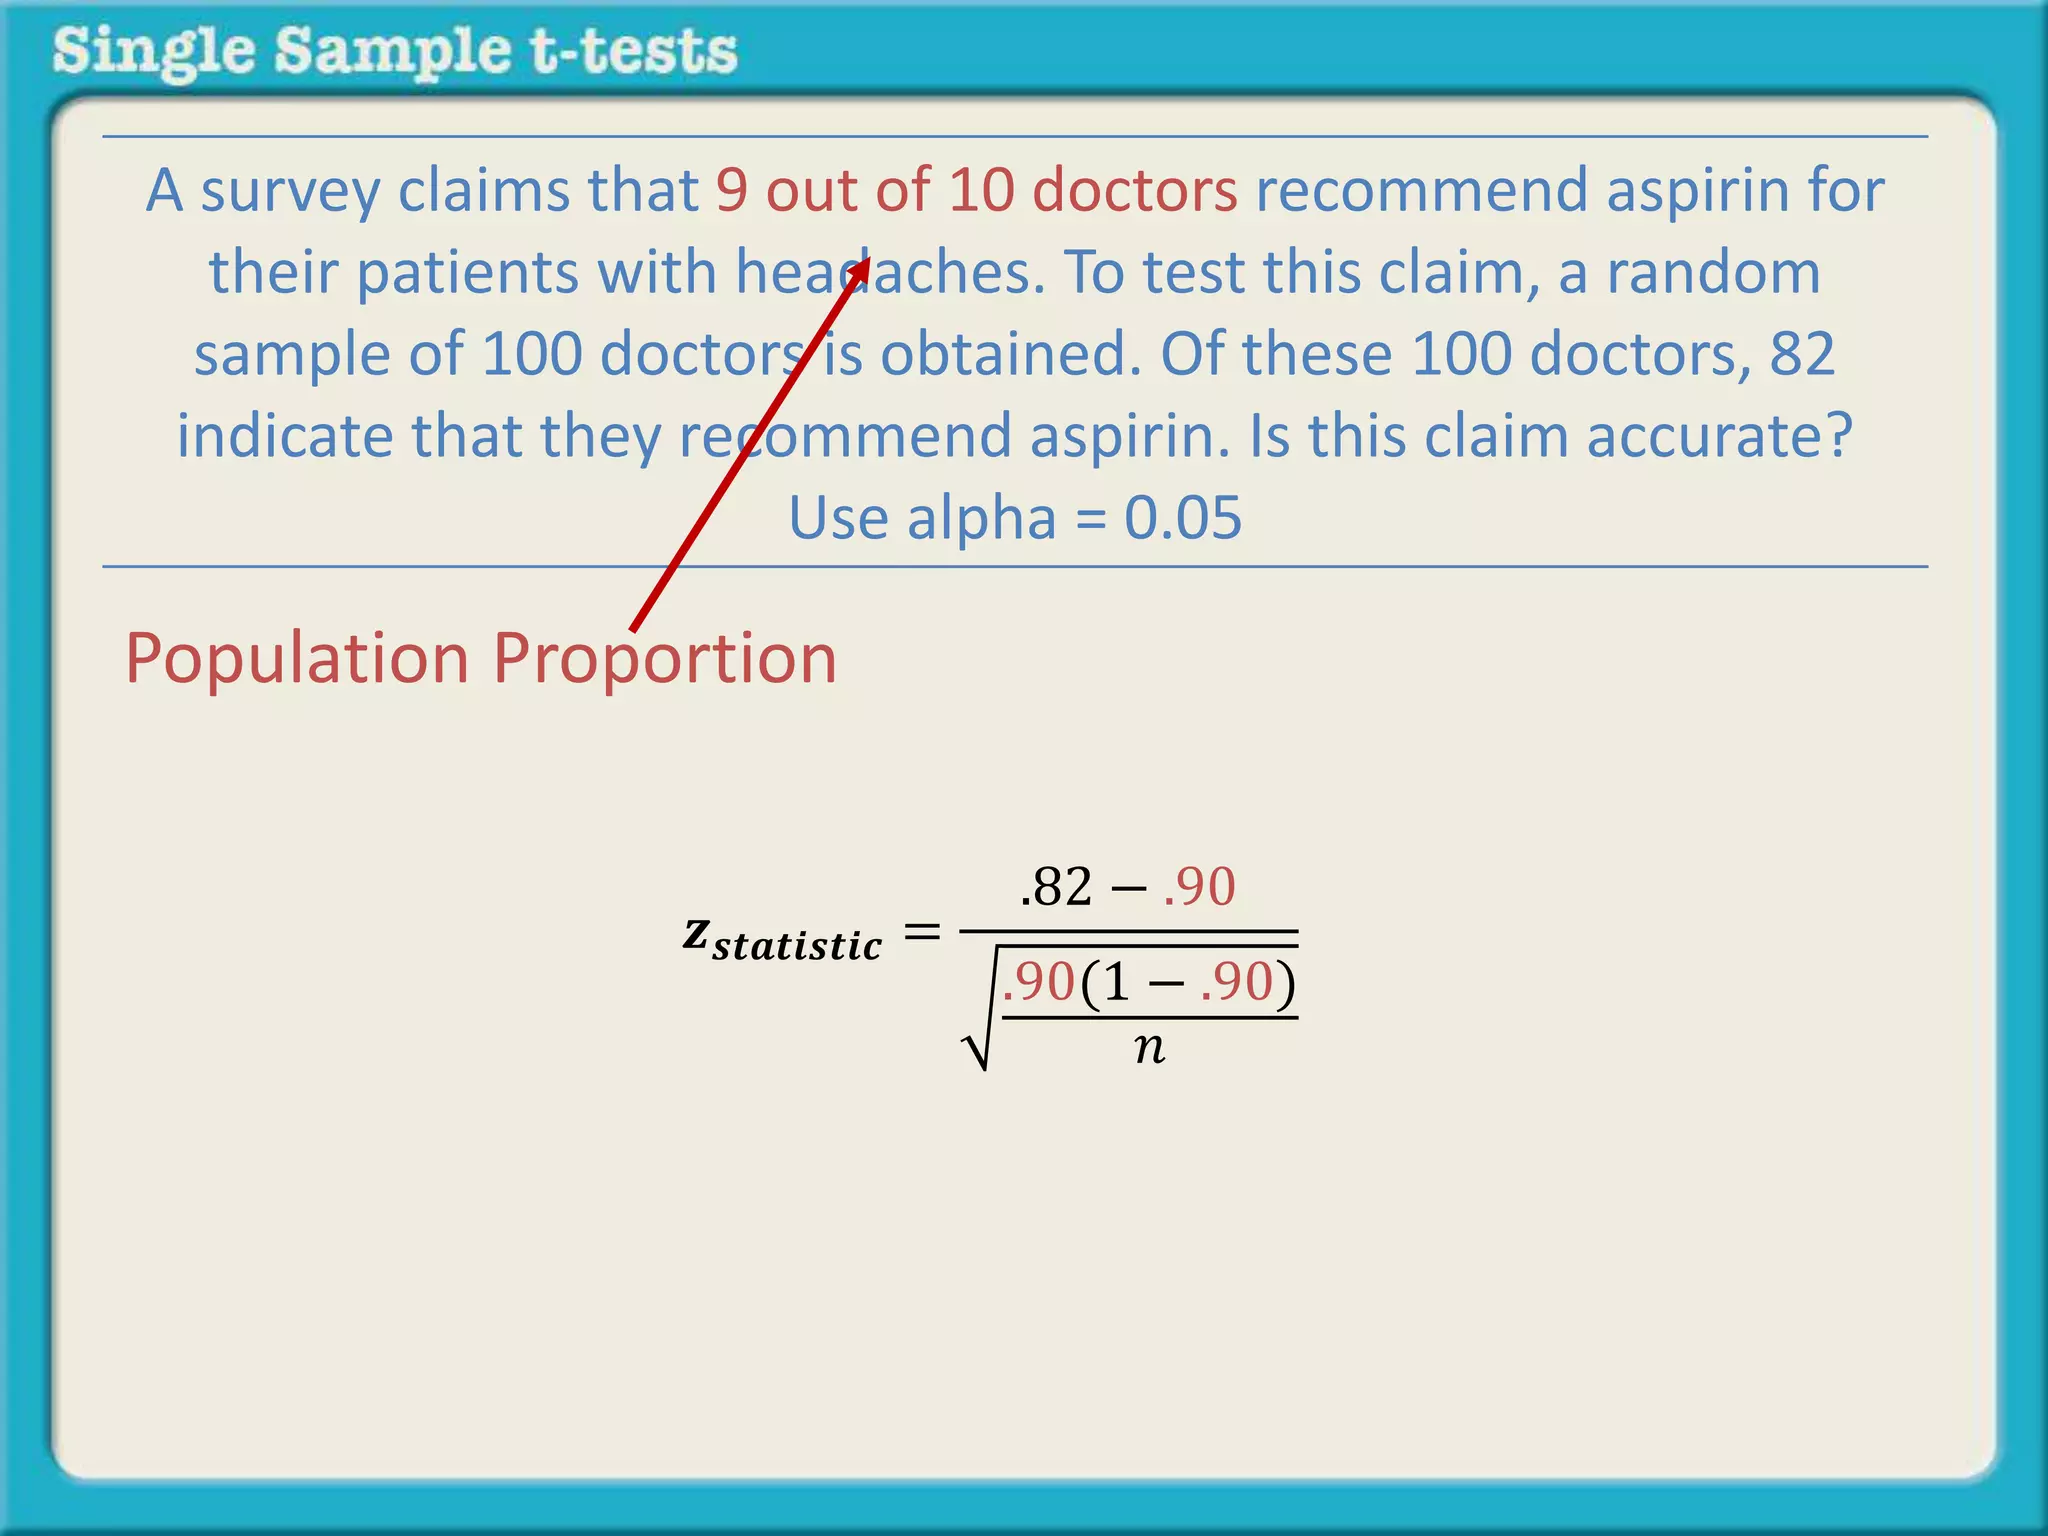
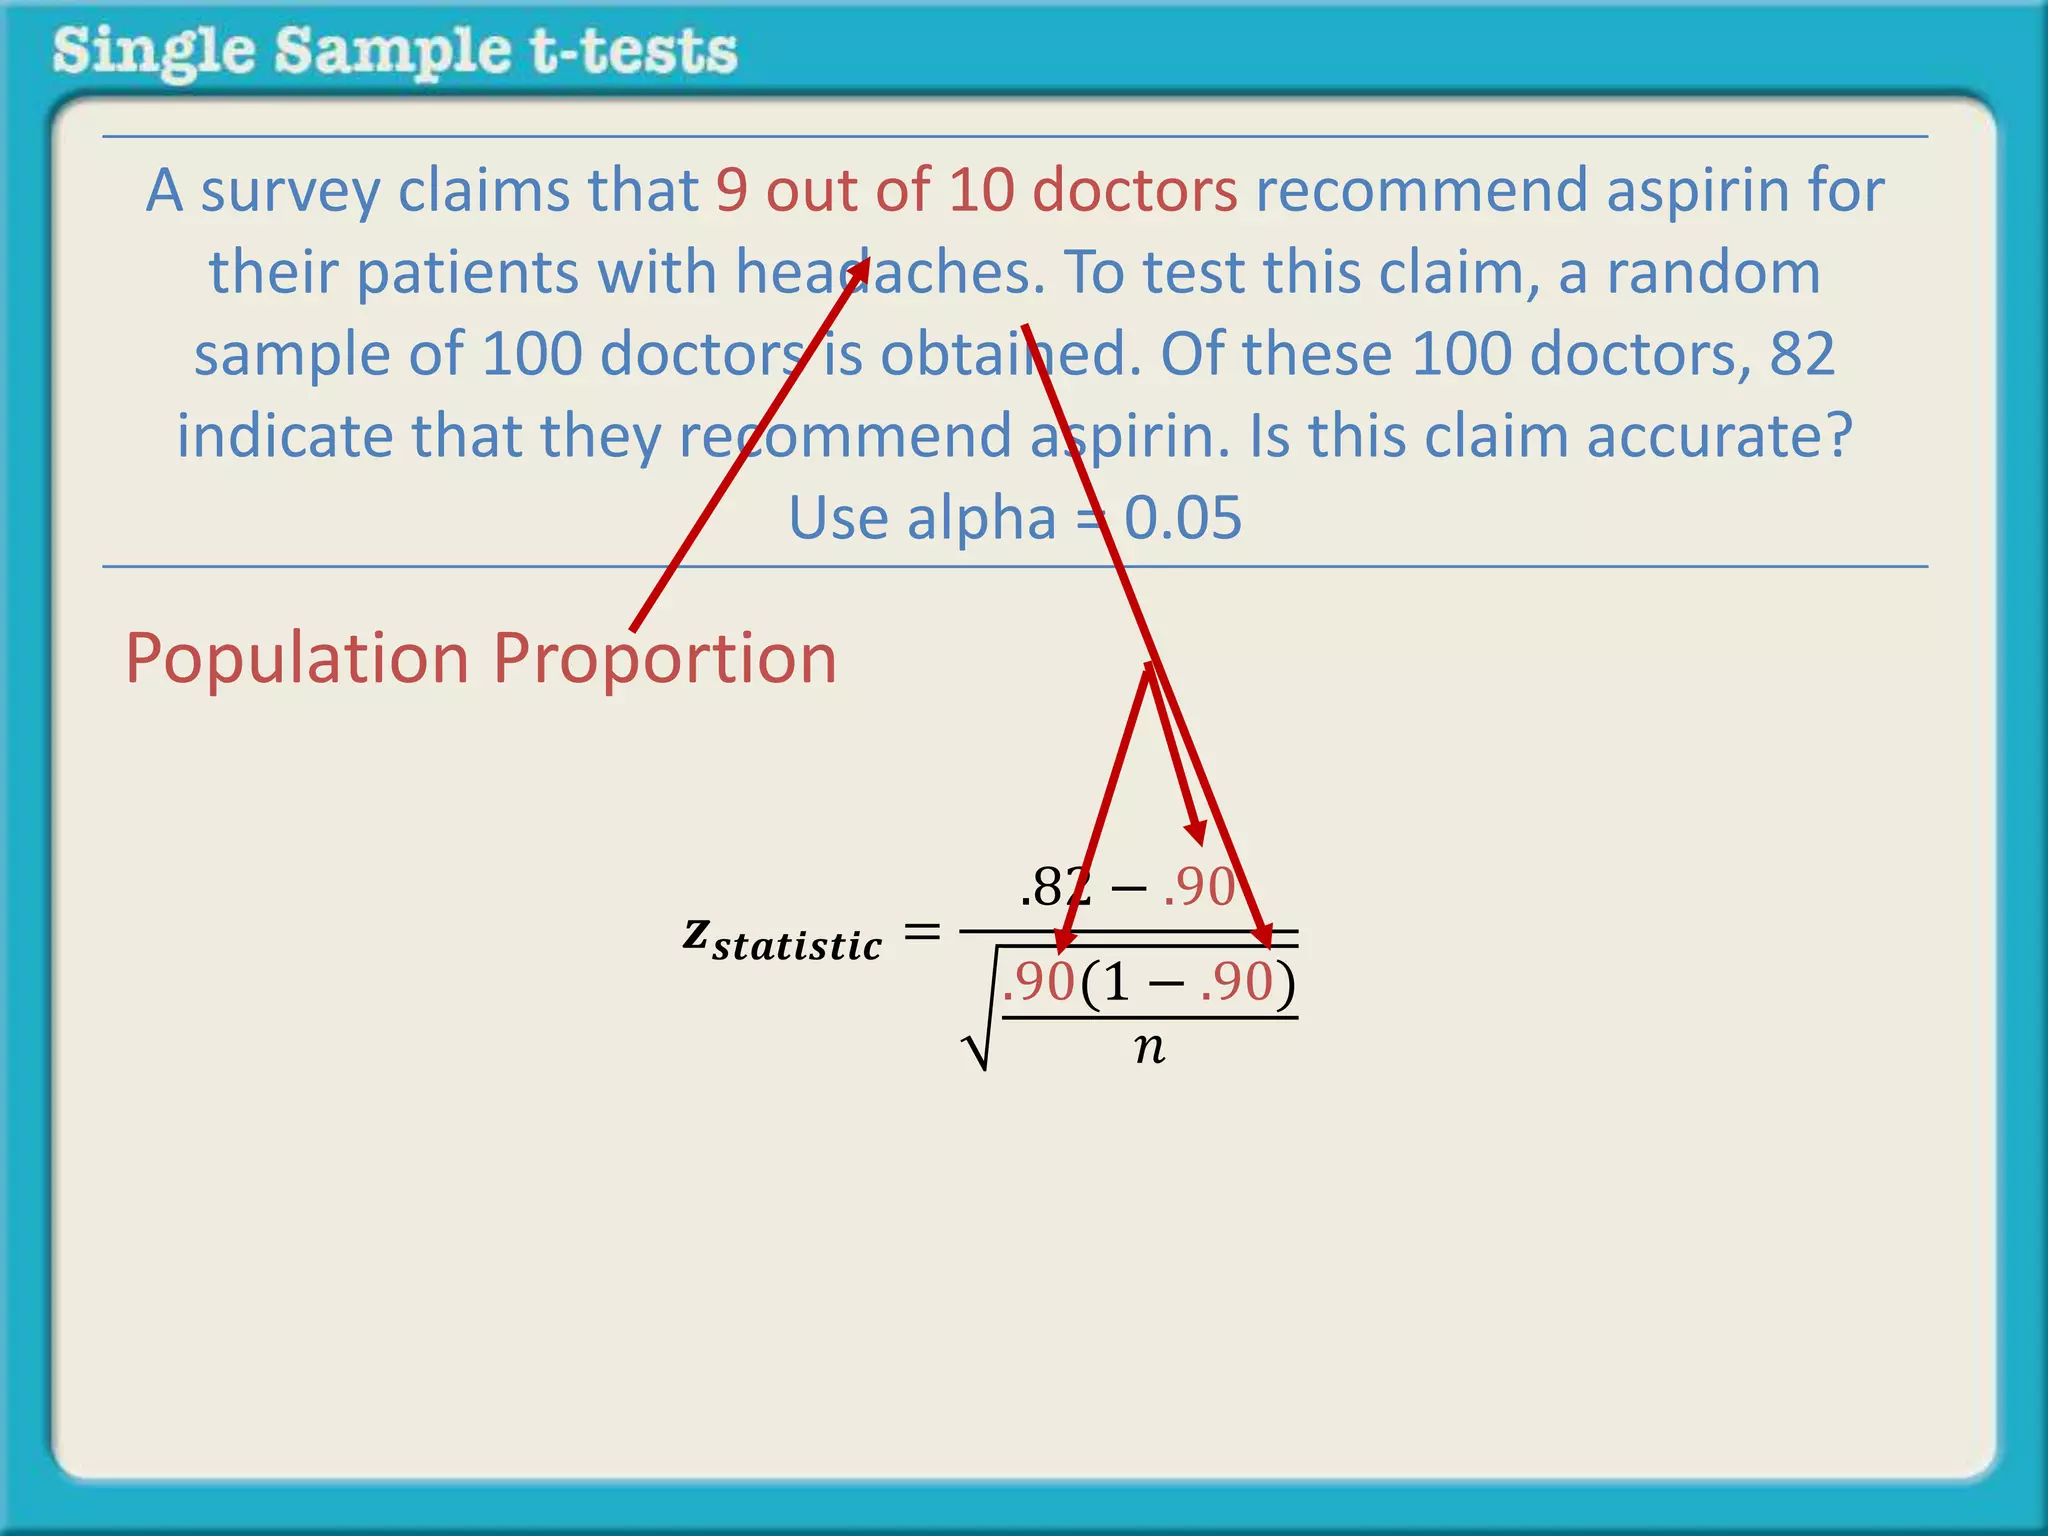
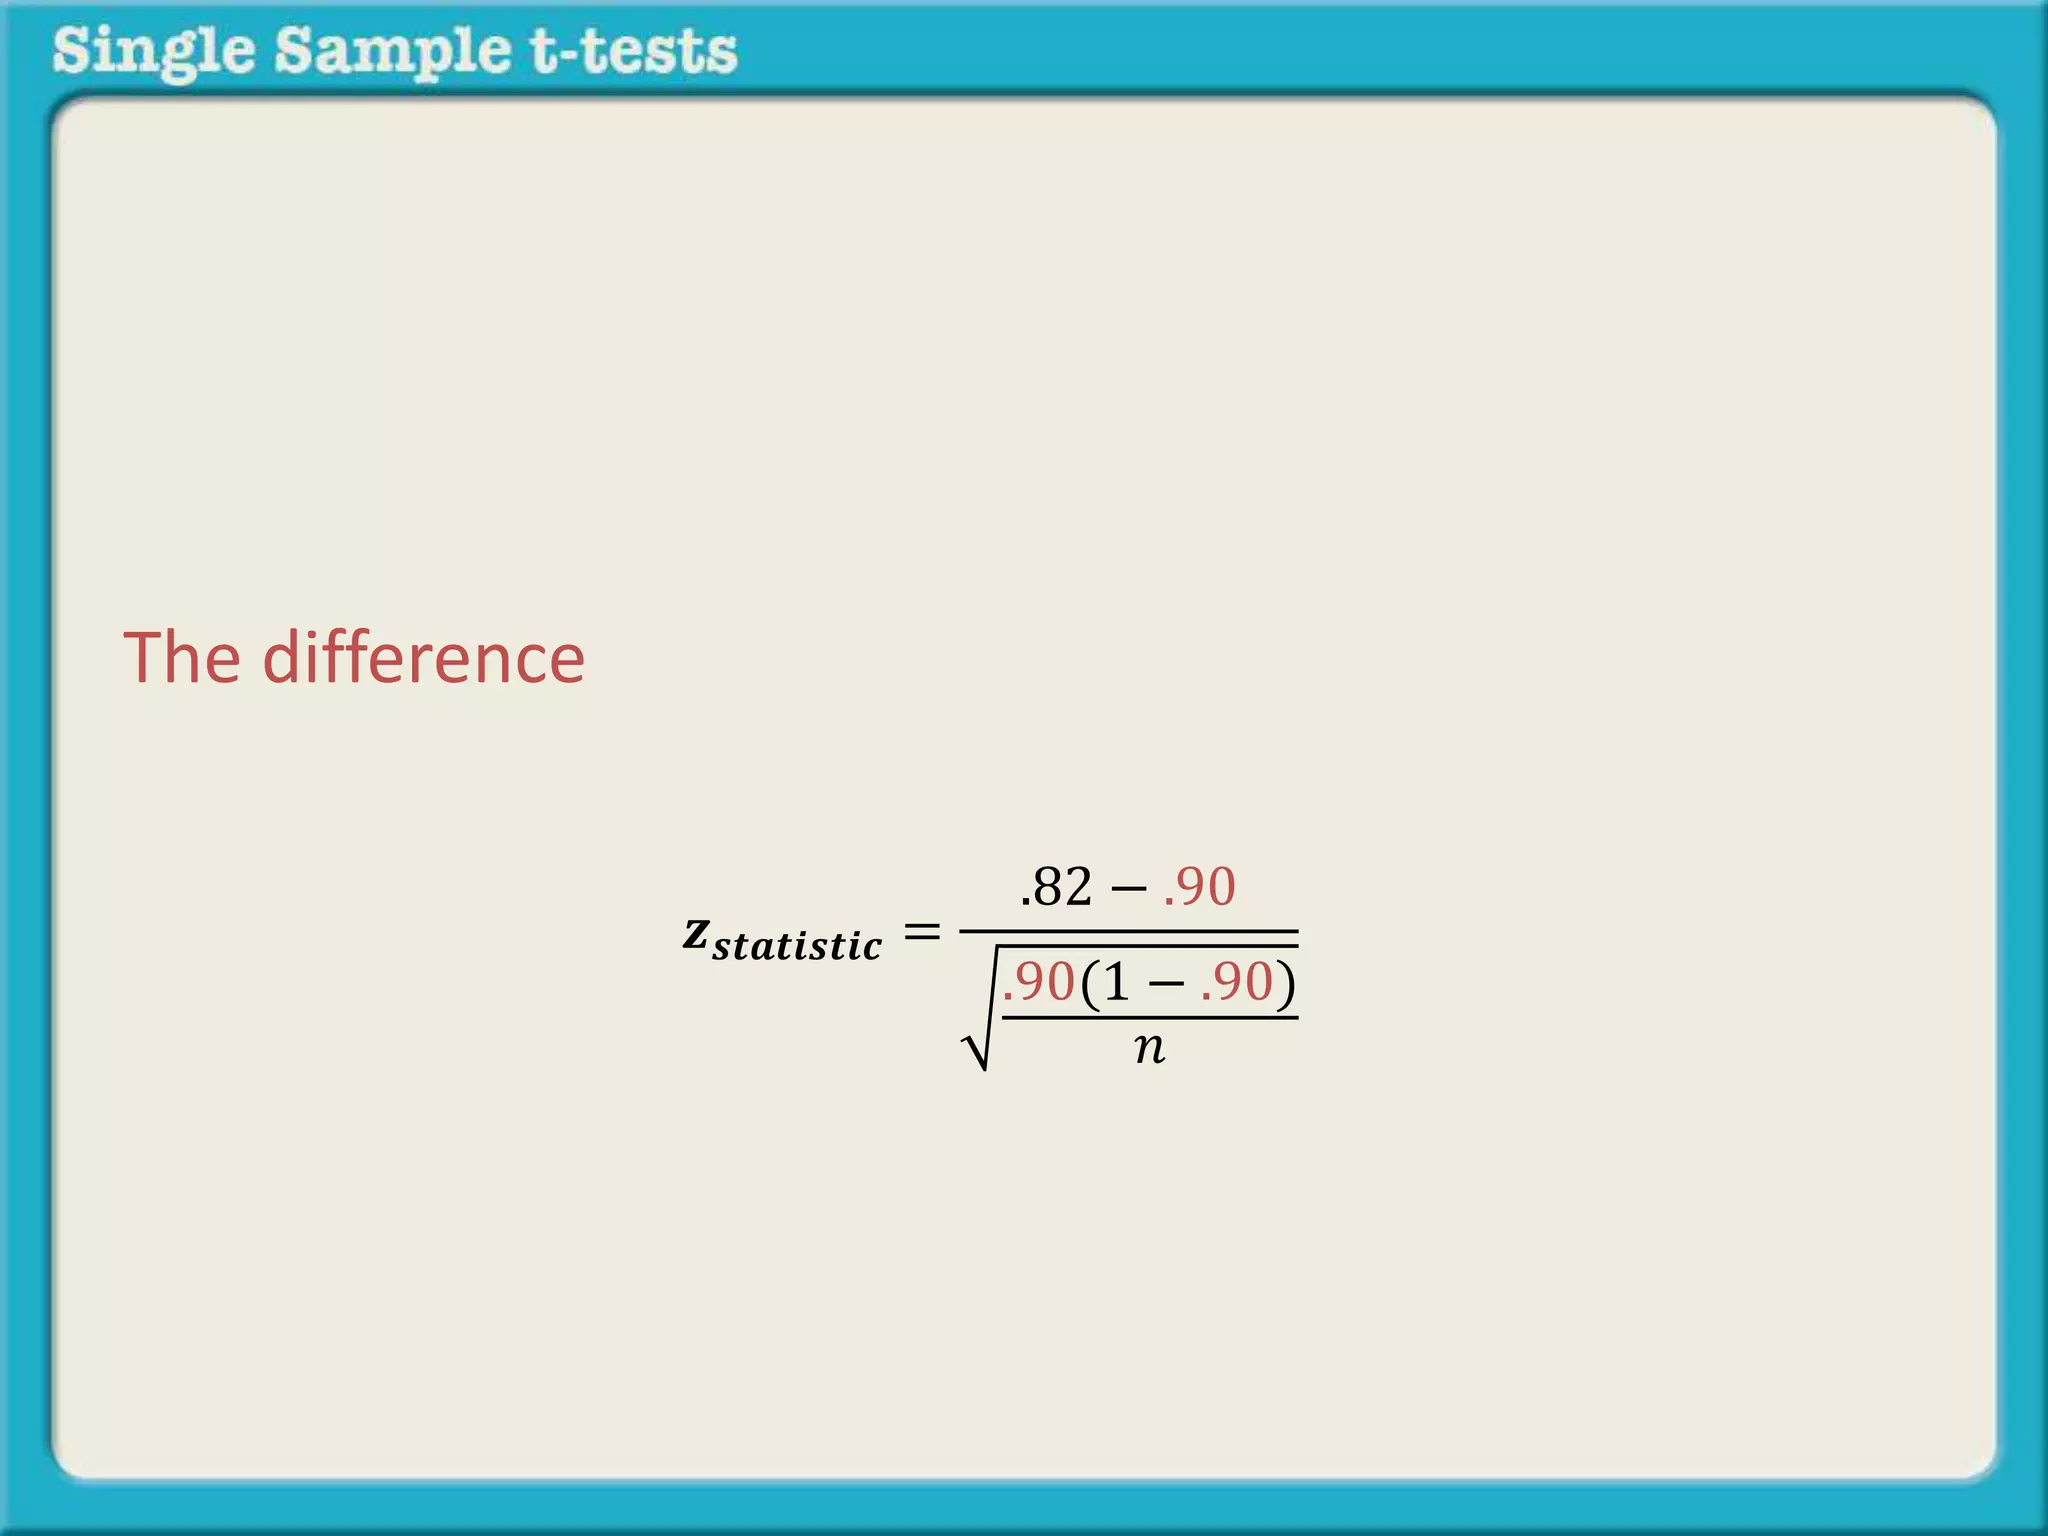
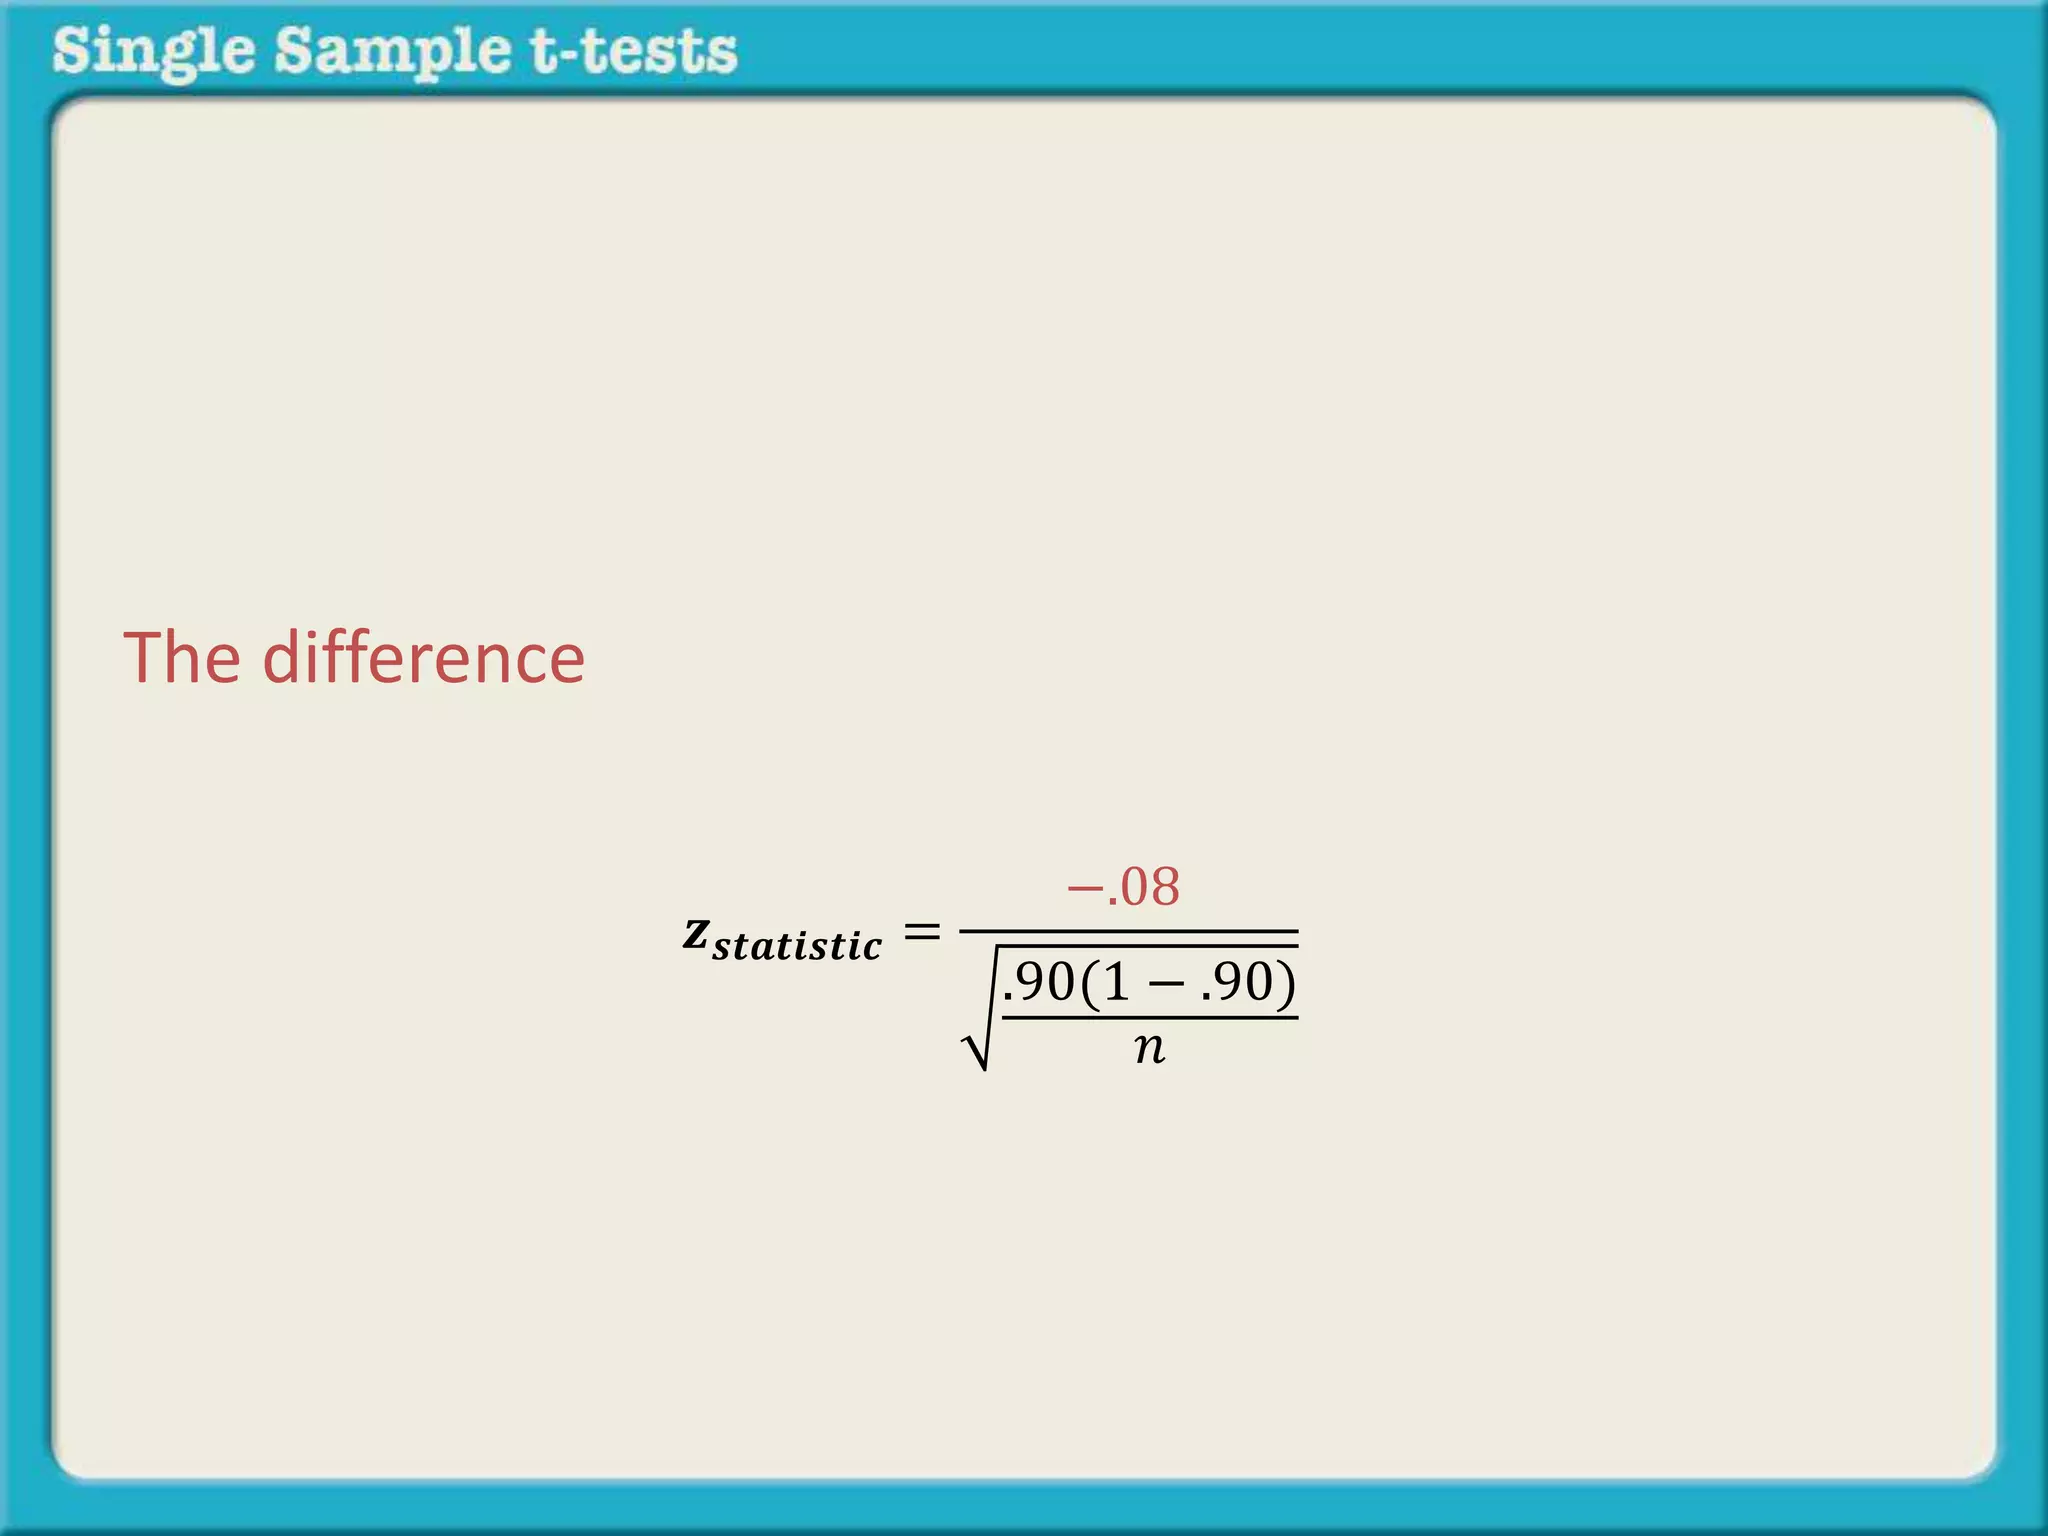
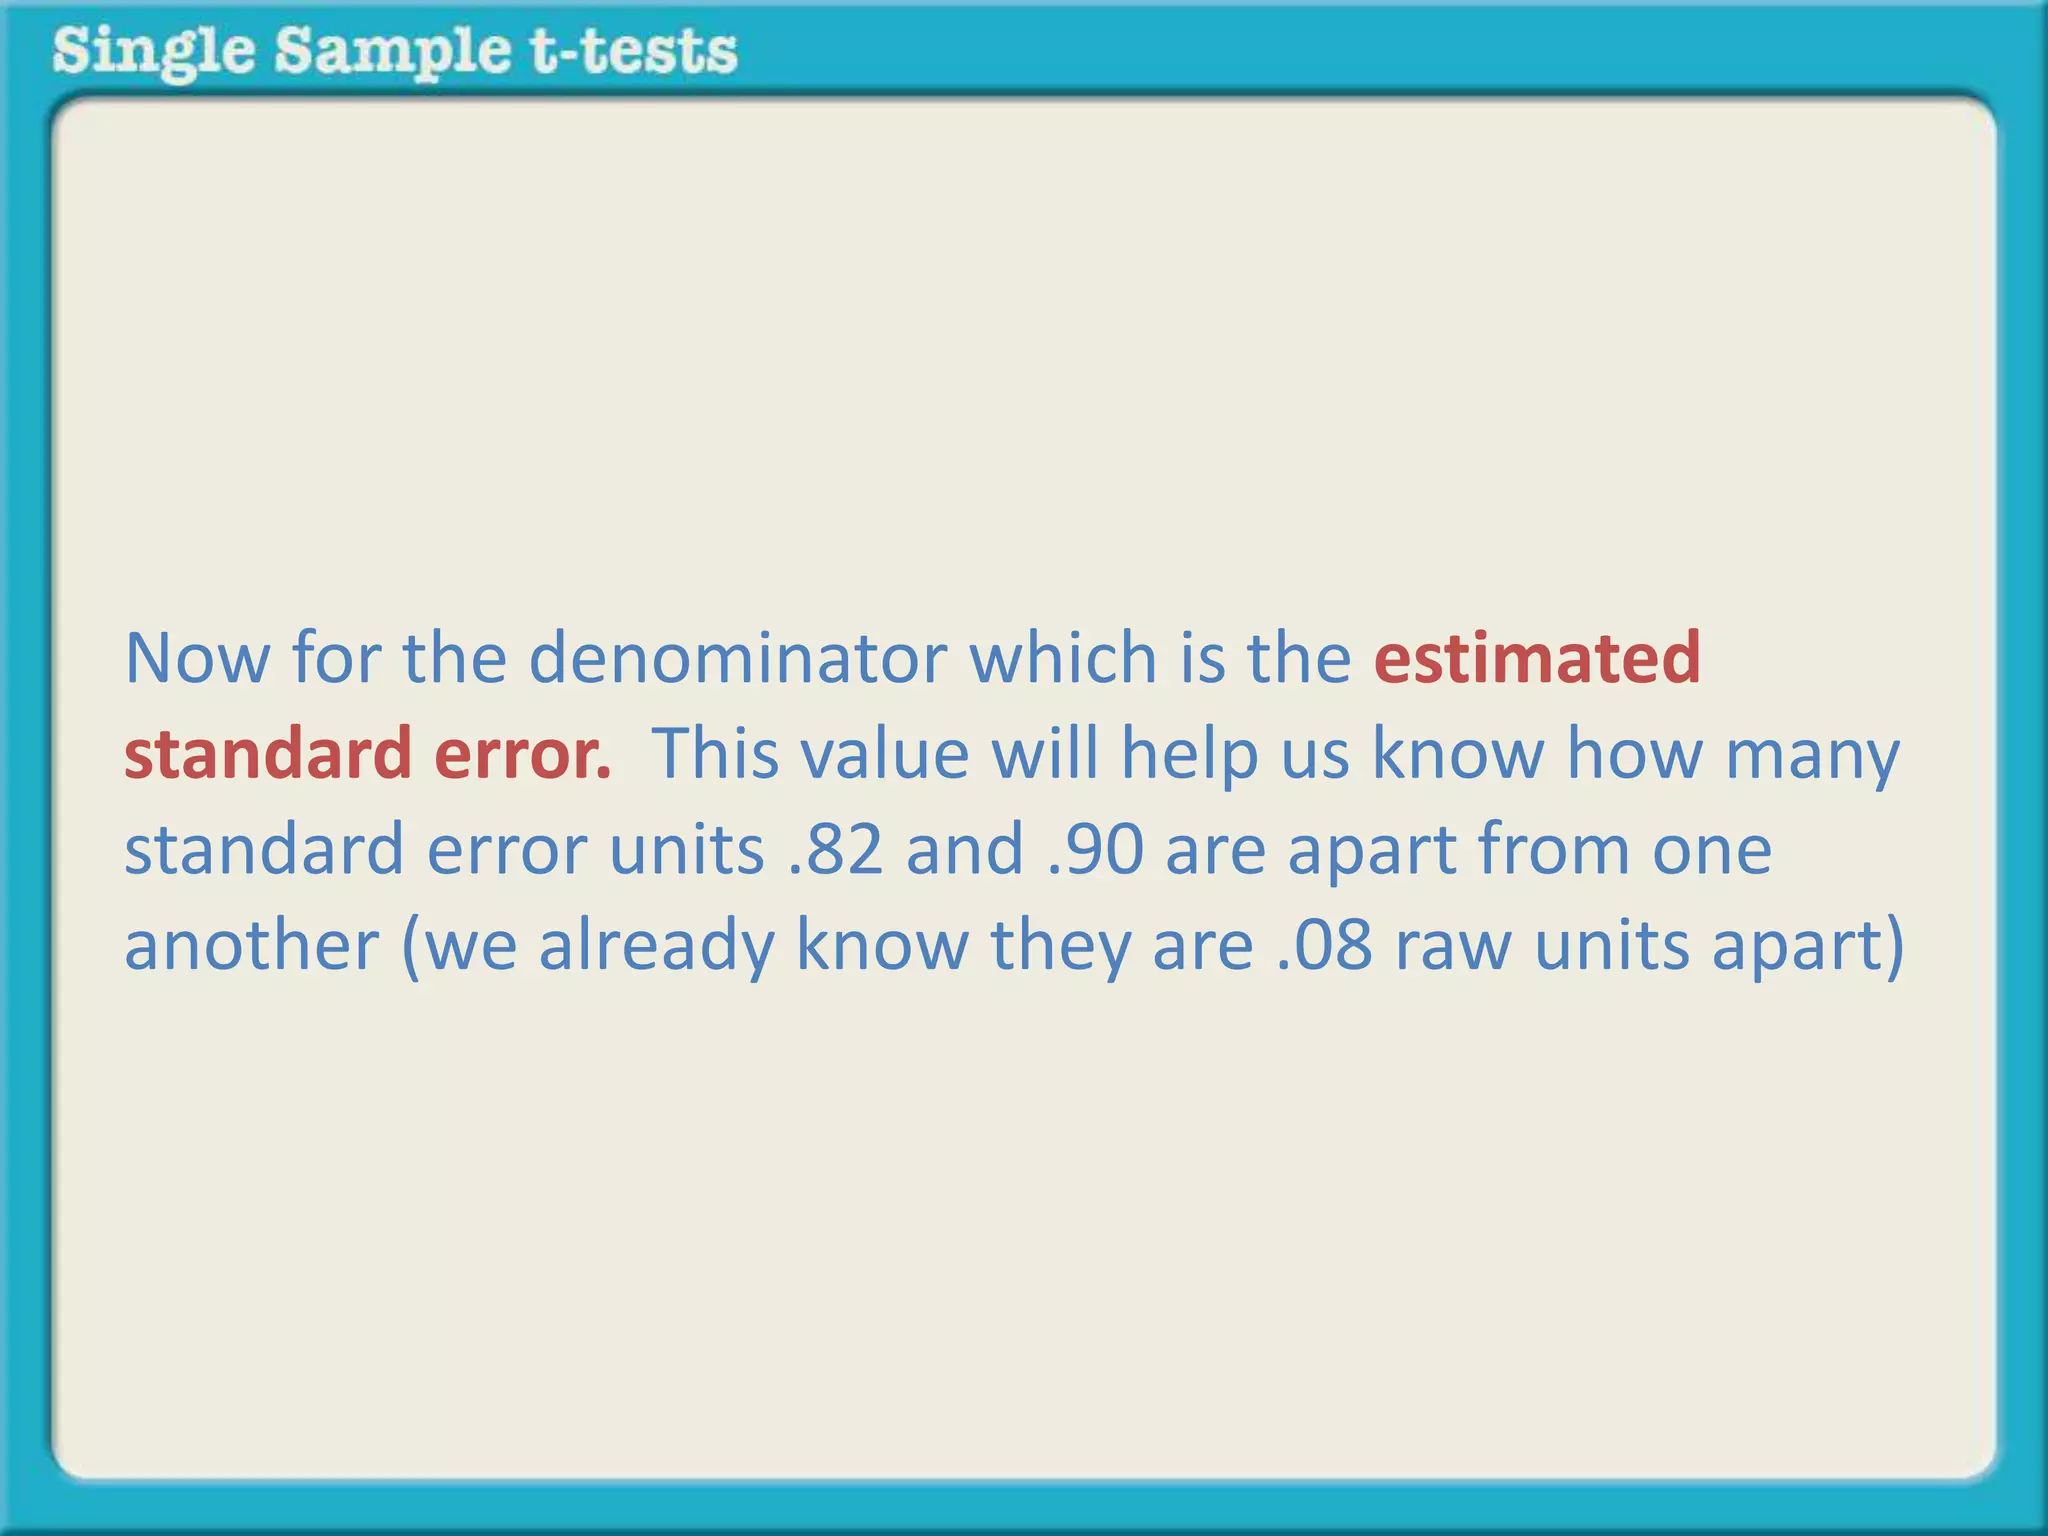
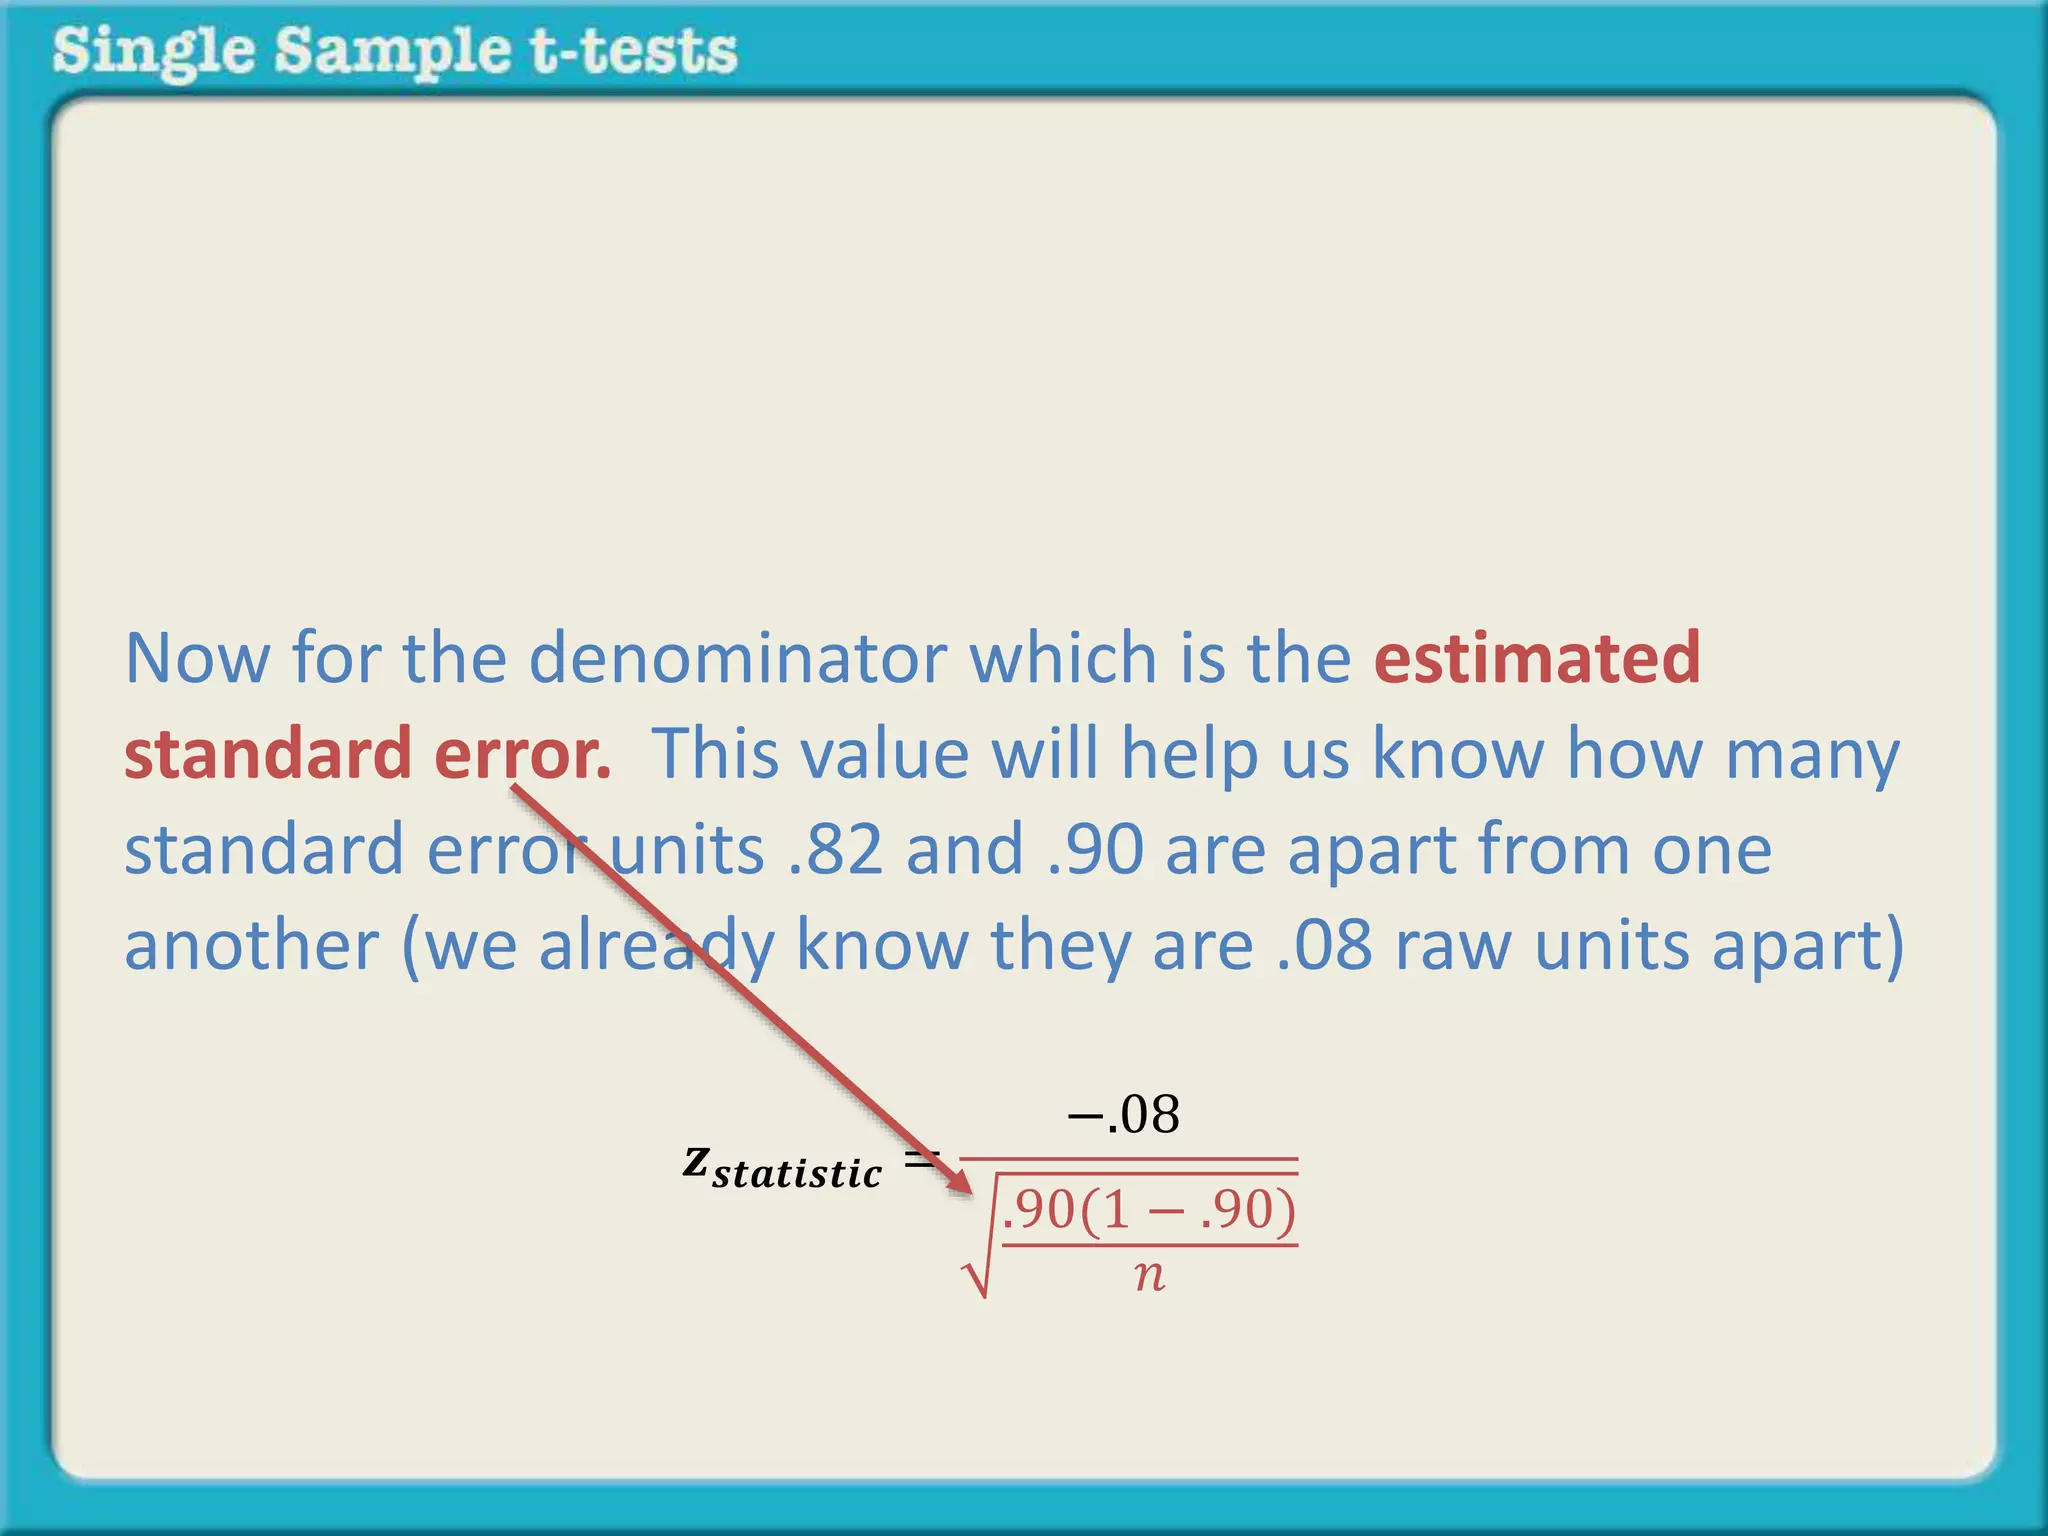
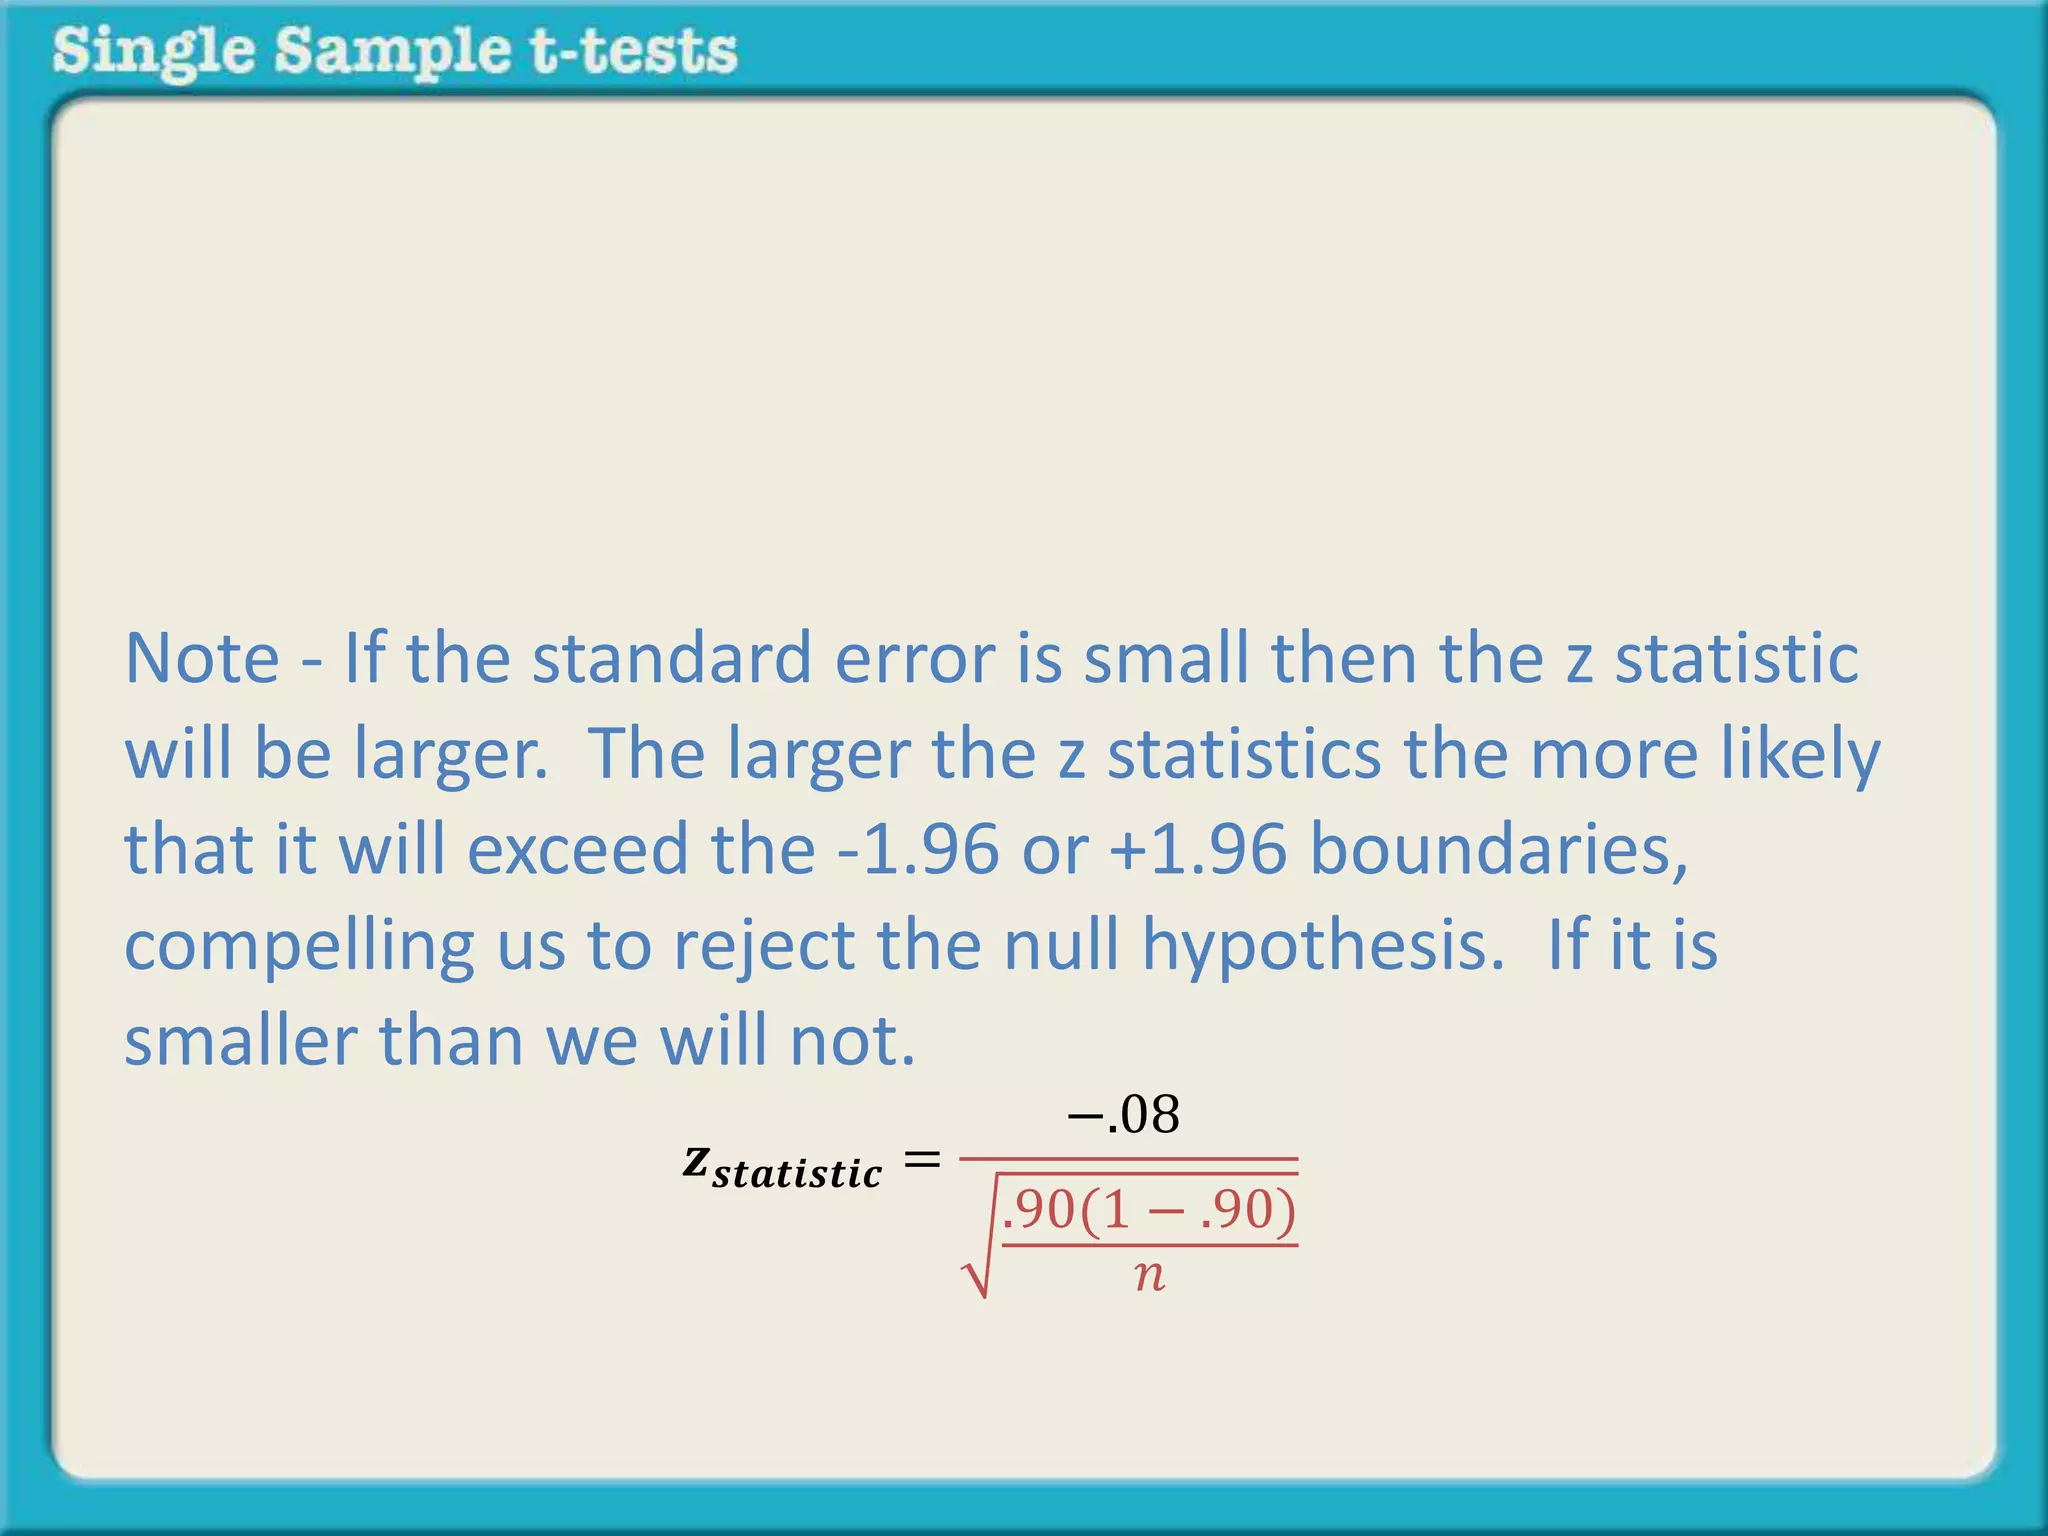
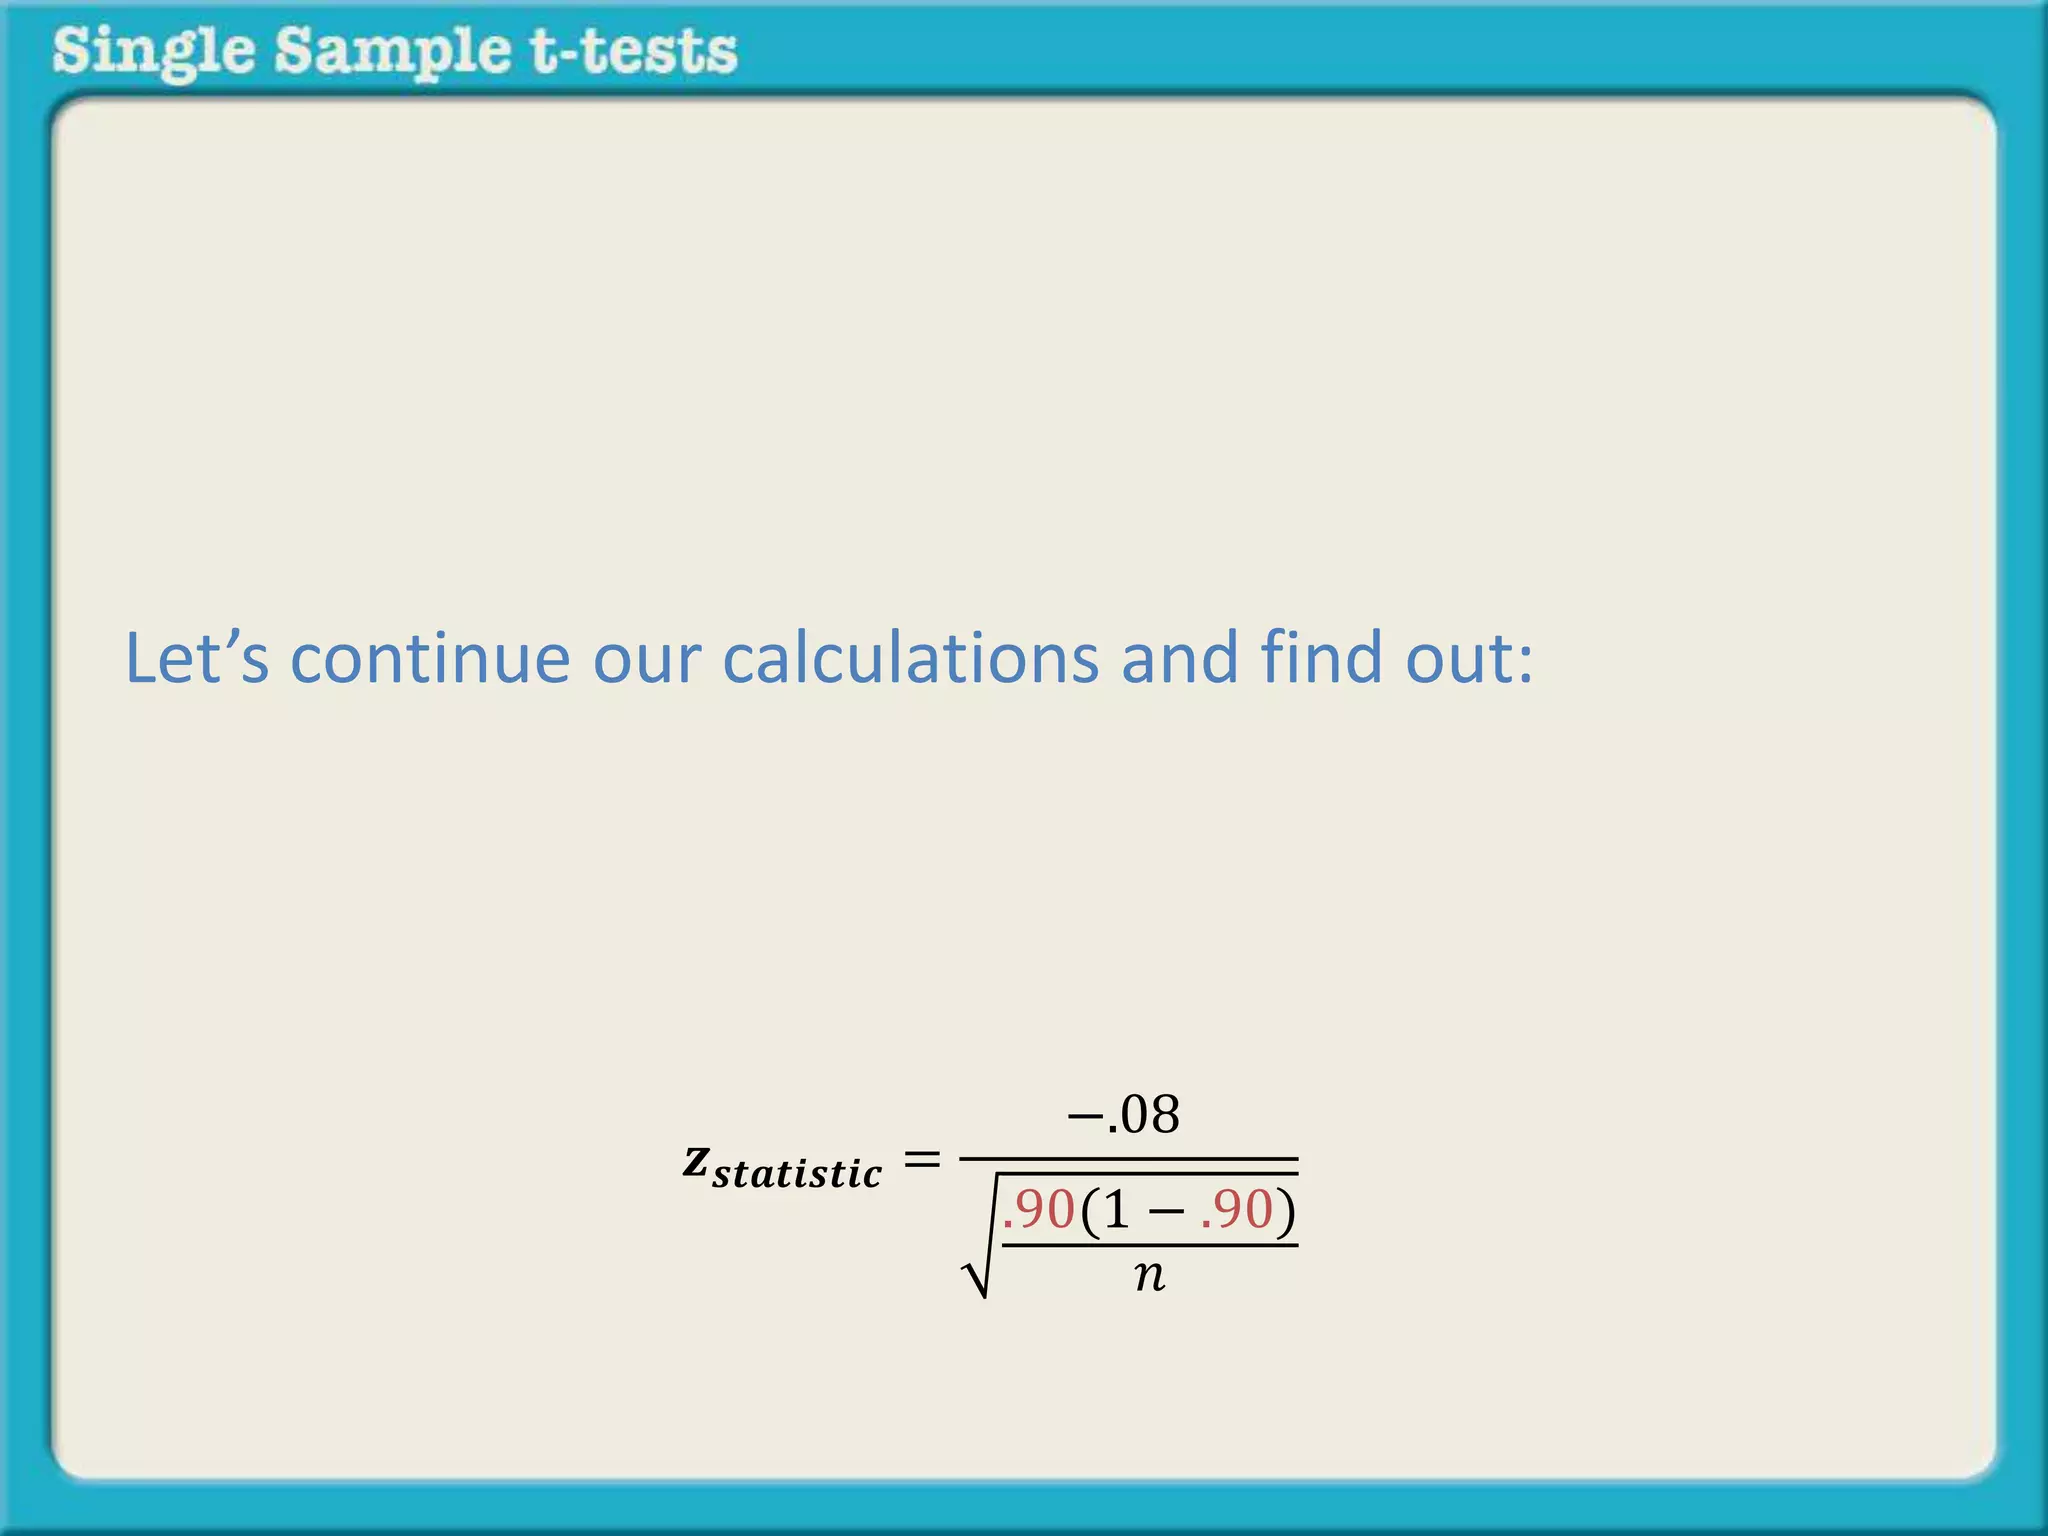
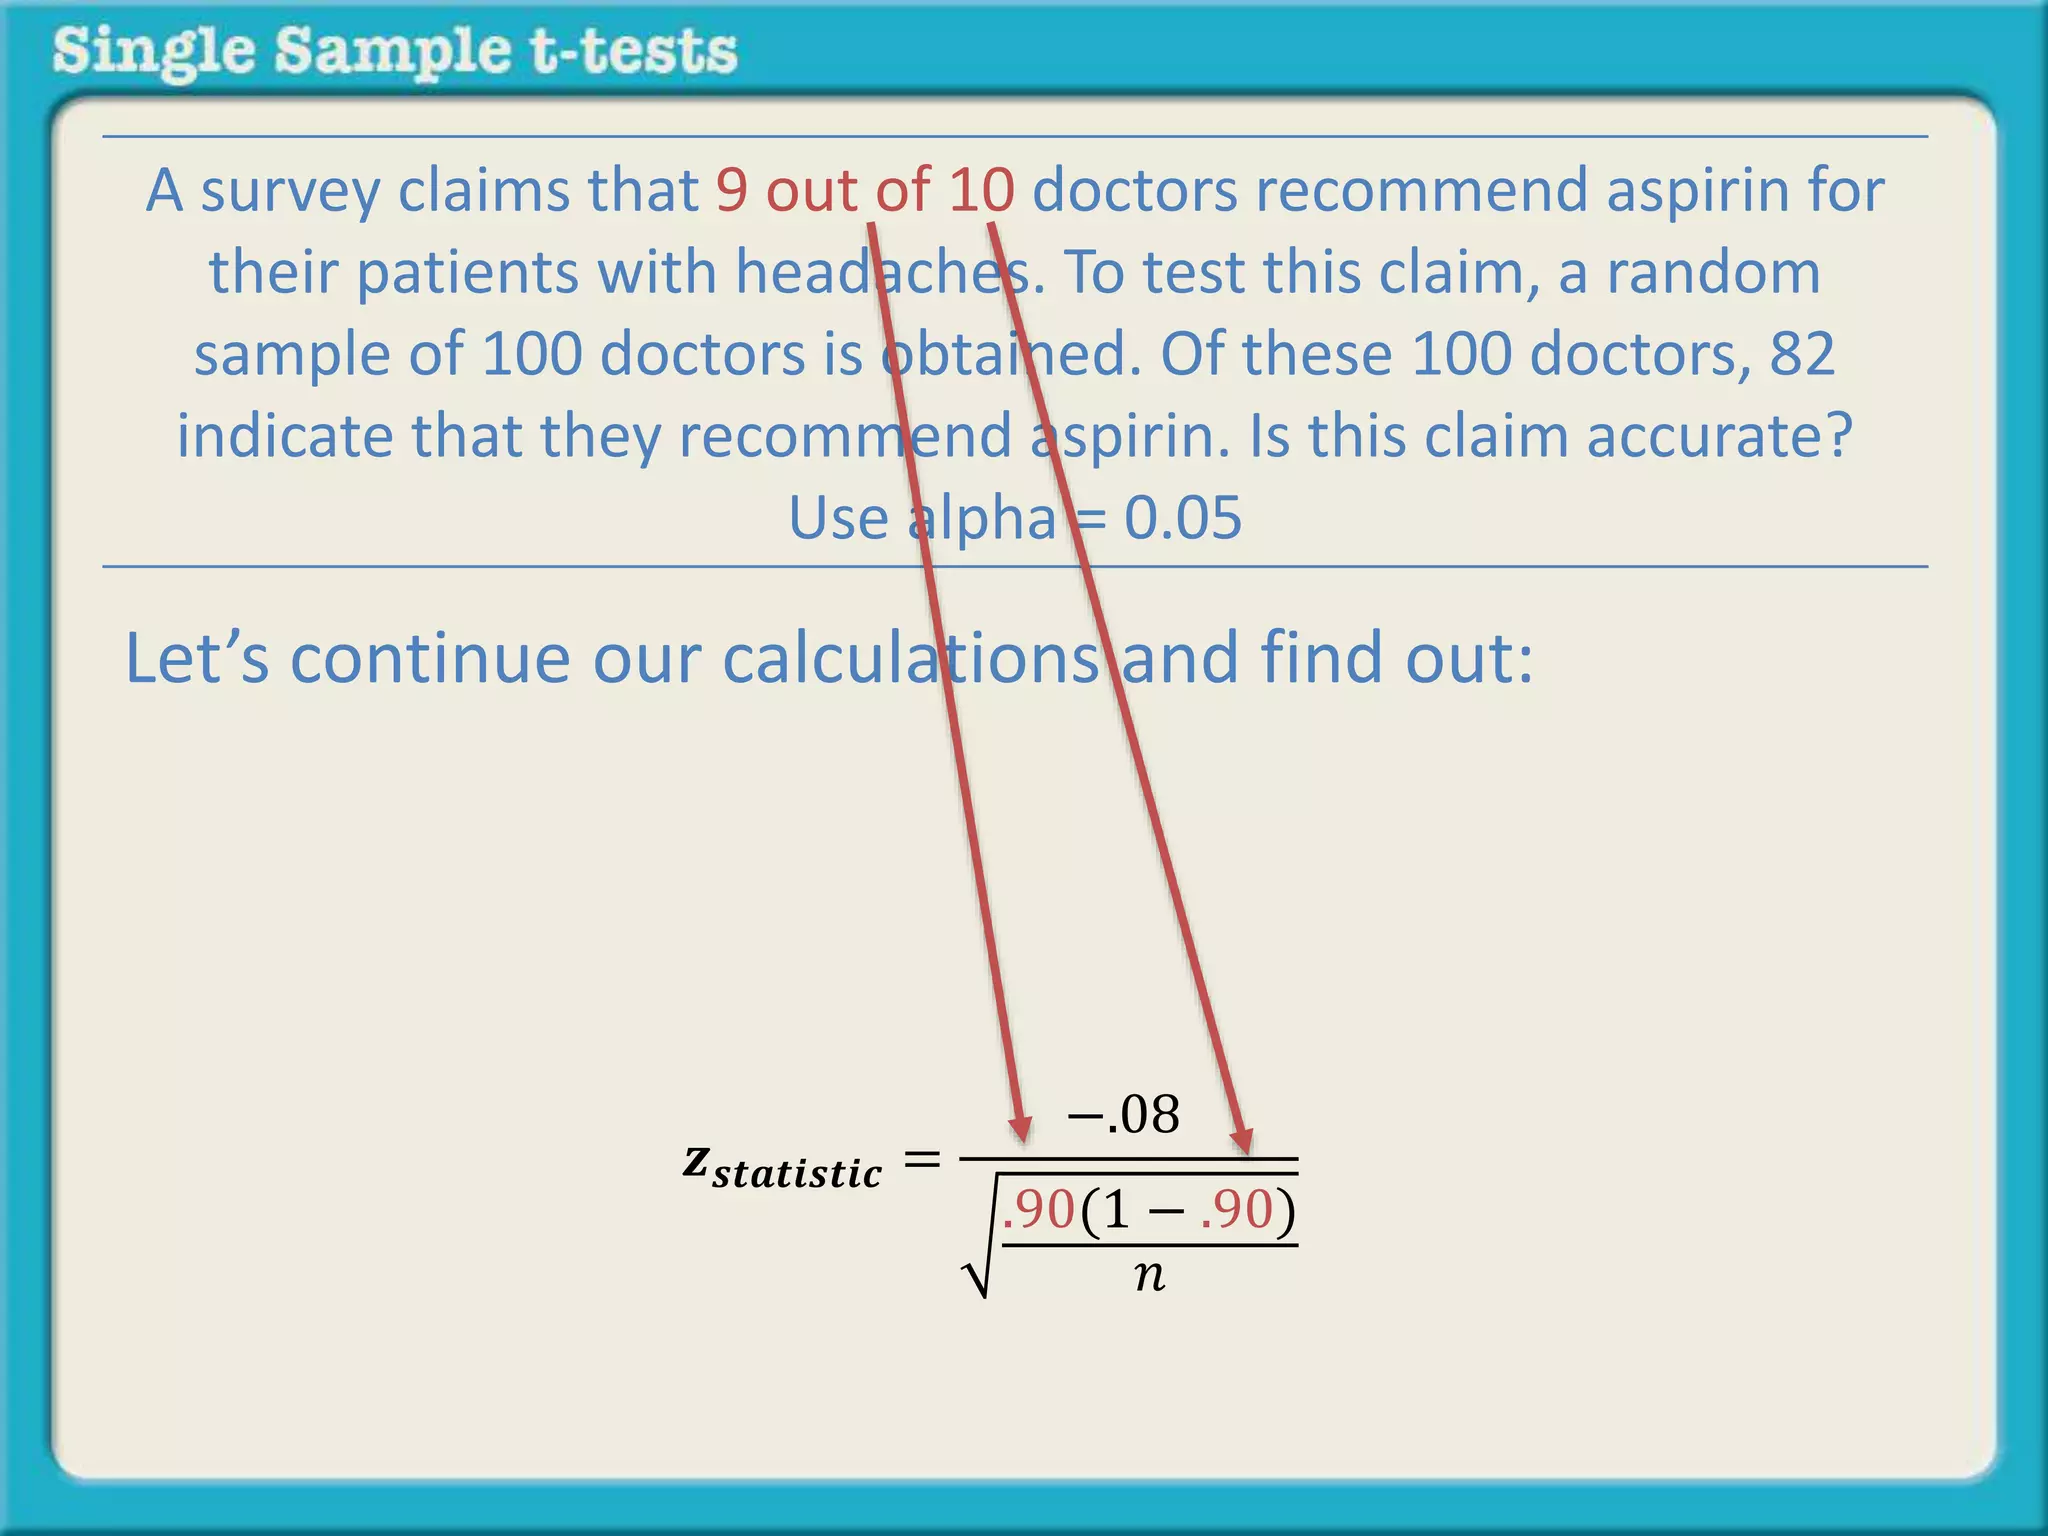
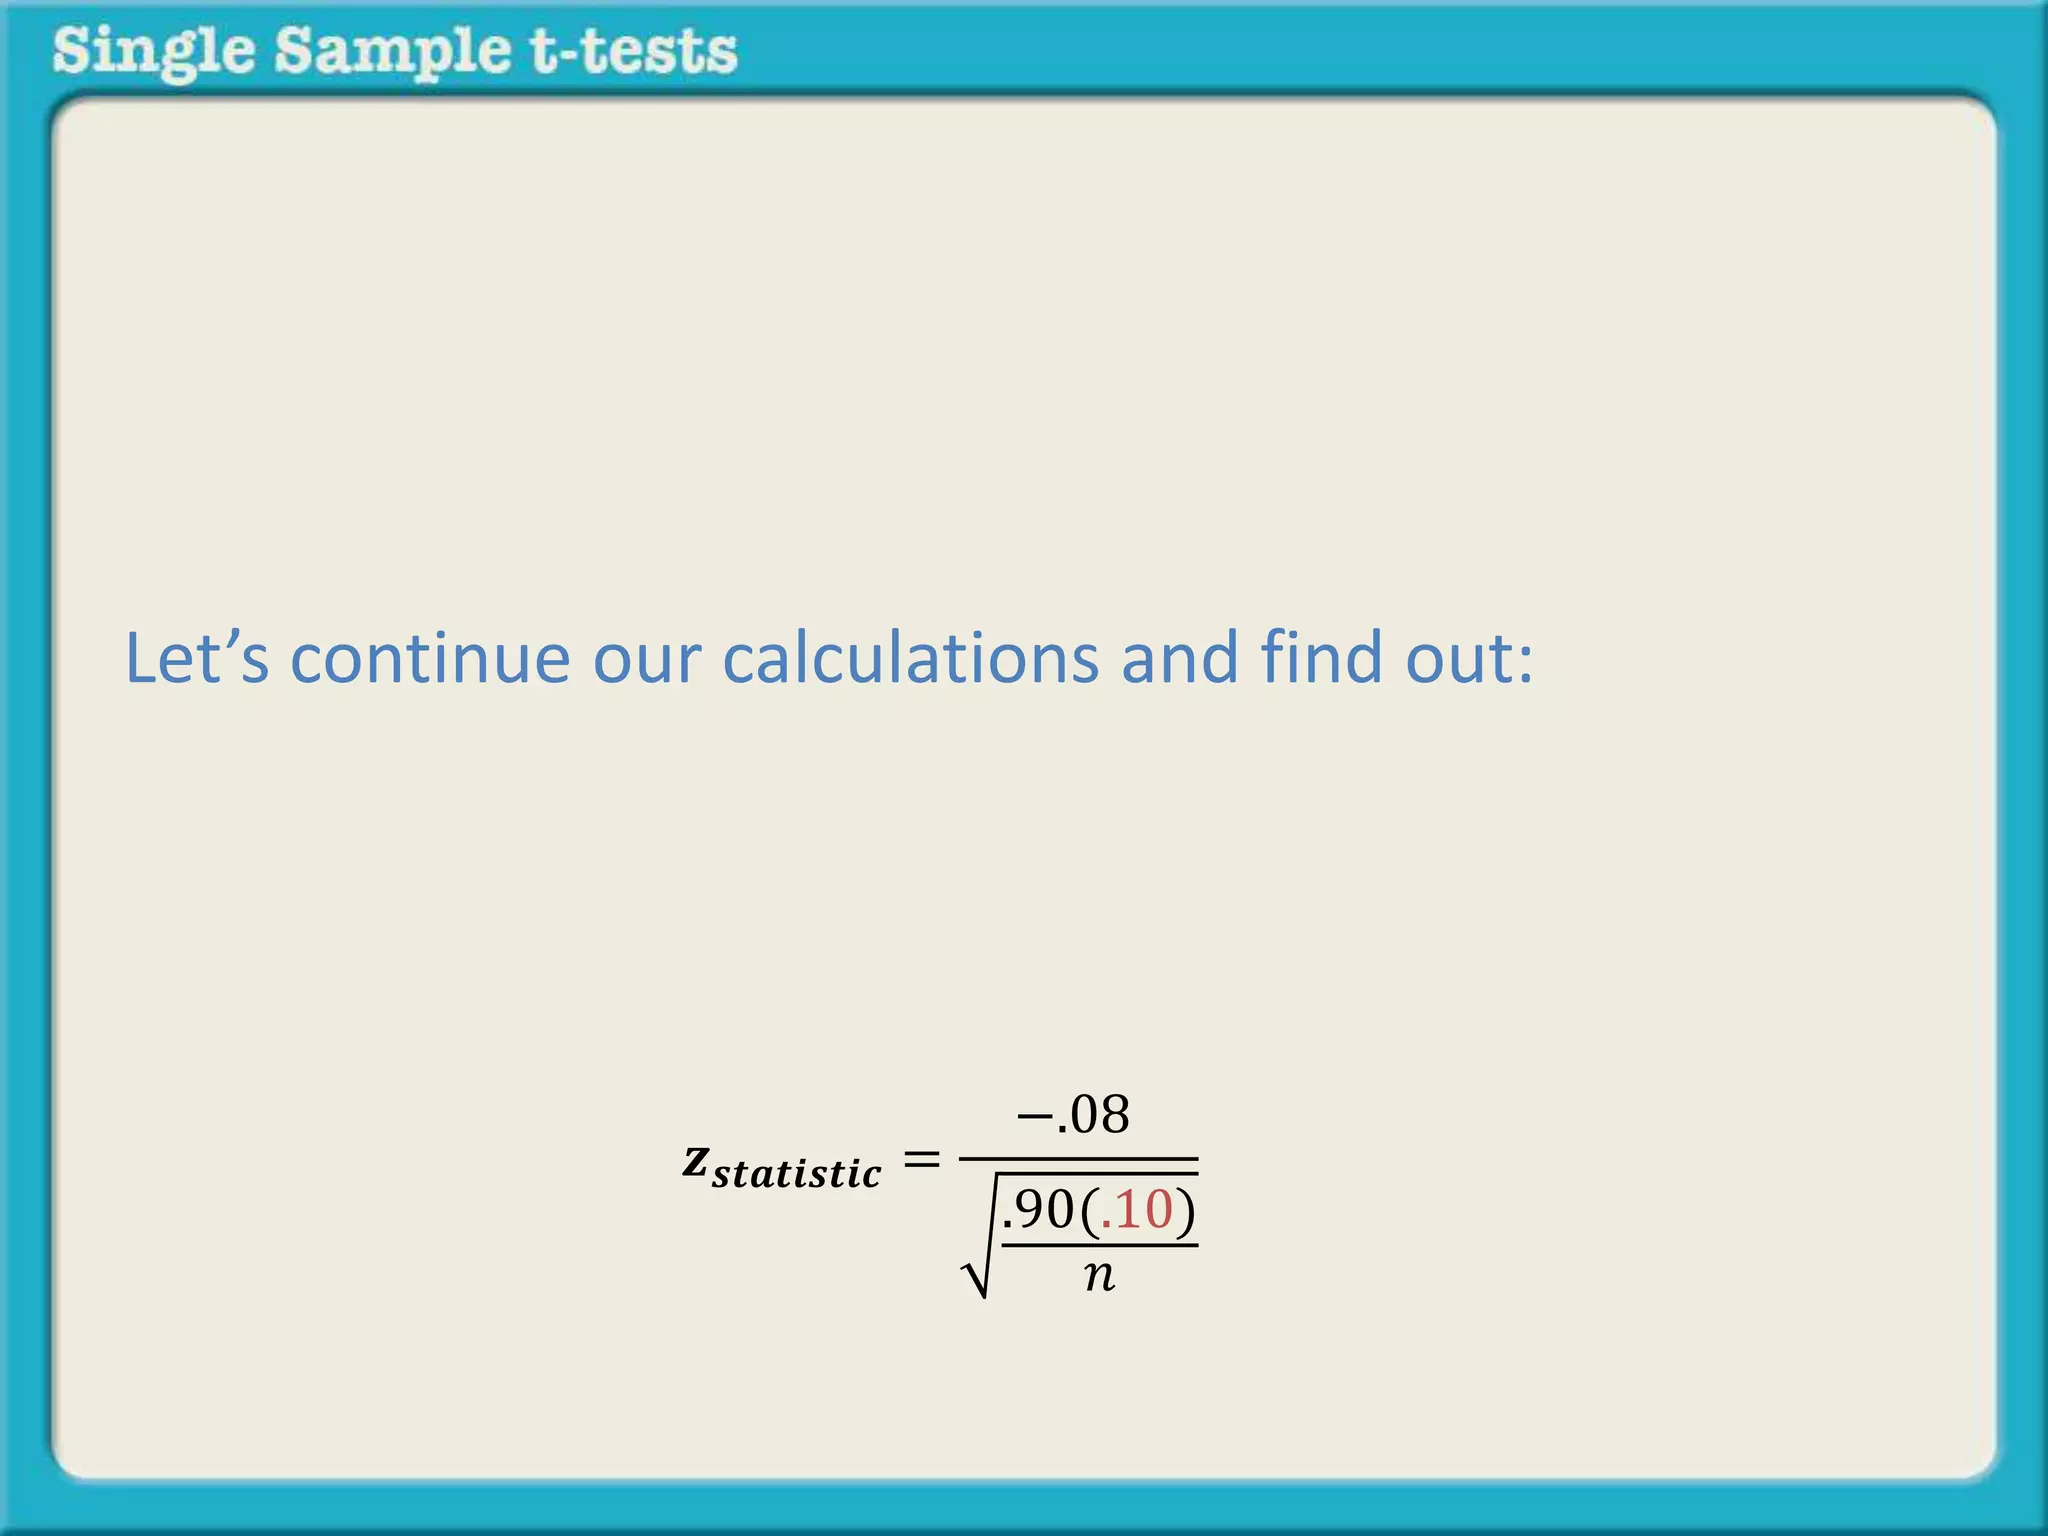

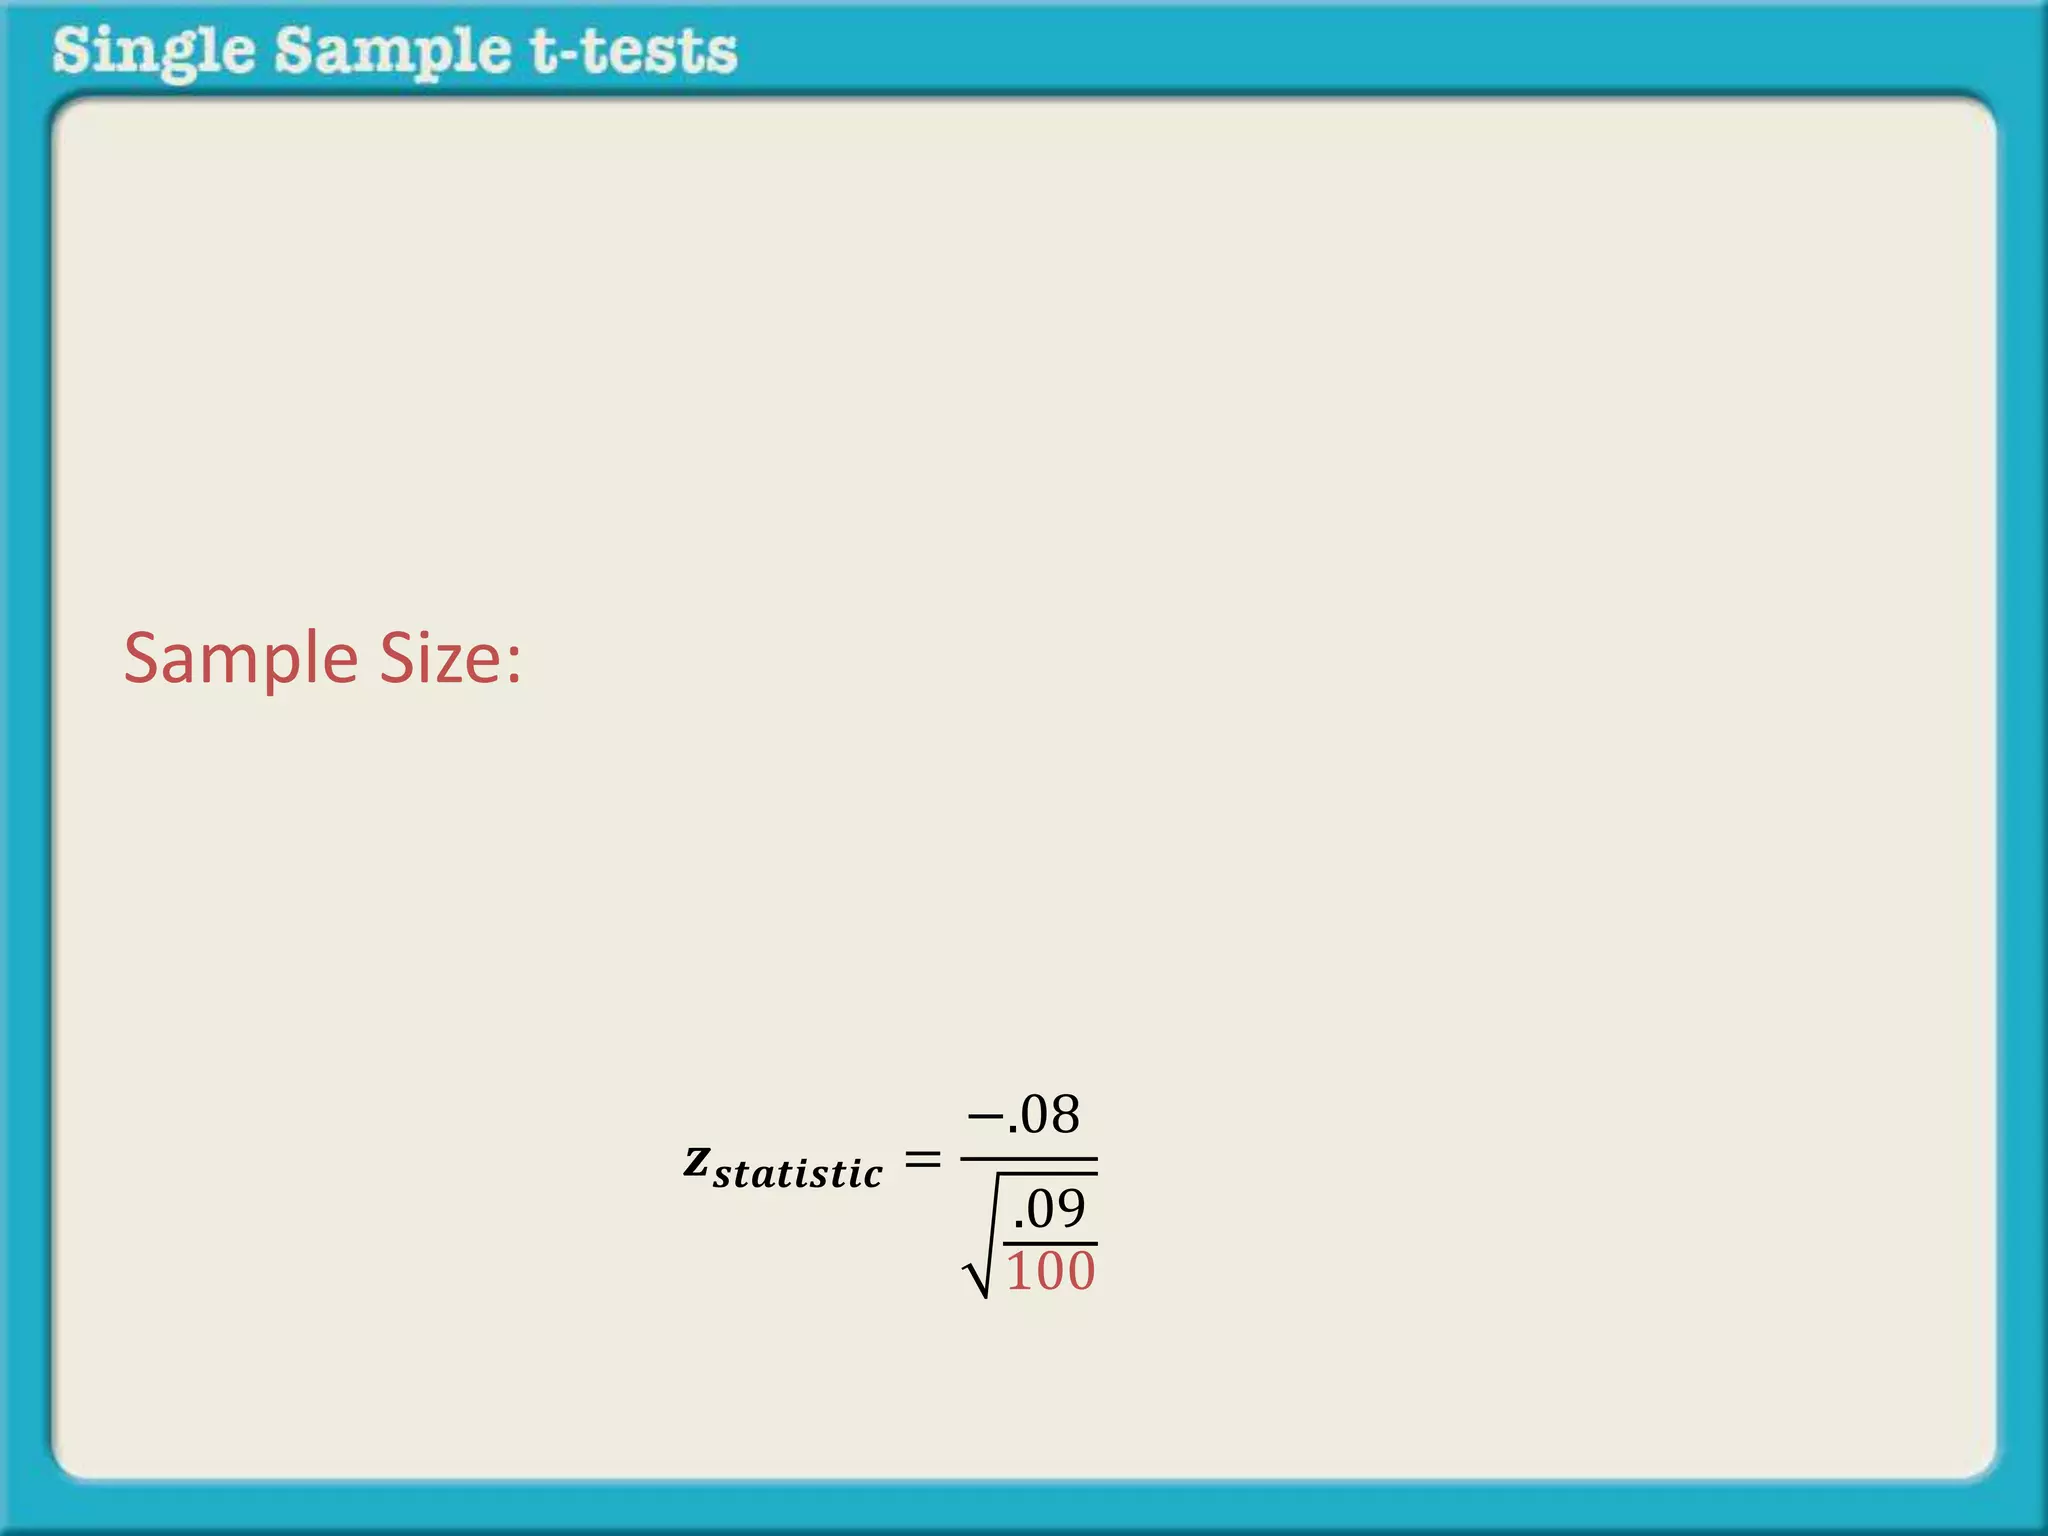
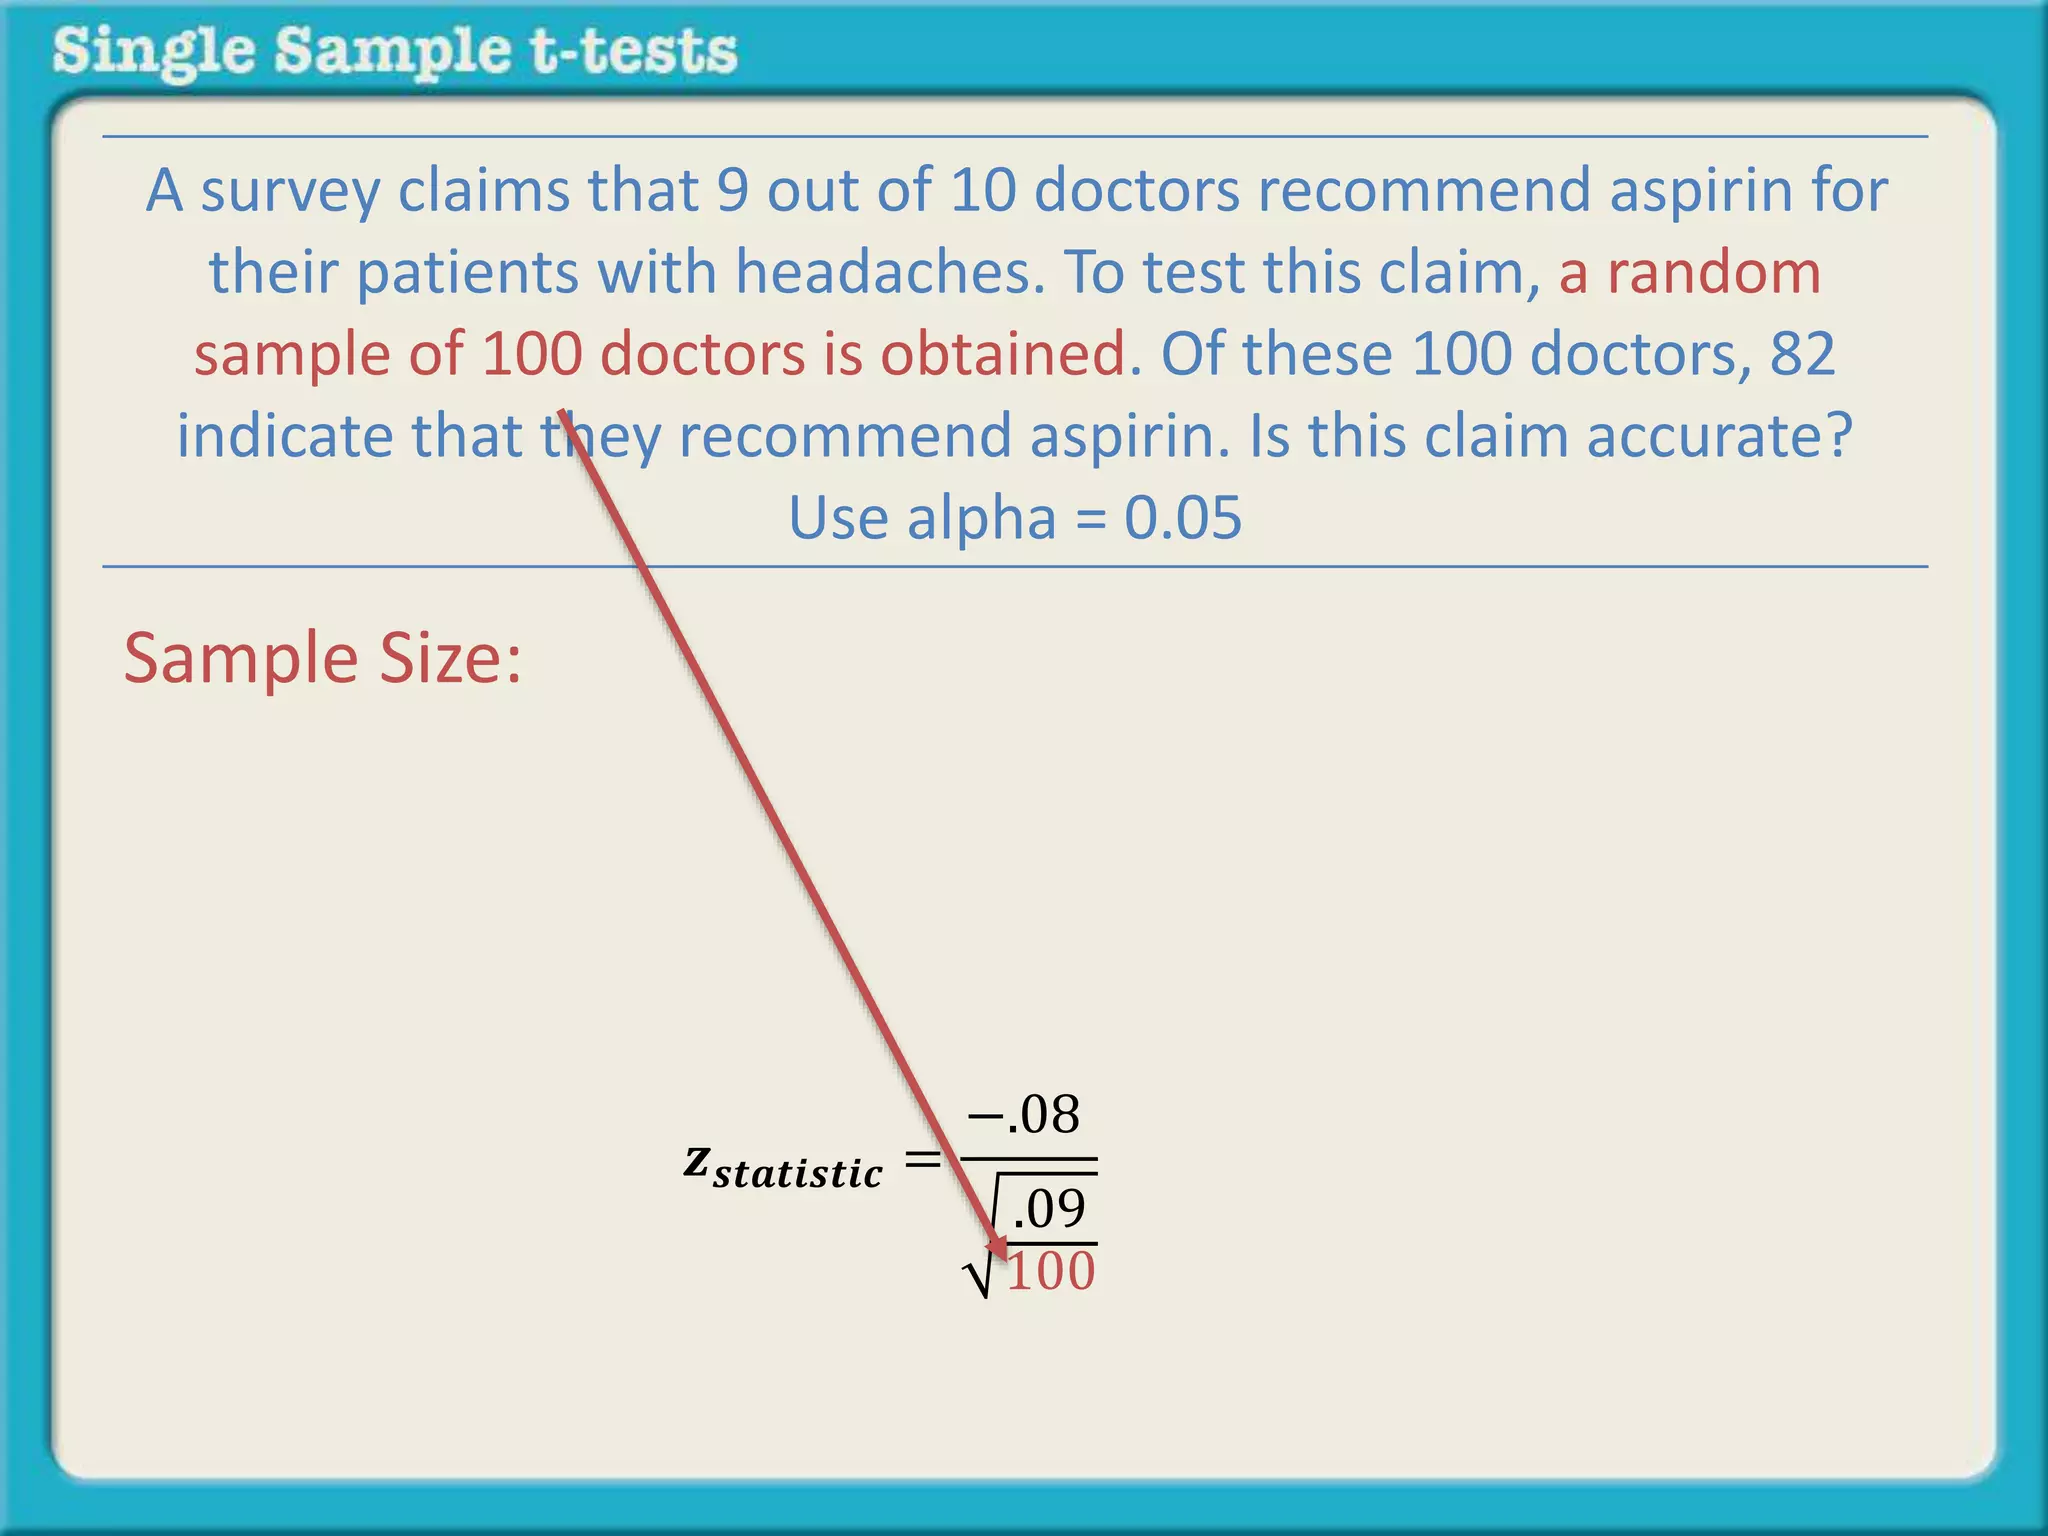
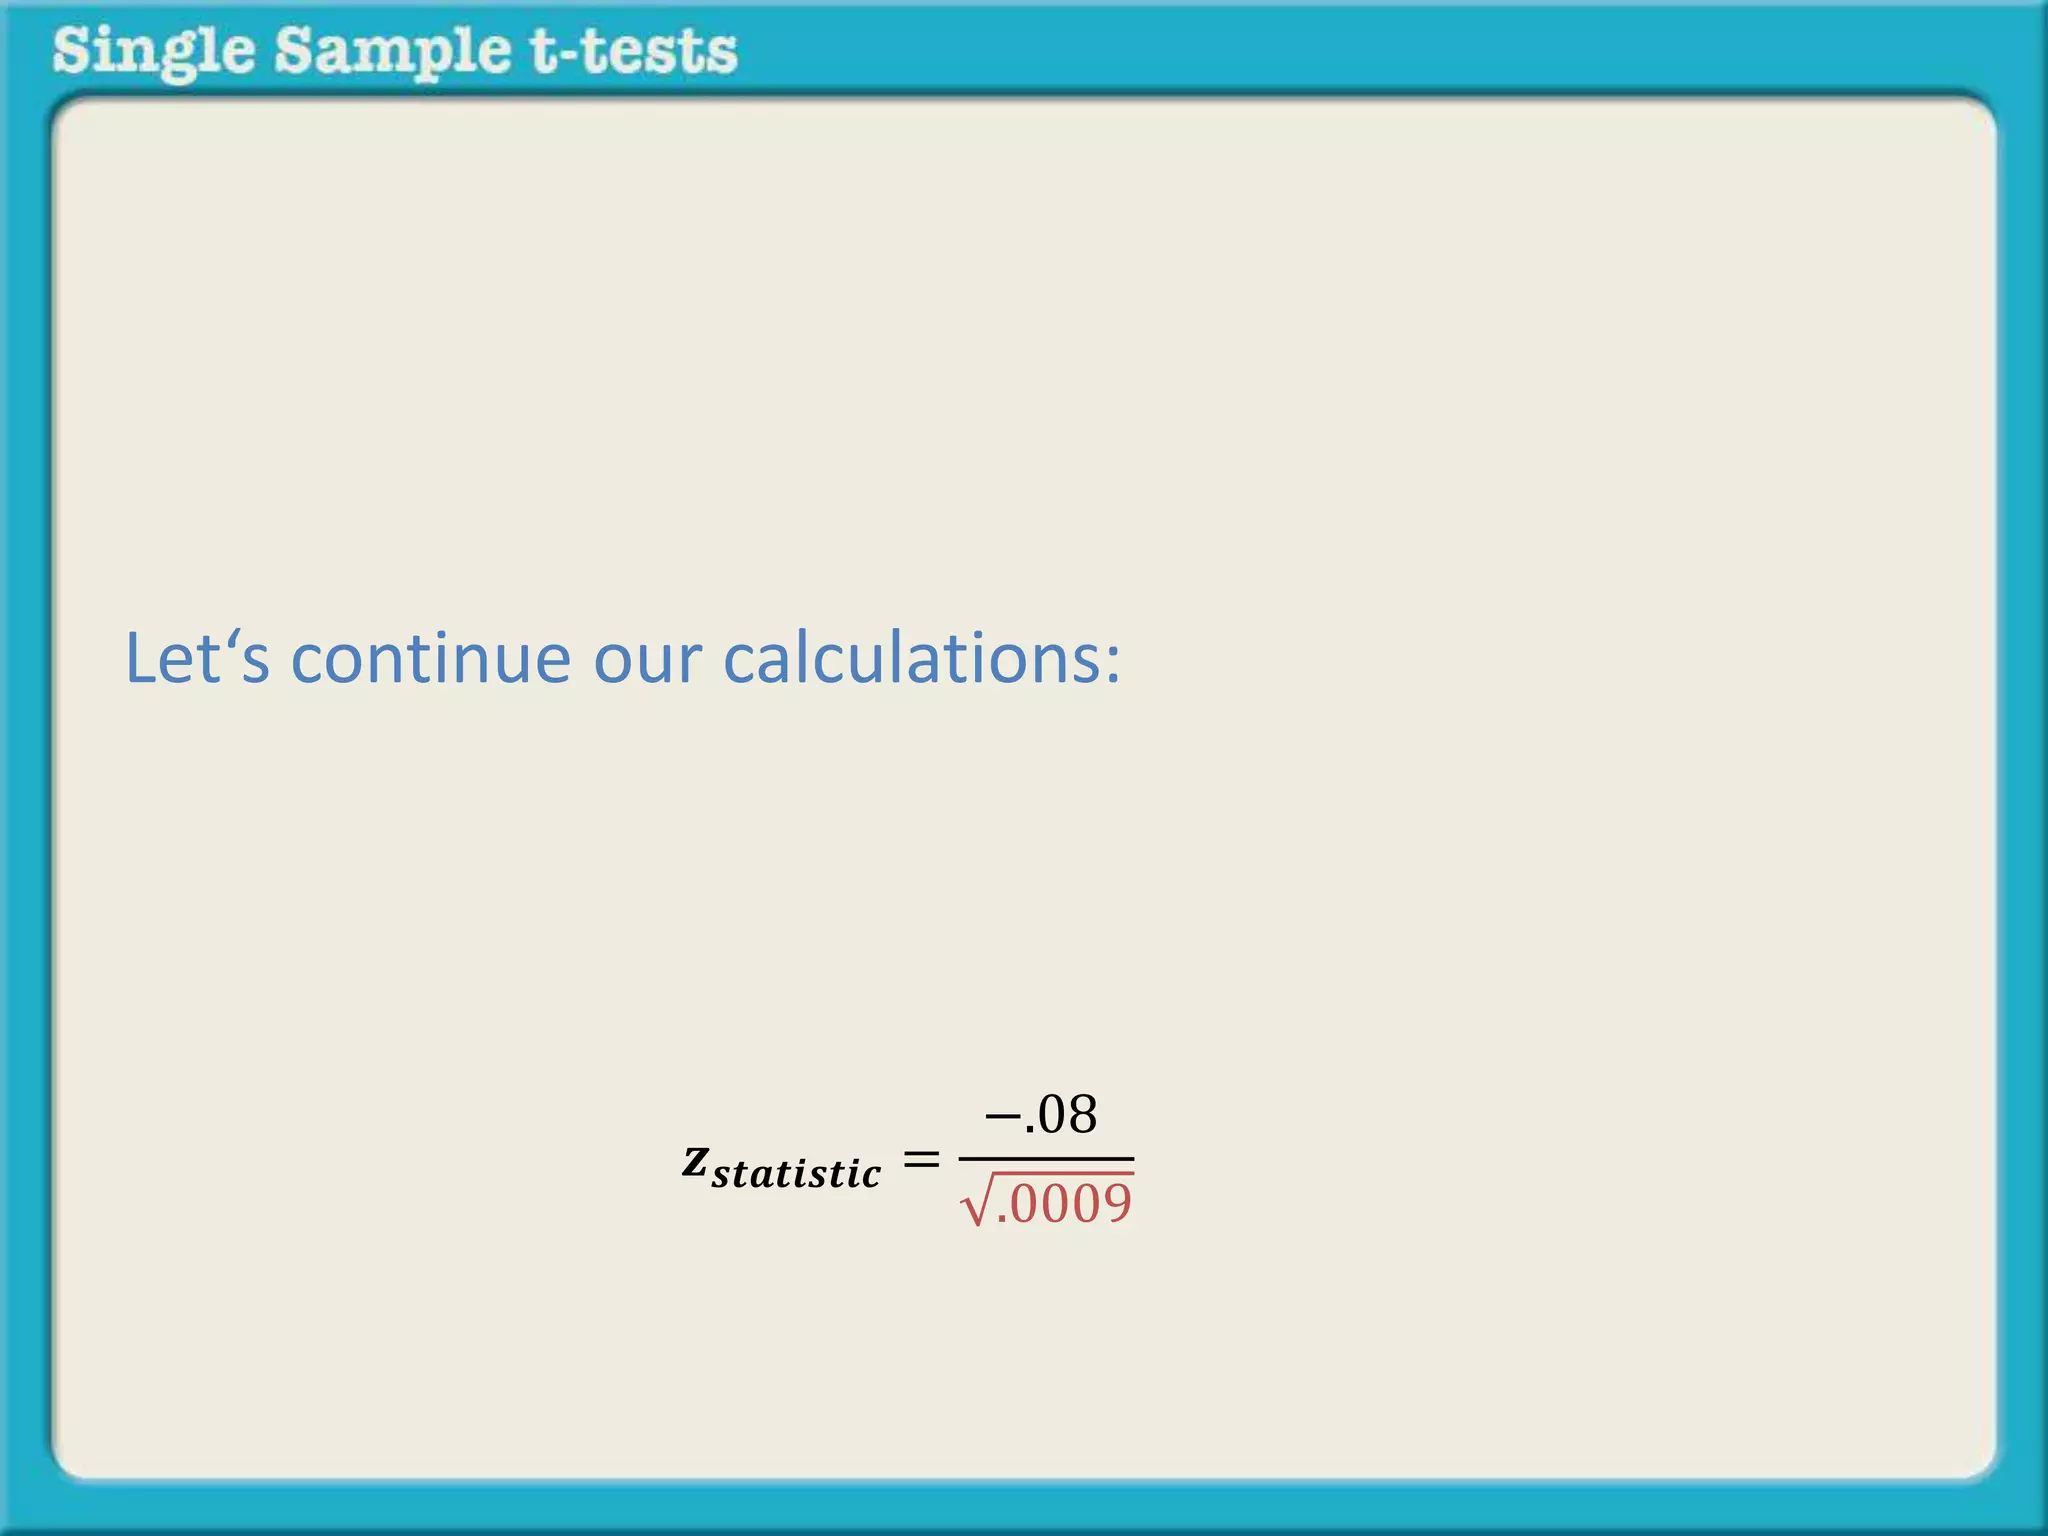
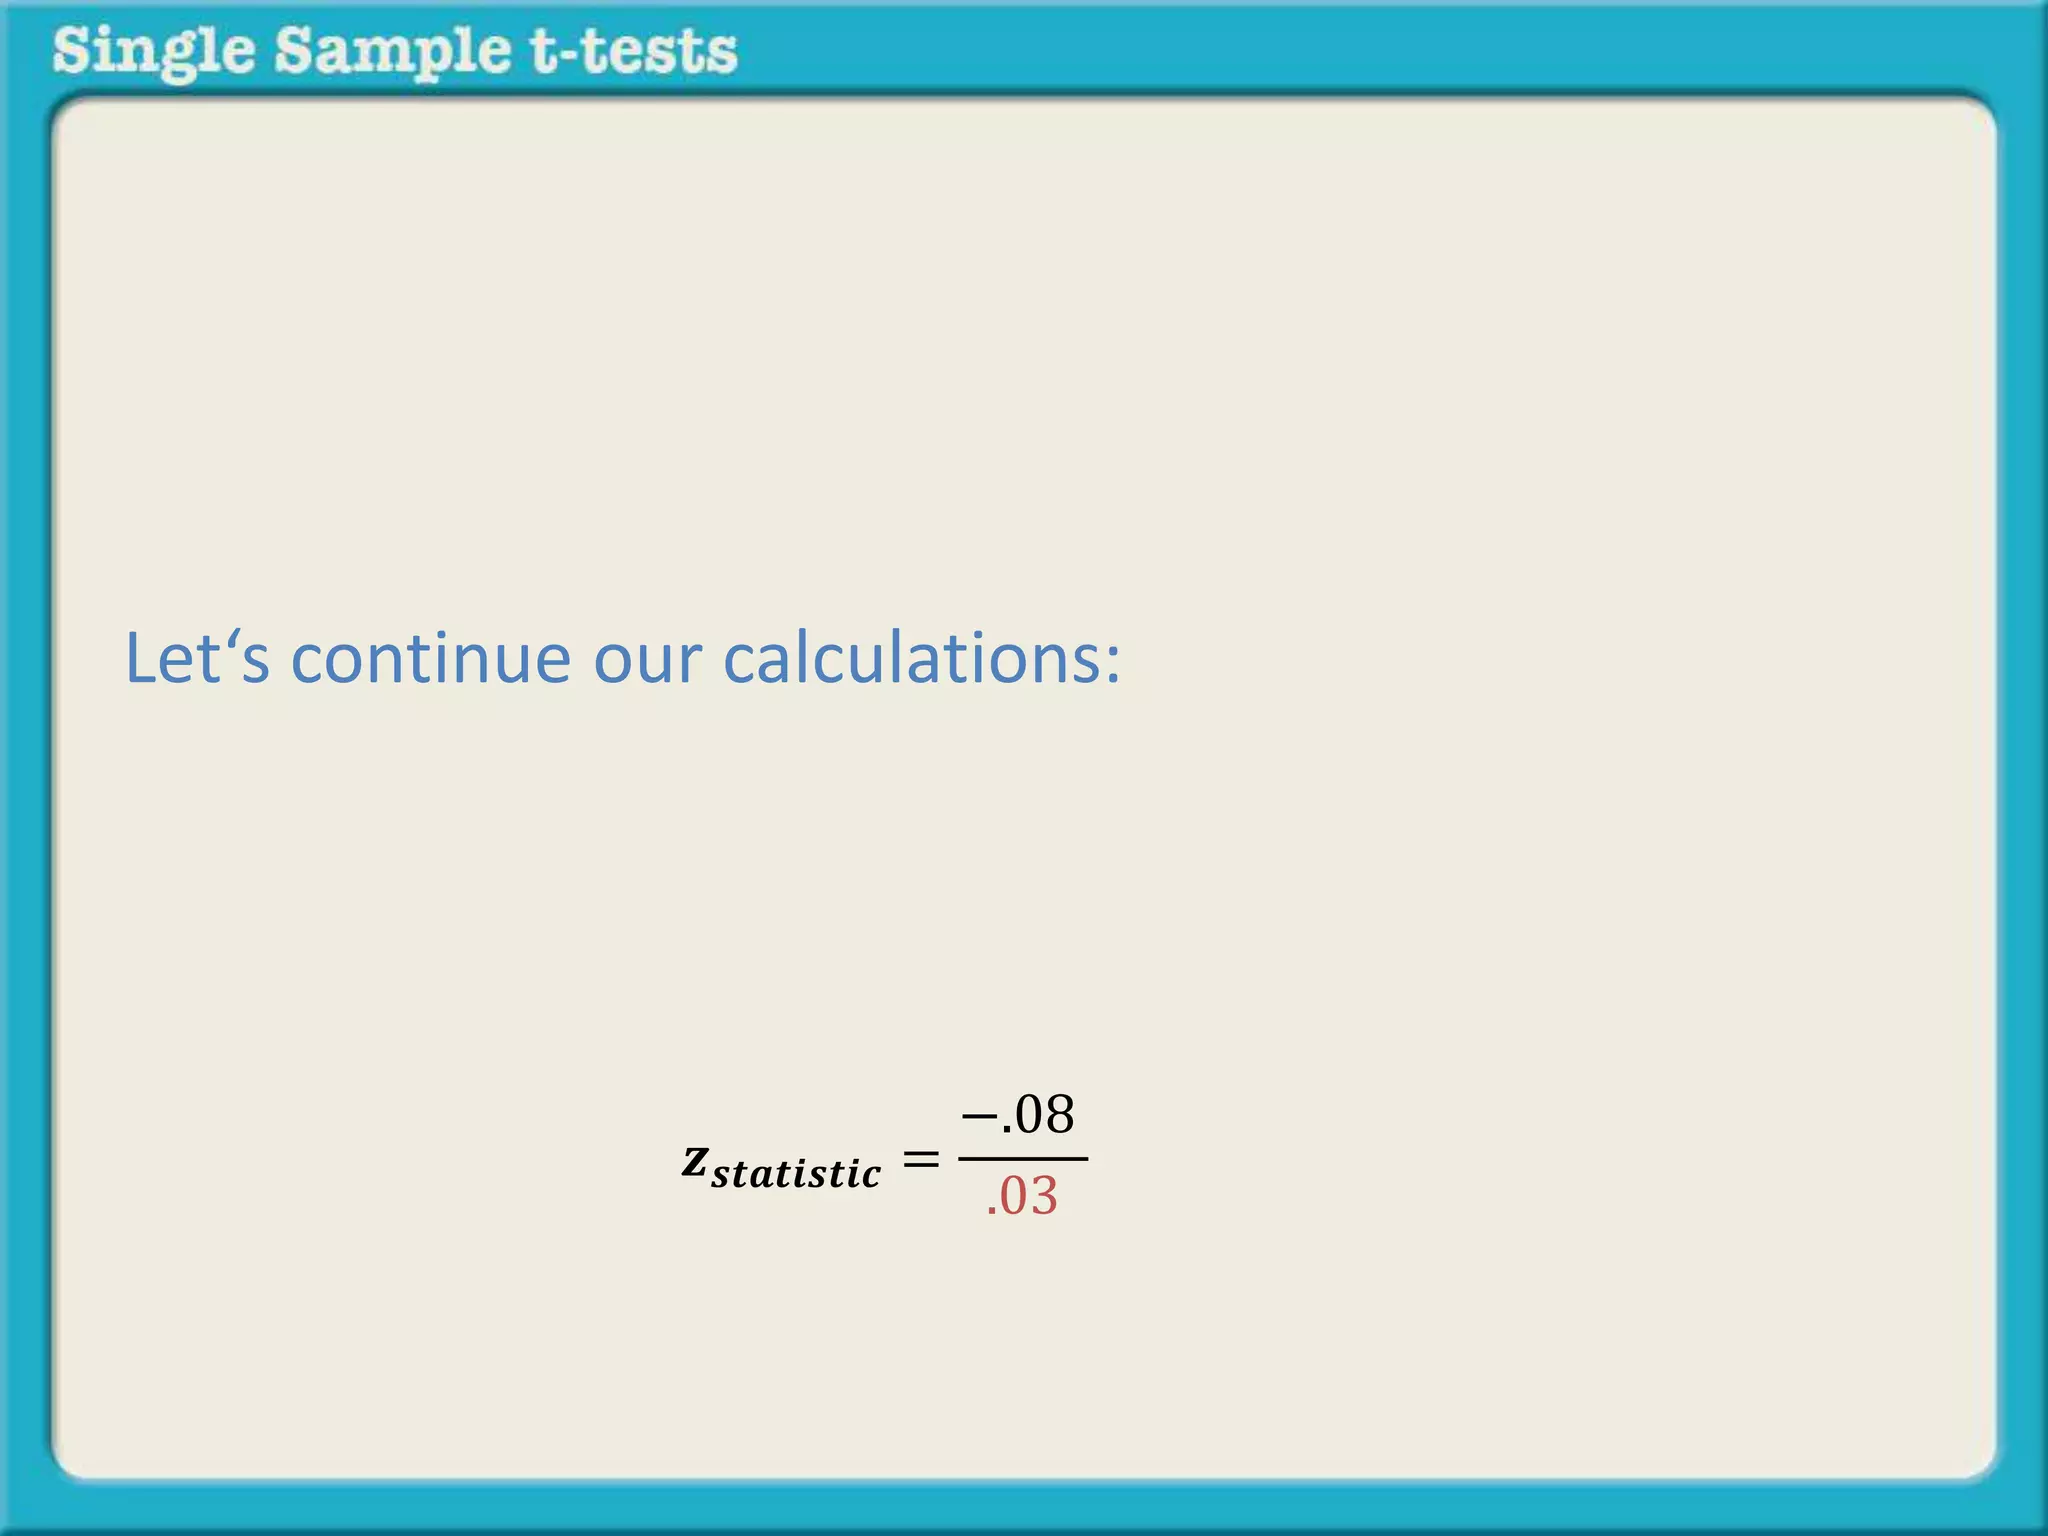
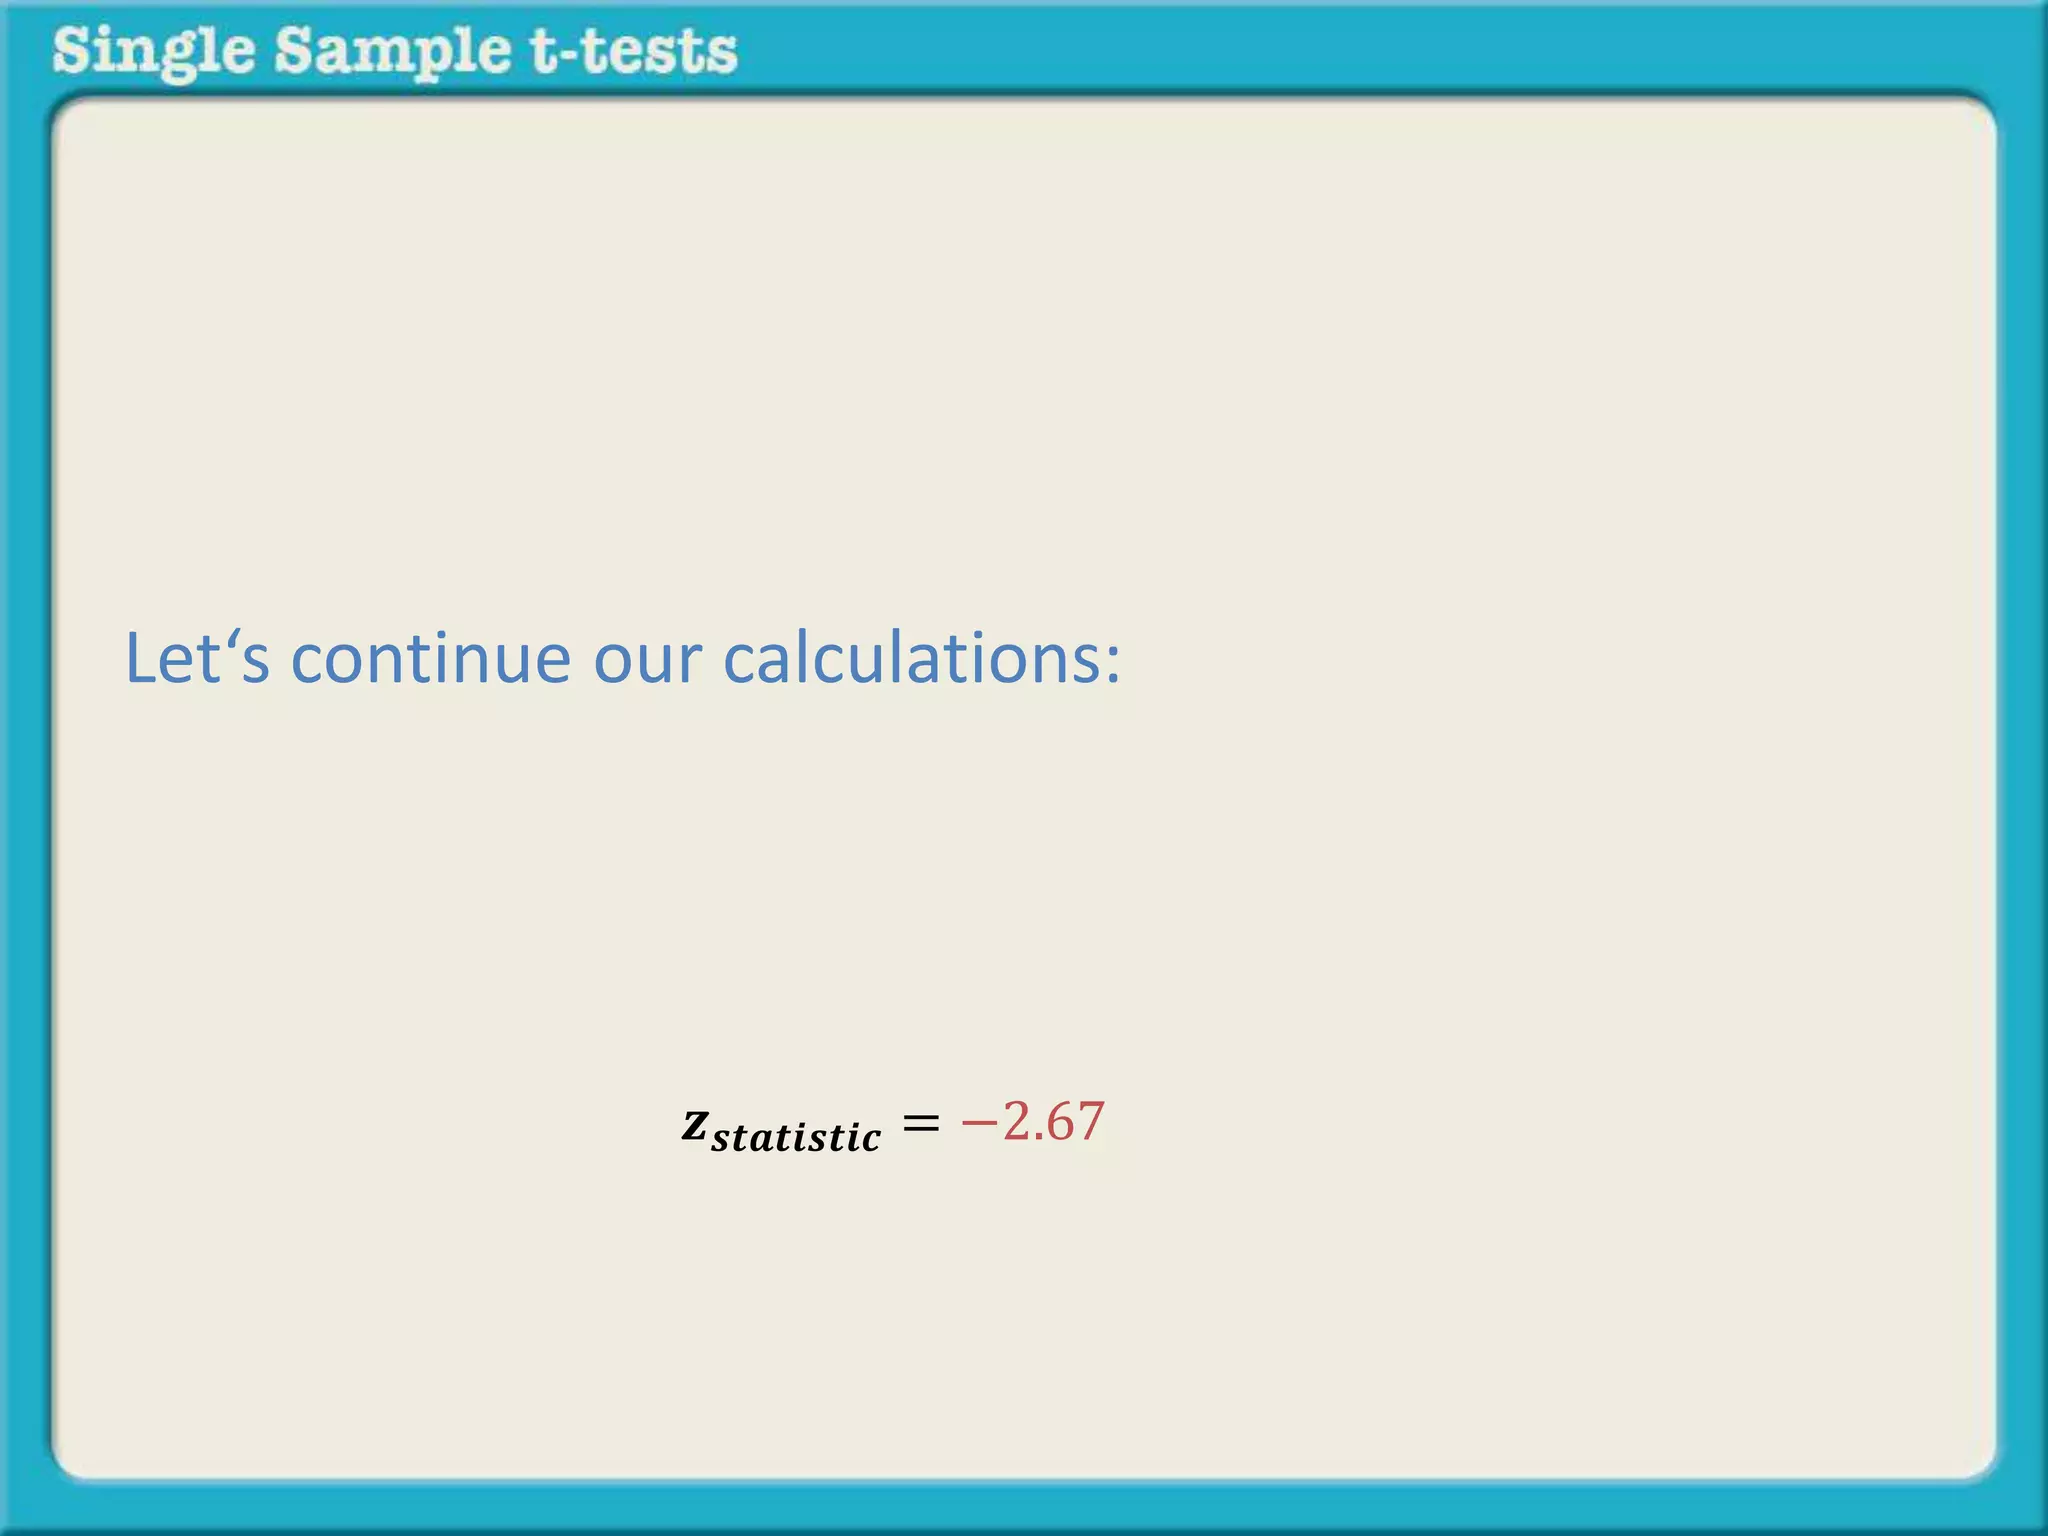
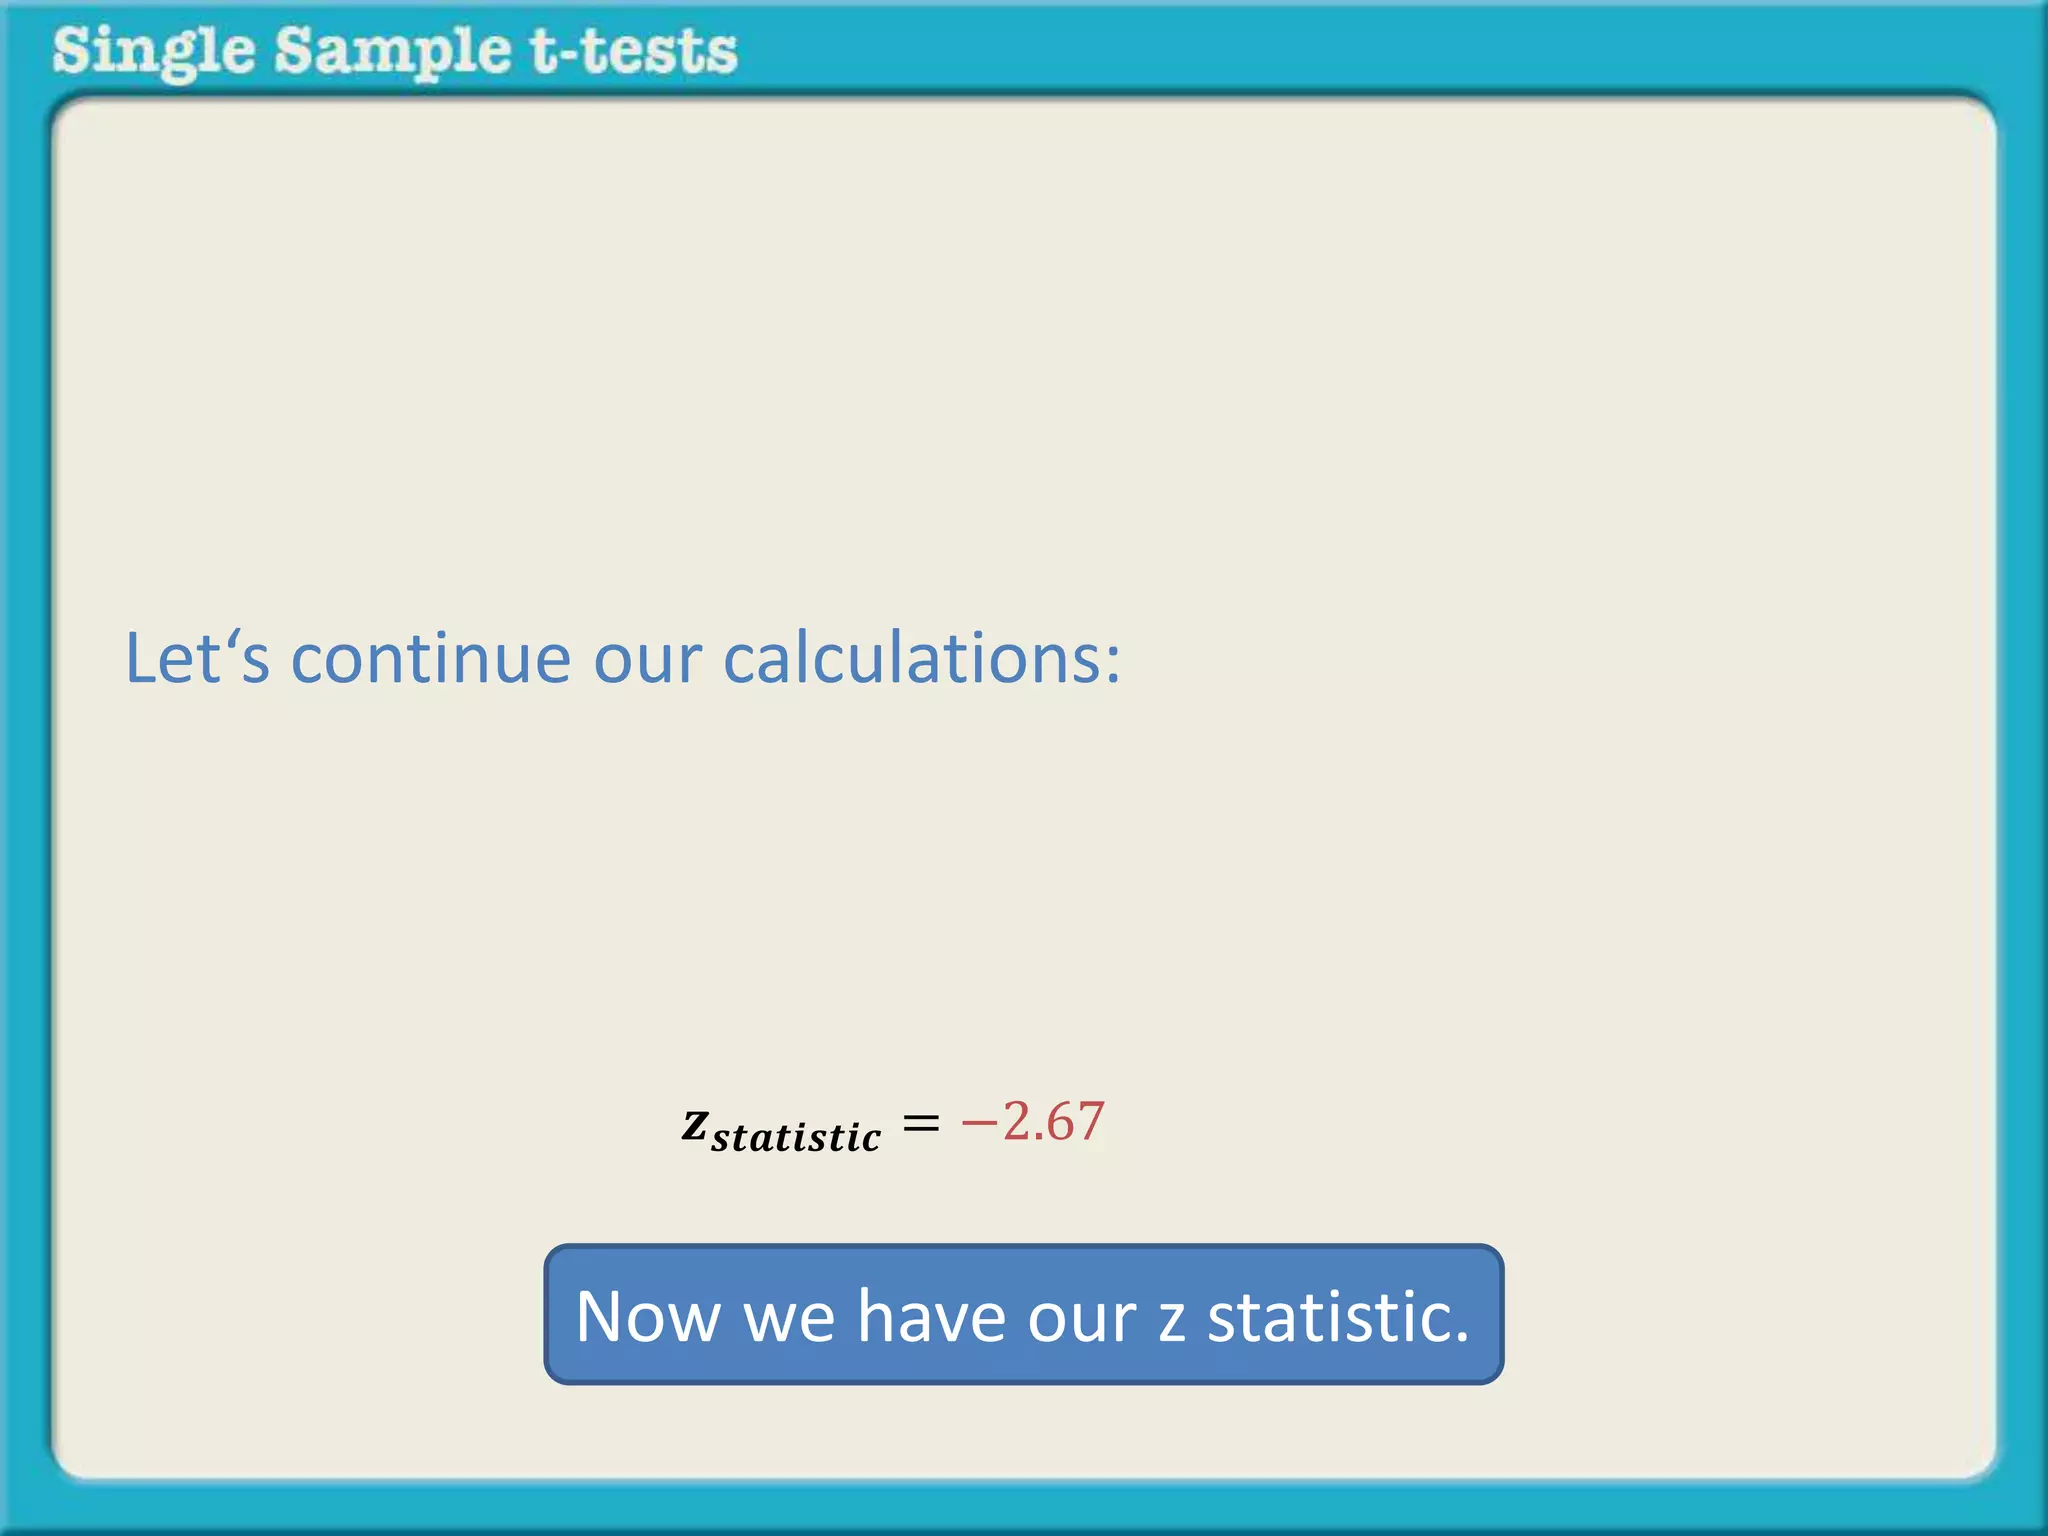
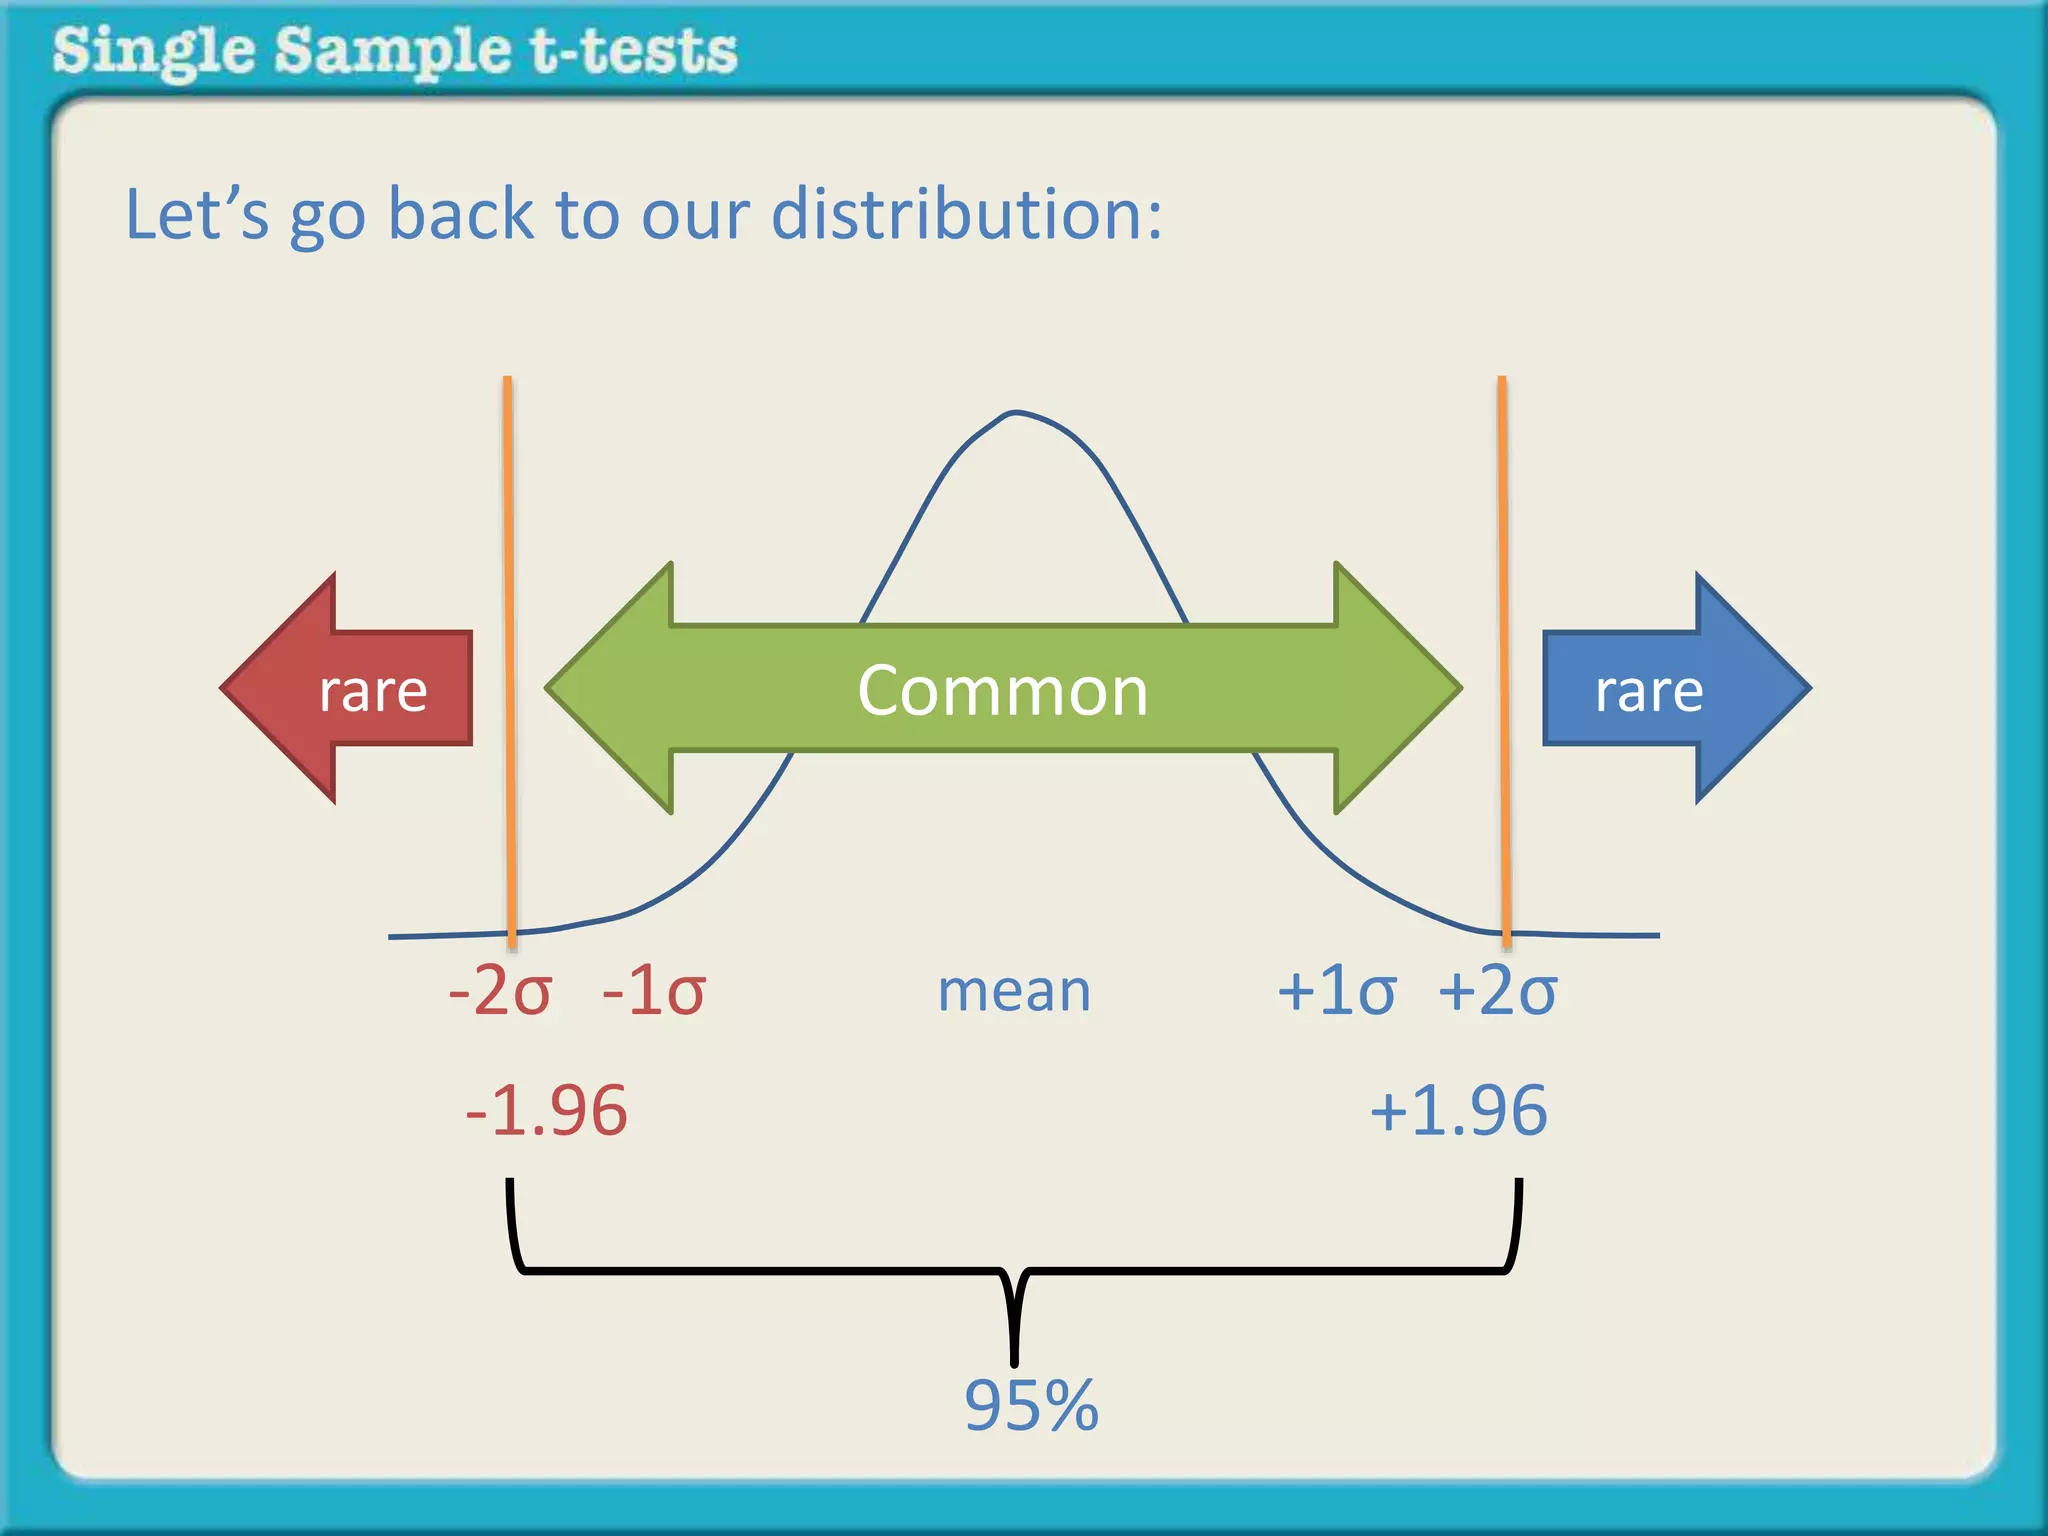
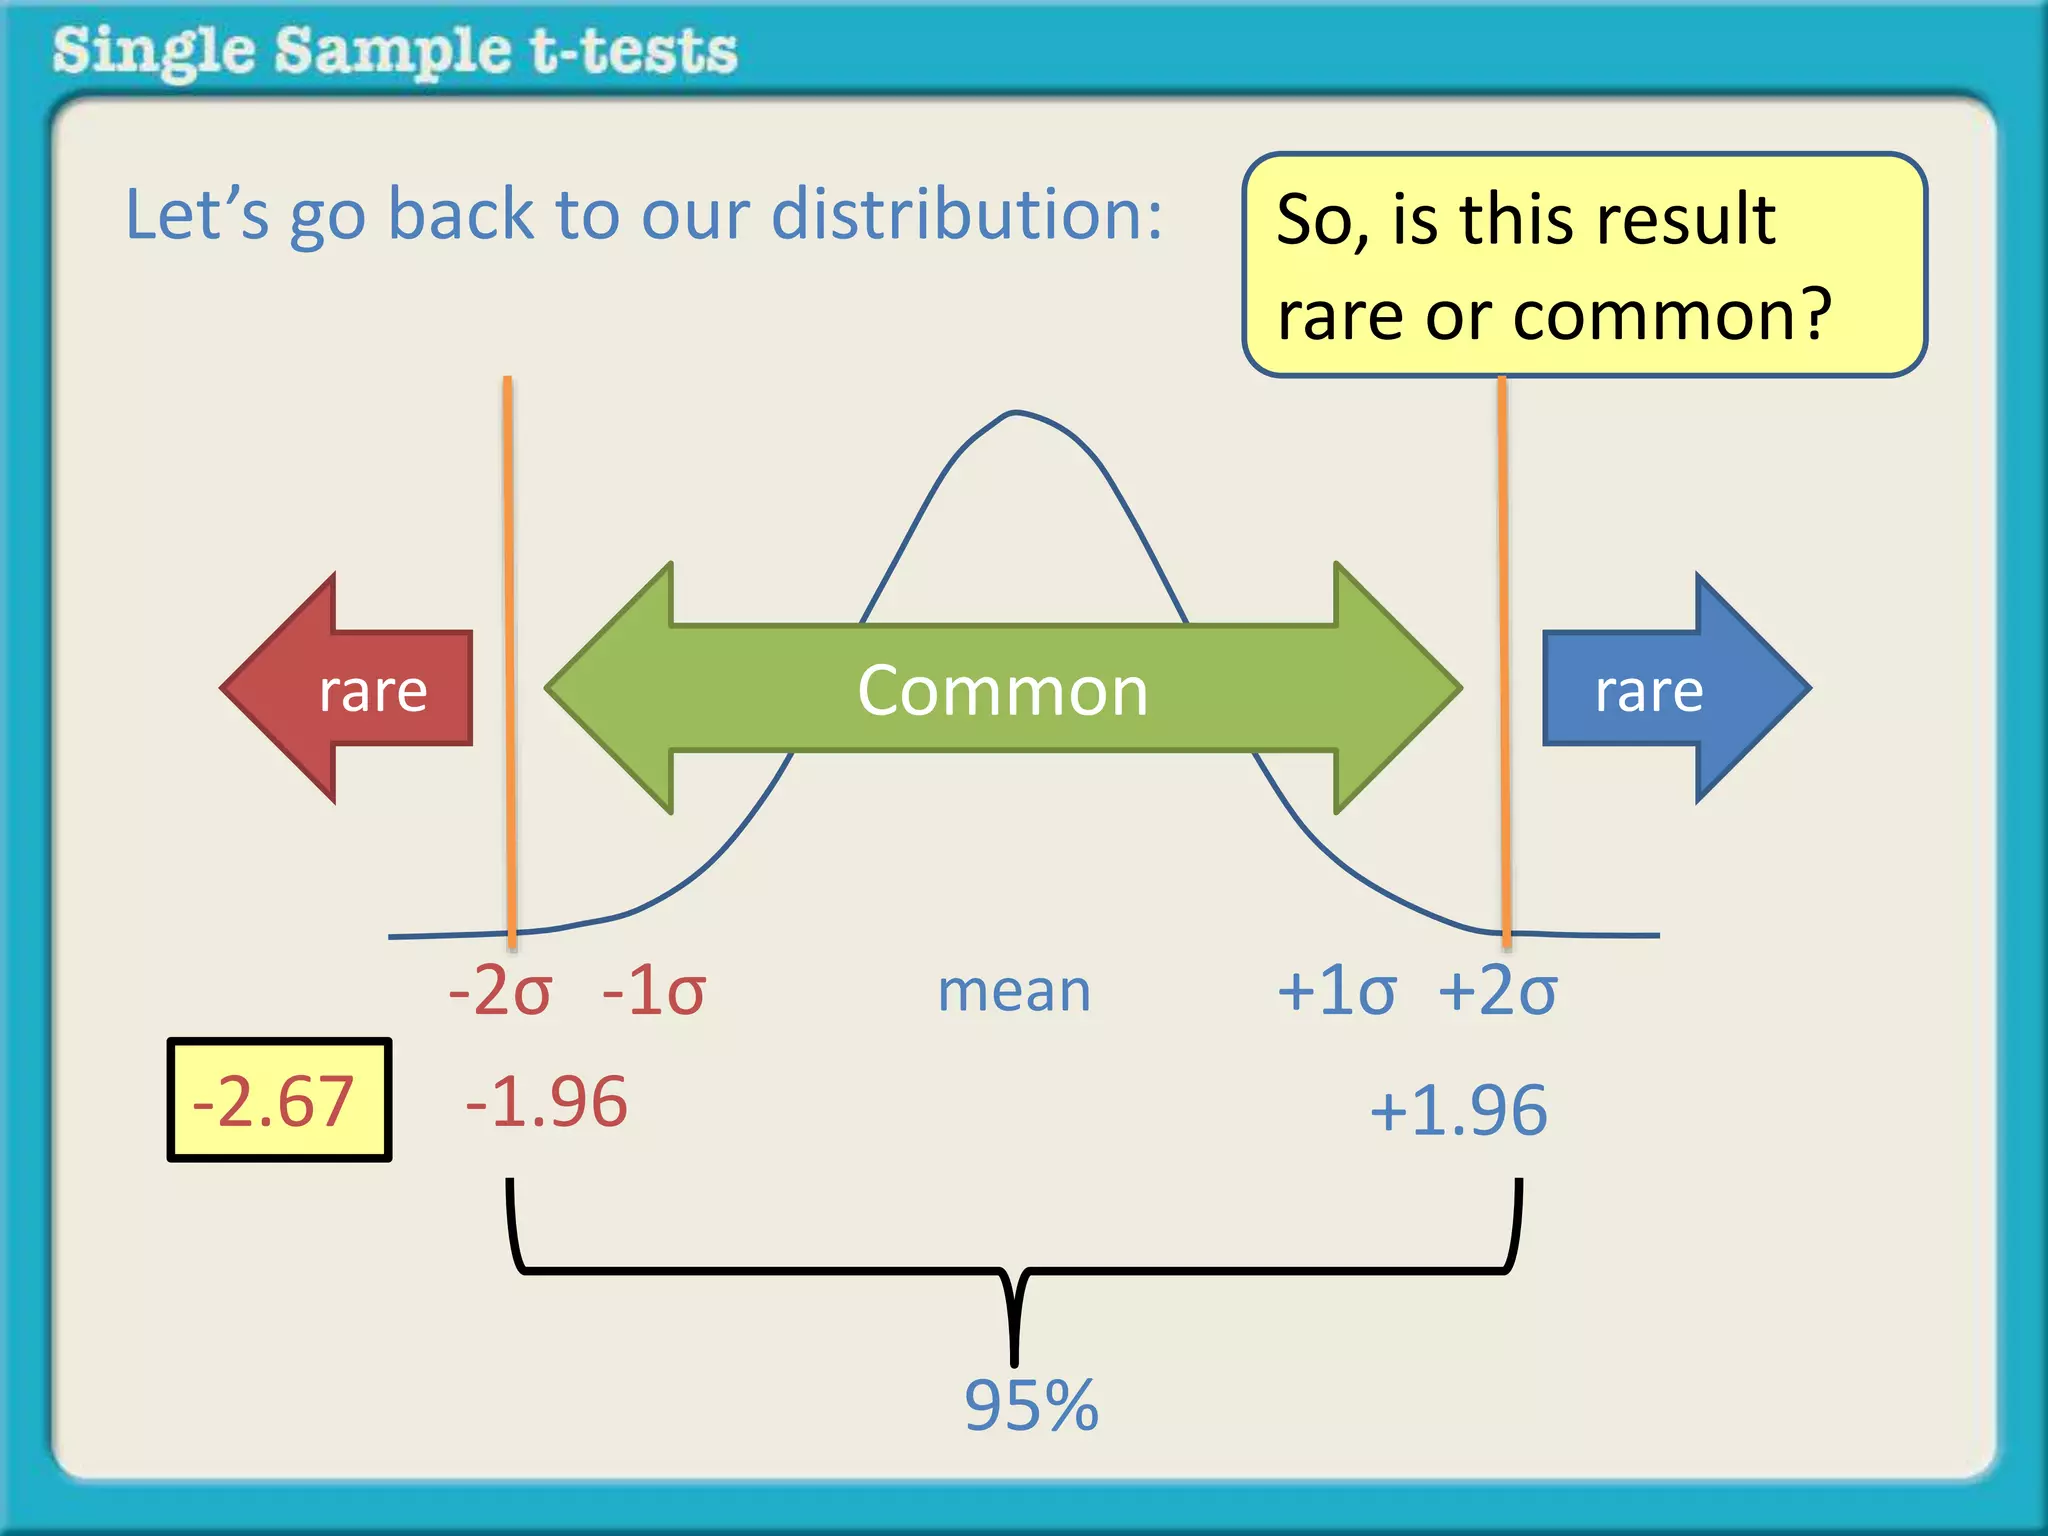
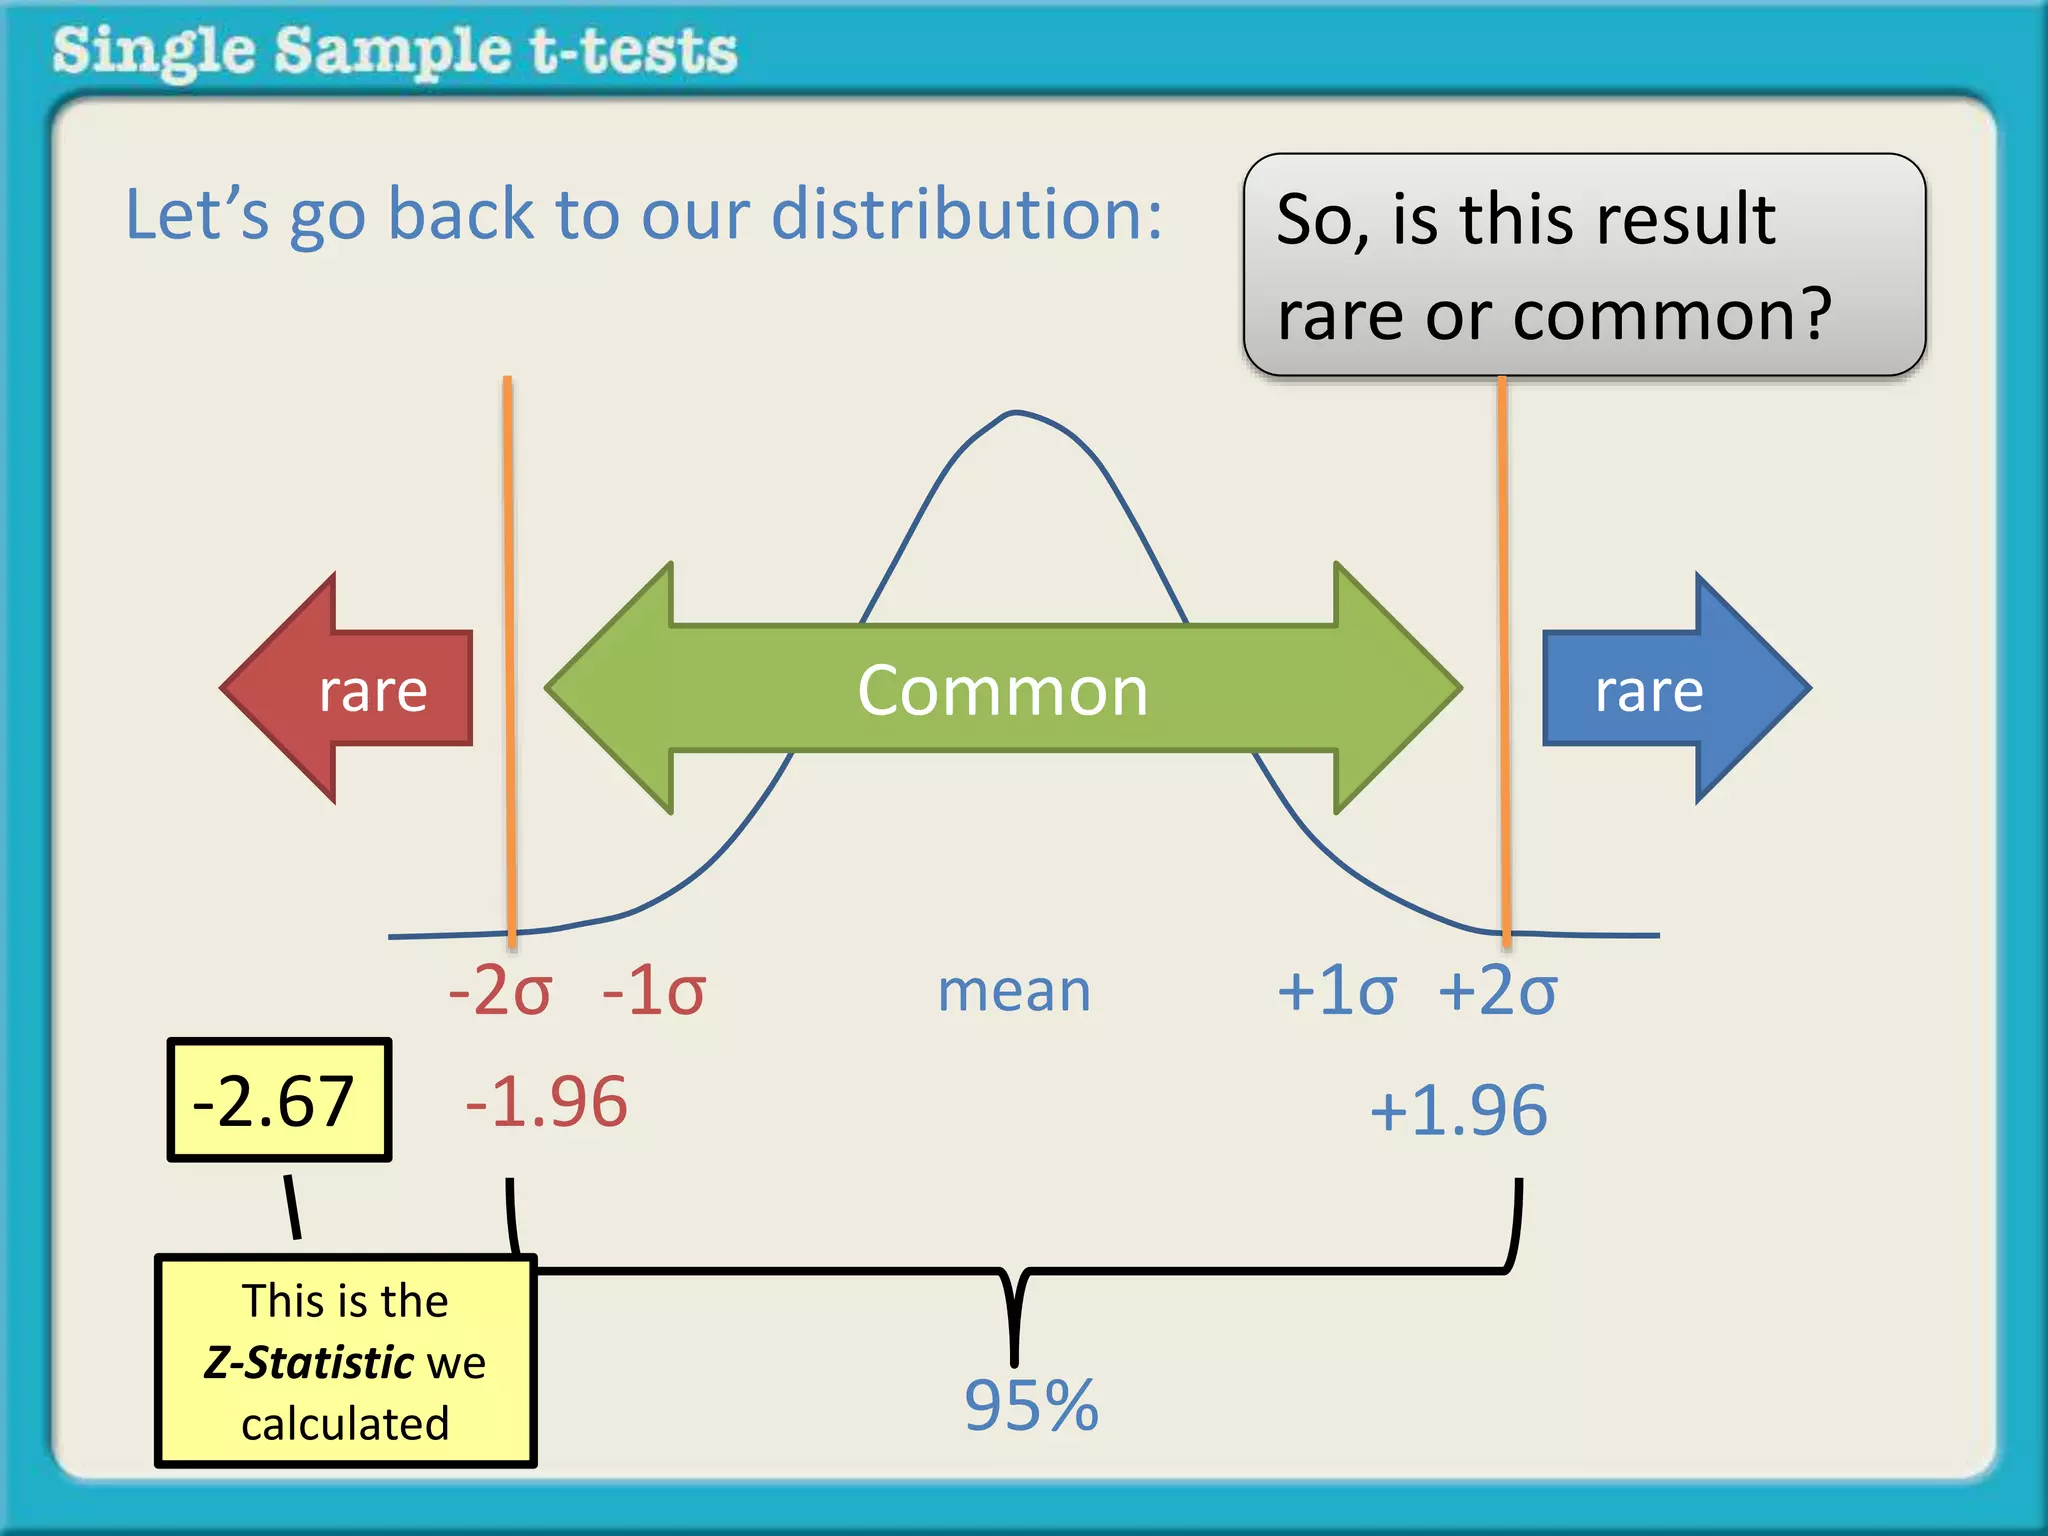
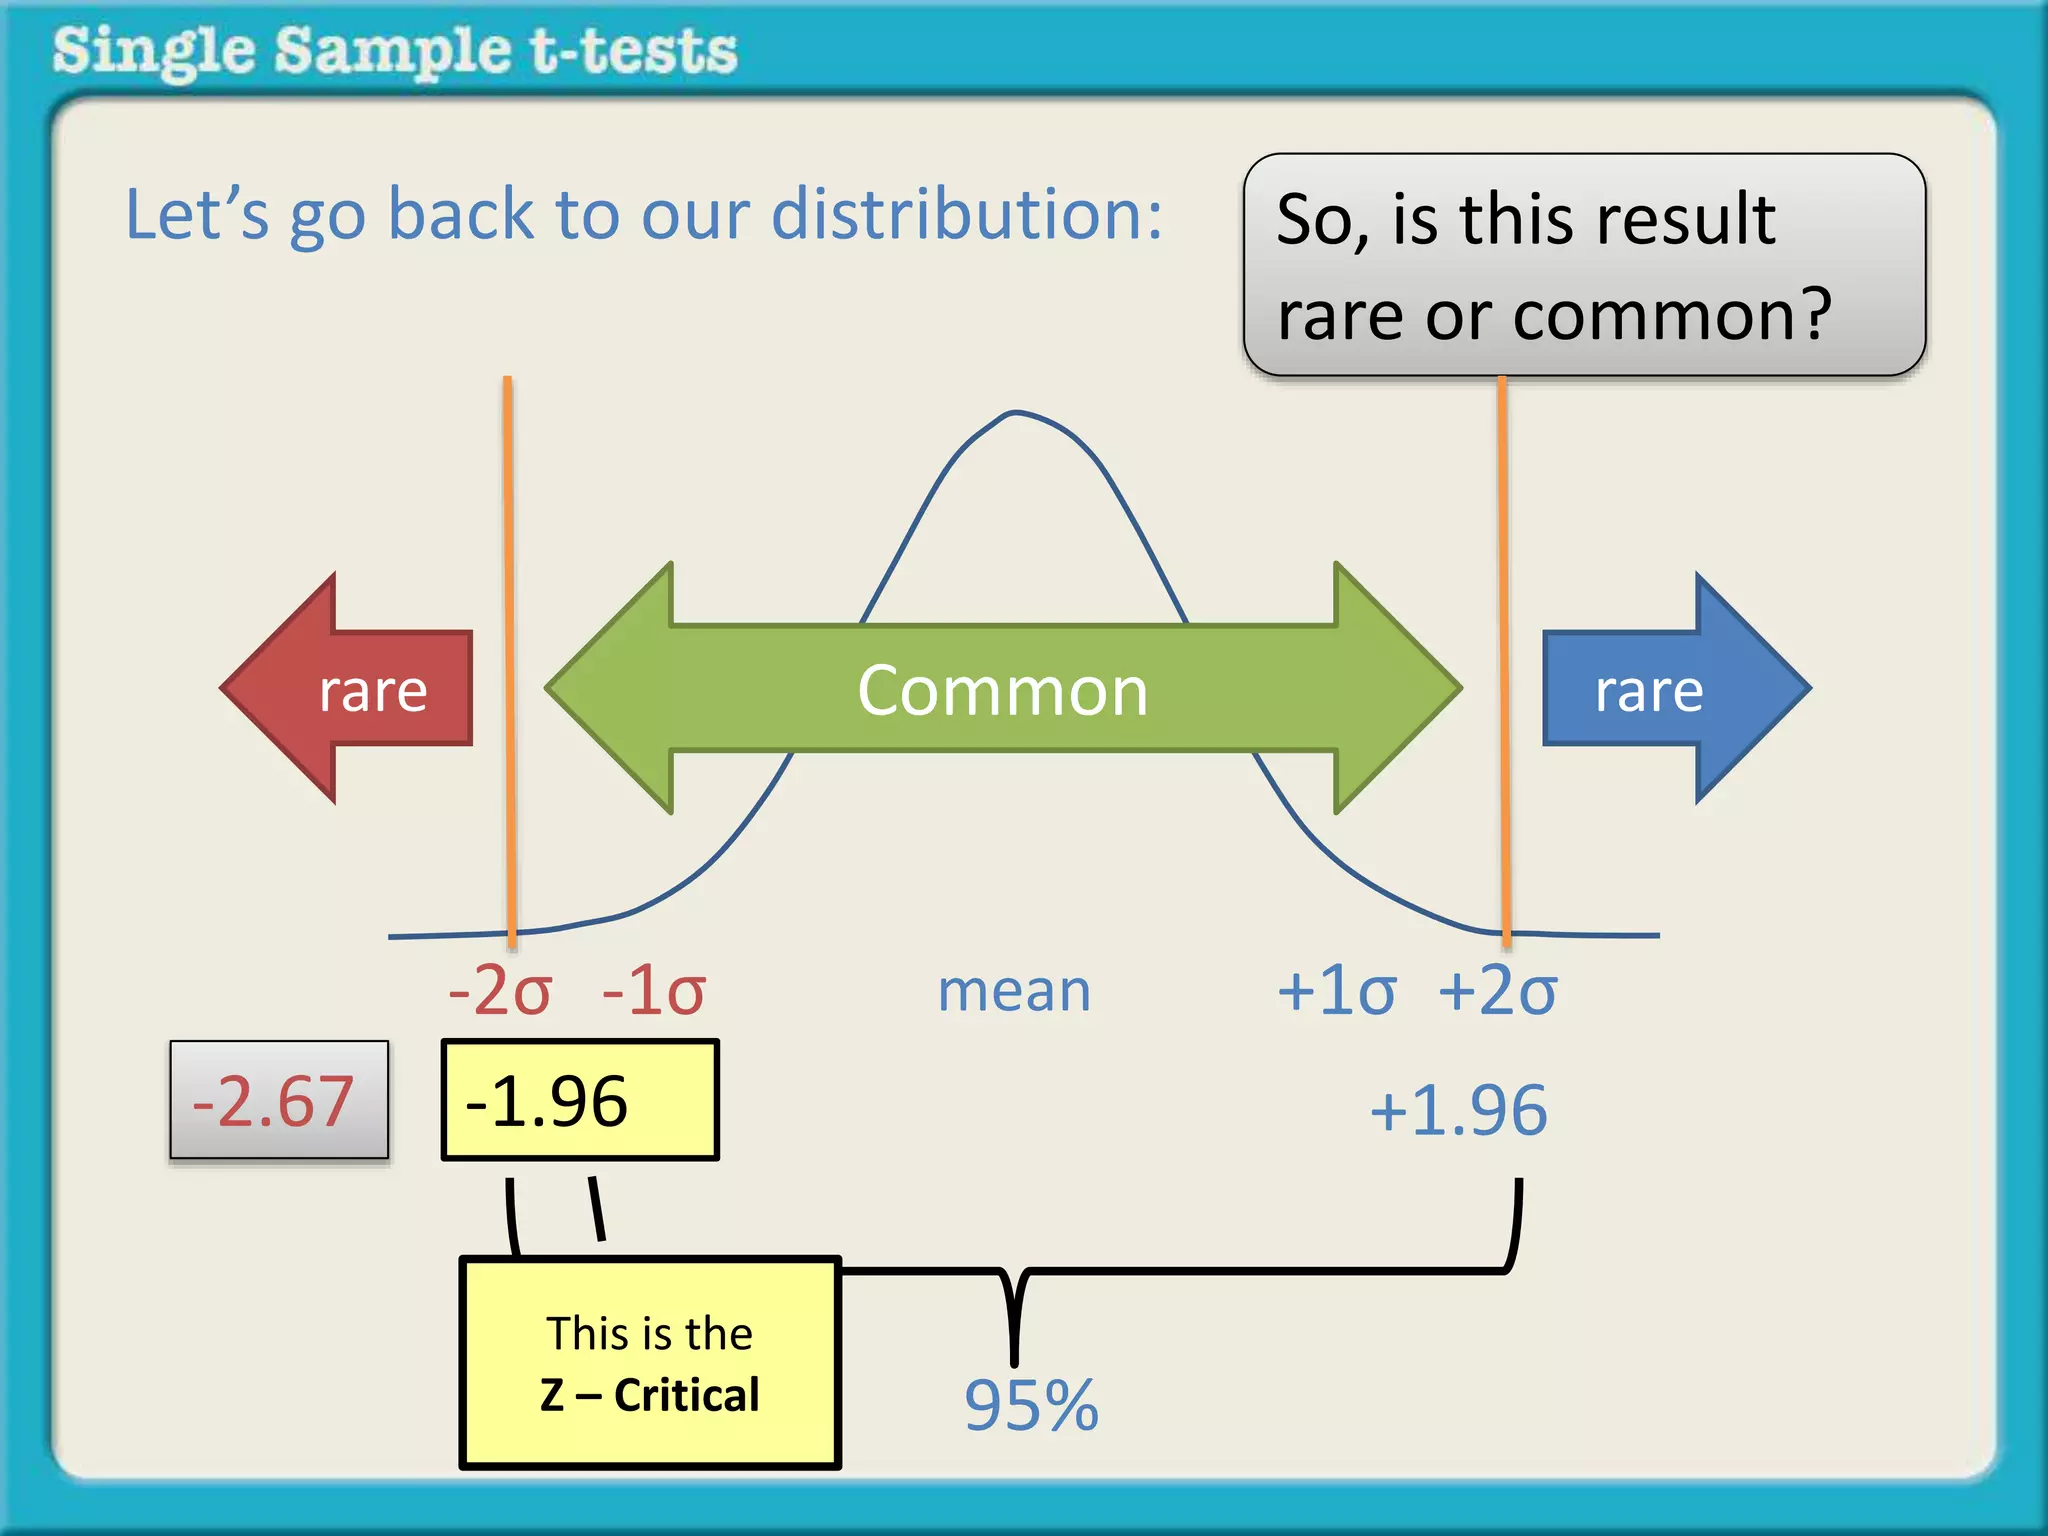
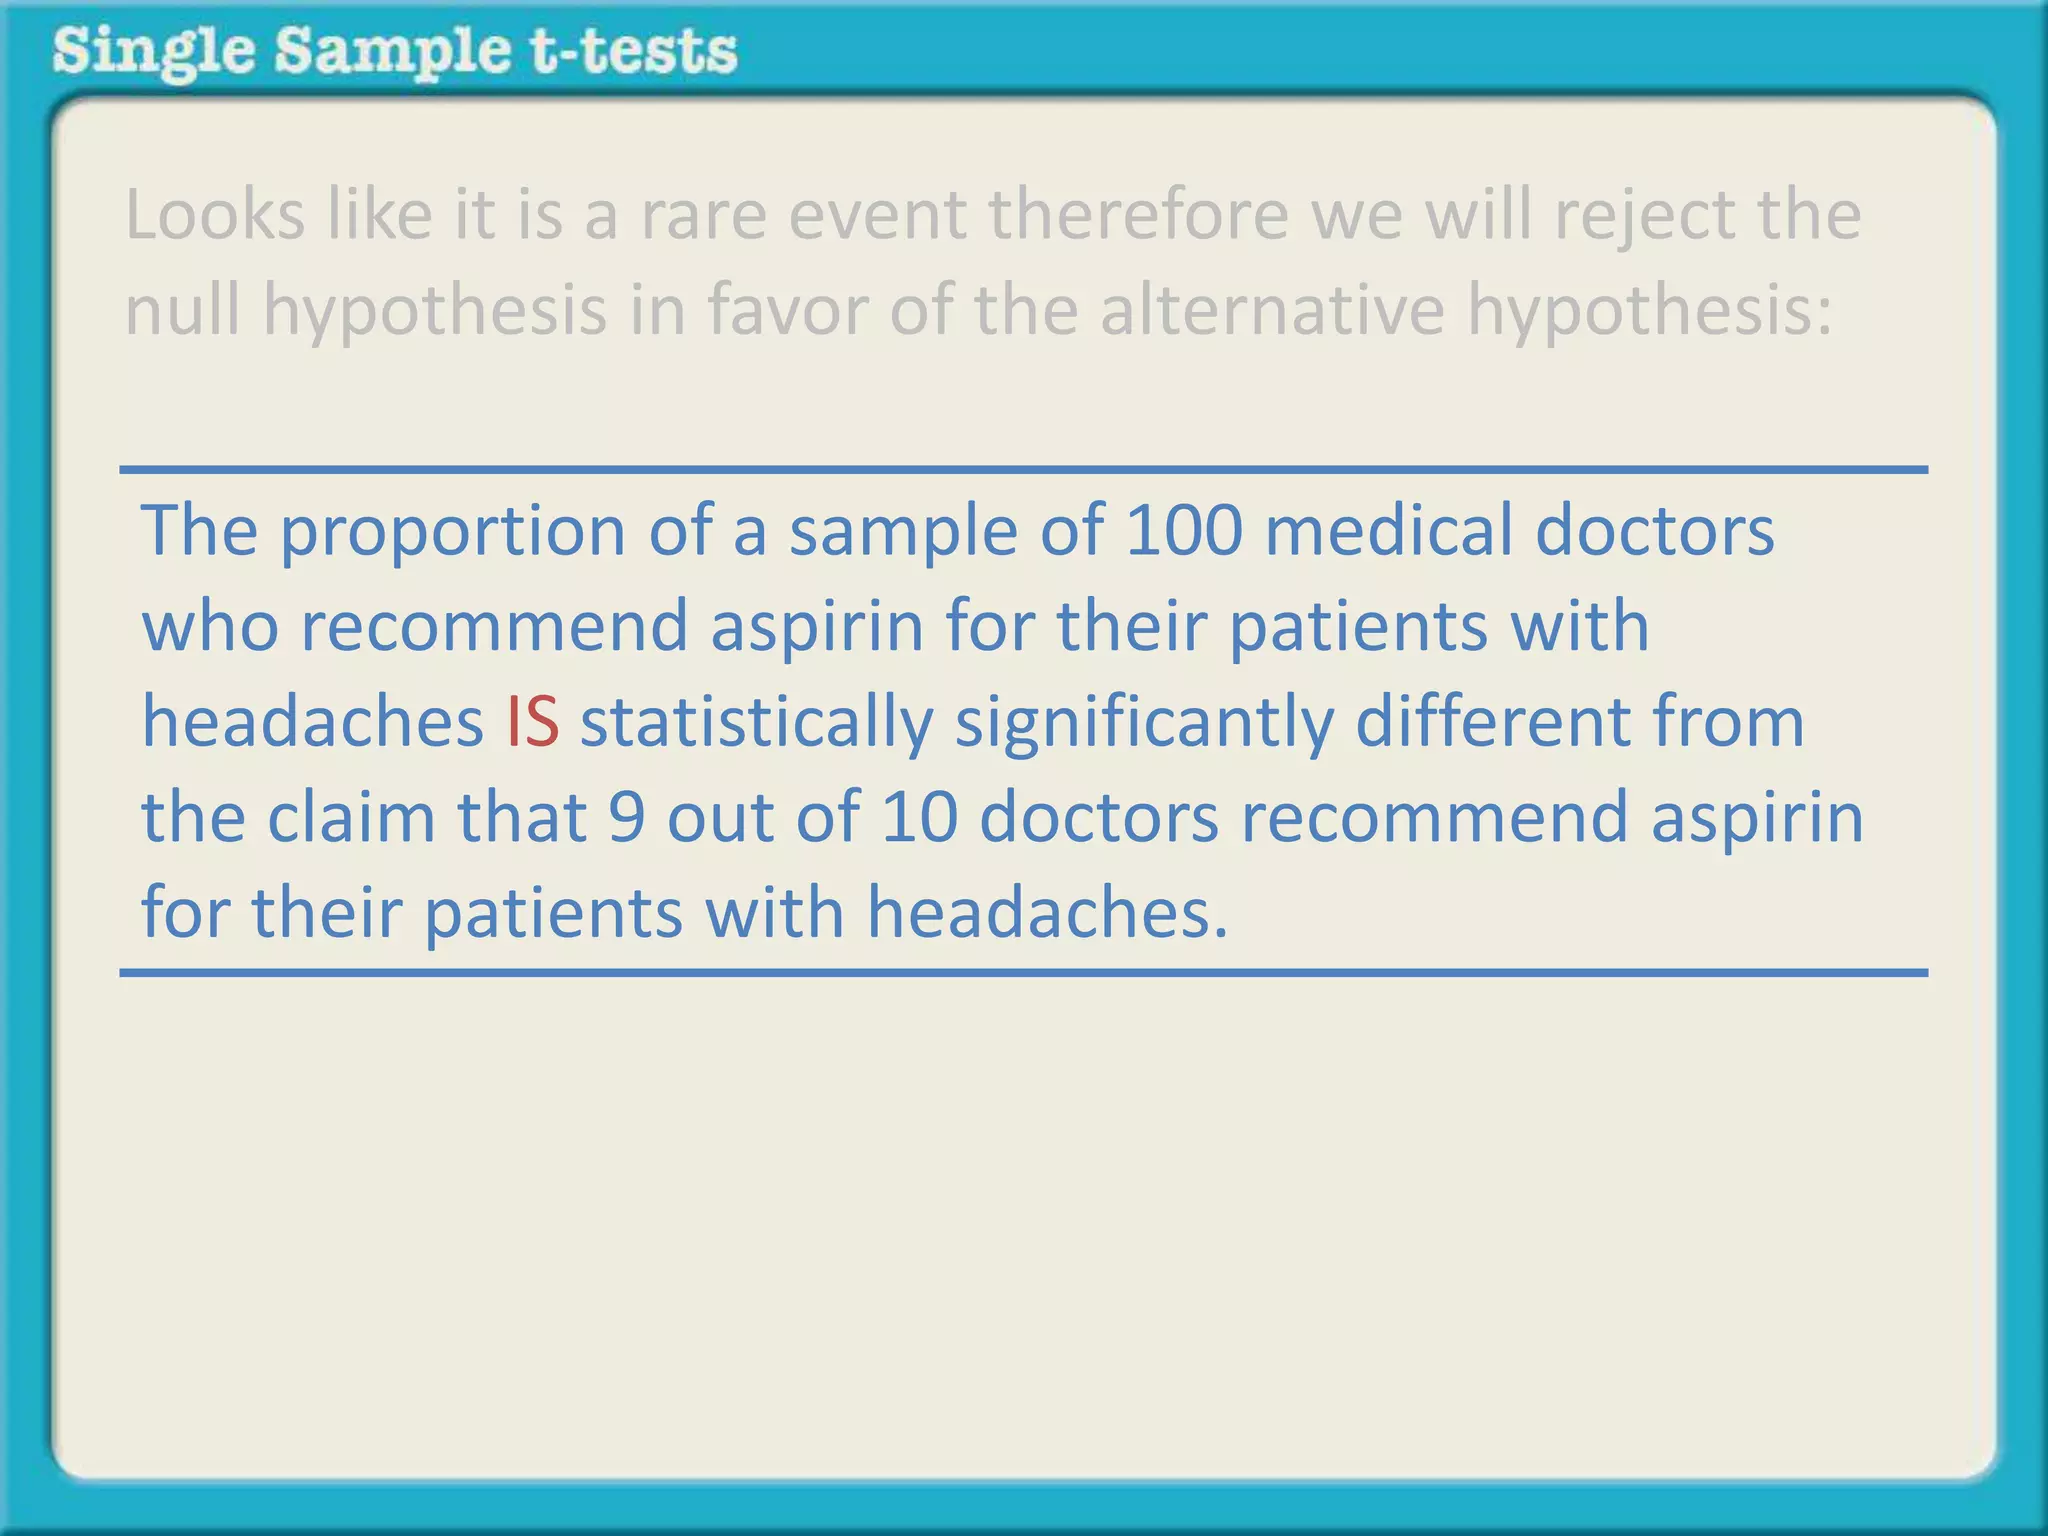

The document explains how to calculate a single-sample z-test. It provides an example of testing a claim that 9 out of 10 doctors recommend aspirin by taking a random sample of 100 doctors, of which 82 recommend aspirin. It defines the null and alternative hypotheses, identifies the critical z-value of -1.96 and +1.96, and shows the step-by-step calculations to find the z-statistic of -2.67, which falls outside the critical values. This indicates the sample result is statistically significant and differs from the claimed population value.


