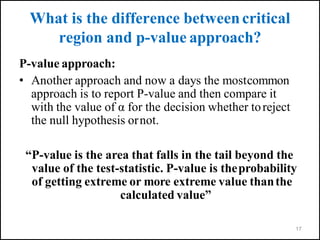
Shakir Rahman
BScN, MScN, MSc Applied Psychology, PhD Nursing (Candidate)
University of Minnesota USA.
Principal & Assistant Professor
Ayub International College of Nursing & AHS Peshawar
Visiting Faculty
Swabi College of Nursing & Health Sciences Swabi
Nowshera College of Nursing & Health Sciences Nowshera
Type I and Type II errors,
Power of the test &P-value
Objectives
By the end of this session, the students should be able to:
• Define the Type I & Type II errors
• How to interpret the Type I & Type II errors
• Understand the power of a test and factors affecting power.
• Computation of p-value for Z test (large sample)
• Report appropriate conclusion based on p-value
Errors in HypothesisTesting
Jury
Decision Truth
Innocent Guilty
Innocent OK ERROR
Guilty ERROR OK
Errors in HypothesisTesting
Innocent
Innocent
Guilty
Guilty
OK (1- )
OK (1-)
Type I
ERROR()
Type II
ERROR
(
Type II error is the opposite of a Type I error
Definitions: Types of Errors
• Type I error: Null hypothesis is actually true butthe
decision is to rejectit.
• Type II error: Null hypothesis is actually false butour
decision is fail toreject.
• There is always a chance of making one of theseerrors.
We’ll want to minimize the chance of doingso!
Definitions
• Type I error is committed if we reject the null
hypothesis when it is true. The probability of a typeI
error is denoted by the symbol()
–  = P(reject Ho|Ho istrue)
• Type II error is committed if we fail to reject the null
hypothesis when it is false. The probability of a type II
error is denoted by the symbol()
• = P(fail to reject Ho|Ho isfalse)
Chances ofError
• If the conclusion of a test of hypothesis is FAILTO
REJECT H0 then it means that:
• There is no effect, i.e. H0 istrue.
• Or we have made a Type II error.
hypothesis is to
• If the conclusion of a testof
REJECT H0 then it means that:
• There is as effect, i.e. H0 isfalse.
• Or we have made a Type Ierror.
Type I Error and ConfidenceInterval
5
0
0.
0.
1
0
0.01
0.99 CI: 1- 
&
 : 1- CI
• “Power” of a test is the probability ofrejecting null
hypothesis when it is false CORRECT DECISION
• Tominimize the type II error, we equivalently want to
maximize power
Type II Error and Power
Type I Error and ConfidenceInterval
.2
.8
0.4
0.6
power: 1- 
&
 : 1- power
Factors AffectingPower
Power
•
• Variance/deviation …………….
Alpha (type I error)…………….. Power
• Beta(type IIerror)………………. Power
• Sample size…………………… Power
15
Elements of a Test ofHypothesis
Rejection Region Approach: P-value
Approach:
- Hypothesis (Null &Alternative)
- Choice of appropriate
- Test Statistic
- Identification of CriticalRegion
- Conclusion
- Hypothesis (Null &Alternative)
- Choice of appropriate
- Test Statistic
- Obtain p-value
- Conclusion
16
What is the difference betweencritical
region and p-value approach?
Critical regionapproach:
In this approach, we use the value of α and researcher
hypothesis (Ha) to select the rejection region and then
compare it with the value of test statistic for making the
decision of whether to reject H0 ornot.
One-tailed, upper tail/right tail  Ha:  > 0 Zcal>Ztab
One-tailed, lower tail/left tail  Ha:  < 0 Zcal<-Ztab
Two-tailed  Ha:   0  Zcal>Ztab OR Zcal<-Ztab
Two tailed test with 5% (α)
1- α = 95% i.e. 0.95
α = 5% i.e. 0.05
α/2 = 0.025
1- α = 95%
α/2 = 0.025 α/2 = 0.025
0.475 0.475
-1.96 1.96
Two tailed test with 1% (α)
1- α = 99% i.e. 0.99
α = 1% i.e. 0.01
α/2 = 0.005
1- α = 99%
α/2 = 0.005 α/2 = 0.005
0.495 0.495
-2.58 2.58
Right tailed test with 5% (α)
1- α = 95% i.e. 0.95
α = 5% i.e. 0.05
1- α = 95%
α = 0.05
0.45
1.64
Right tailed test with 1% (α)
1- α = 99% i.e. 0.99
α = 1% i.e. 0.01
1- α = 99%
α = 0.01
0.49
2.33
What is the difference betweencritical
region and p-value approach?
P-value approach:
• Another approach and now a days the mostcommon
approach is to report P-value and then compare it
with the value of α for the decision whether toreject
the null hypothesis ornot.
“P-value is the area that falls in the tail beyond the
value of the test-statistic. P-value is theprobability
of getting extreme or more extreme value thanthe
calculated value”
17
18
Steps for Calculating theP-value
• Choose the level of significance
• Determine the value of the test statistic Zcal from the
sample data. Look up the Z-statistic and find the
corresponding probability:
– One-tailed test: the p-value= tail area beyond Zcal in
the same direction as the alternative hypothesis
– Two-tailed test: the p-value= 2 times the tail area
beyond Zcal in the direction of the sign of Zcal
• Reject the null hypothesis, if the p-value is less than the
value of level of significance (α).
19
Example: Mean APTT amongDVT
patients
• A researcher assumes that APTT of population of patients
diagnosed with deep vein thrombosis (DVT) is
approximately normally distributed with standard deviation
of 7 seconds. A random sample of 30 hospitalized patients
suffering from DVT had a mean APTT of 53 seconds. Use
a 5 percent level of significance.
– Test the hypothesis using P-value method that mean
APTT for DVT patients is different from 53 seconds?
Example: Mean APTT among DVTpatients
1) Hypothesis:
 Ho :  =53 seconds.
 Ha :  ≠53 seconds
2) StatingAlpha
α = 0.05
3) Test Statistic:
20

Z c a l   2 . 35
z 
x  0
 n
21
4) Calculation of p-value:
- The value of test statistic is Z = -2.35
- Ignoring the sign, area between Z=0 & Z=2.35
is 0.4906
- Area beyond Z=2.35 will be 0.5-0.4906=0.0094
- For two tailed hypothesis:
Area will be 2x0.0094=0.0188(p-value)
(Graph)
5) Conclusion:
Since p-value (0.0188) is less than α (0.05), we reject our null
hypothesis and we have enough evidence to conclude that the
mean APTT of DVT patients is different from 53seconds.
Example: Mean APTT among DVTpatients
(Contd.)
References
• Bluman, A. (2004). Elementary statistics: A
step by step approach. Boston: Mc Graw Hill.
Acknowledgements
Dr Tazeen Saeed Ali
RM, RM, BScN, MSc ( Epidemiology &
Biostatistics), Phd (Medical Sciences), Post
Doctorate (Health Policy & Planning)
Associate Dean School of Nursing &
Midwifery
The Aga Khan University Karachi.
Kiran Ramzan Ali Lalani
BScN, MSc Epidemiology & Biostatistics (Candidate)
Registered Nurse (NICU)
Aga Khan University Hospital
Lecture 8 Type 1 and 2 errors.pptx

Lecture 8 Type 1 and 2 errors.pptx

  • 2.
    Shakir Rahman BScN, MScN,MSc Applied Psychology, PhD Nursing (Candidate) University of Minnesota USA. Principal & Assistant Professor Ayub International College of Nursing & AHS Peshawar Visiting Faculty Swabi College of Nursing & Health Sciences Swabi Nowshera College of Nursing & Health Sciences Nowshera Type I and Type II errors, Power of the test &P-value
  • 3.
    Objectives By the endof this session, the students should be able to: • Define the Type I & Type II errors • How to interpret the Type I & Type II errors • Understand the power of a test and factors affecting power. • Computation of p-value for Z test (large sample) • Report appropriate conclusion based on p-value
  • 4.
    Errors in HypothesisTesting Jury DecisionTruth Innocent Guilty Innocent OK ERROR Guilty ERROR OK
  • 5.
  • 6.
    Errors in HypothesisTesting Innocent Innocent Guilty Guilty OK(1- ) OK (1-) Type I ERROR() Type II ERROR ( Type II error is the opposite of a Type I error
  • 7.
    Definitions: Types ofErrors • Type I error: Null hypothesis is actually true butthe decision is to rejectit. • Type II error: Null hypothesis is actually false butour decision is fail toreject. • There is always a chance of making one of theseerrors. We’ll want to minimize the chance of doingso!
  • 8.
    Definitions • Type Ierror is committed if we reject the null hypothesis when it is true. The probability of a typeI error is denoted by the symbol() –  = P(reject Ho|Ho istrue) • Type II error is committed if we fail to reject the null hypothesis when it is false. The probability of a type II error is denoted by the symbol() • = P(fail to reject Ho|Ho isfalse)
  • 9.
    Chances ofError • Ifthe conclusion of a test of hypothesis is FAILTO REJECT H0 then it means that: • There is no effect, i.e. H0 istrue. • Or we have made a Type II error. hypothesis is to • If the conclusion of a testof REJECT H0 then it means that: • There is as effect, i.e. H0 isfalse. • Or we have made a Type Ierror.
  • 10.
    Type I Errorand ConfidenceInterval 5 0 0. 0. 1 0 0.01 0.99 CI: 1-  &  : 1- CI
  • 11.
    • “Power” ofa test is the probability ofrejecting null hypothesis when it is false CORRECT DECISION • Tominimize the type II error, we equivalently want to maximize power Type II Error and Power
  • 12.
    Type I Errorand ConfidenceInterval .2 .8 0.4 0.6 power: 1-  &  : 1- power
  • 13.
    Factors AffectingPower Power • • Variance/deviation……………. Alpha (type I error)…………….. Power • Beta(type IIerror)………………. Power • Sample size…………………… Power
  • 14.
    15 Elements of aTest ofHypothesis Rejection Region Approach: P-value Approach: - Hypothesis (Null &Alternative) - Choice of appropriate - Test Statistic - Identification of CriticalRegion - Conclusion - Hypothesis (Null &Alternative) - Choice of appropriate - Test Statistic - Obtain p-value - Conclusion
  • 15.
    16 What is thedifference betweencritical region and p-value approach? Critical regionapproach: In this approach, we use the value of α and researcher hypothesis (Ha) to select the rejection region and then compare it with the value of test statistic for making the decision of whether to reject H0 ornot. One-tailed, upper tail/right tail  Ha:  > 0 Zcal>Ztab One-tailed, lower tail/left tail  Ha:  < 0 Zcal<-Ztab Two-tailed  Ha:   0  Zcal>Ztab OR Zcal<-Ztab
  • 16.
    Two tailed testwith 5% (α) 1- α = 95% i.e. 0.95 α = 5% i.e. 0.05 α/2 = 0.025 1- α = 95% α/2 = 0.025 α/2 = 0.025 0.475 0.475 -1.96 1.96
  • 17.
    Two tailed testwith 1% (α) 1- α = 99% i.e. 0.99 α = 1% i.e. 0.01 α/2 = 0.005 1- α = 99% α/2 = 0.005 α/2 = 0.005 0.495 0.495 -2.58 2.58
  • 18.
    Right tailed testwith 5% (α) 1- α = 95% i.e. 0.95 α = 5% i.e. 0.05 1- α = 95% α = 0.05 0.45 1.64
  • 19.
    Right tailed testwith 1% (α) 1- α = 99% i.e. 0.99 α = 1% i.e. 0.01 1- α = 99% α = 0.01 0.49 2.33
  • 20.
    What is thedifference betweencritical region and p-value approach? P-value approach: • Another approach and now a days the mostcommon approach is to report P-value and then compare it with the value of α for the decision whether toreject the null hypothesis ornot. “P-value is the area that falls in the tail beyond the value of the test-statistic. P-value is theprobability of getting extreme or more extreme value thanthe calculated value” 17
  • 21.
    18 Steps for CalculatingtheP-value • Choose the level of significance • Determine the value of the test statistic Zcal from the sample data. Look up the Z-statistic and find the corresponding probability: – One-tailed test: the p-value= tail area beyond Zcal in the same direction as the alternative hypothesis – Two-tailed test: the p-value= 2 times the tail area beyond Zcal in the direction of the sign of Zcal • Reject the null hypothesis, if the p-value is less than the value of level of significance (α).
  • 22.
    19 Example: Mean APTTamongDVT patients • A researcher assumes that APTT of population of patients diagnosed with deep vein thrombosis (DVT) is approximately normally distributed with standard deviation of 7 seconds. A random sample of 30 hospitalized patients suffering from DVT had a mean APTT of 53 seconds. Use a 5 percent level of significance. – Test the hypothesis using P-value method that mean APTT for DVT patients is different from 53 seconds?
  • 23.
    Example: Mean APTTamong DVTpatients 1) Hypothesis:  Ho :  =53 seconds.  Ha :  ≠53 seconds 2) StatingAlpha α = 0.05 3) Test Statistic: 20  Z c a l   2 . 35 z  x  0  n
  • 25.
    21 4) Calculation ofp-value: - The value of test statistic is Z = -2.35 - Ignoring the sign, area between Z=0 & Z=2.35 is 0.4906 - Area beyond Z=2.35 will be 0.5-0.4906=0.0094 - For two tailed hypothesis: Area will be 2x0.0094=0.0188(p-value) (Graph) 5) Conclusion: Since p-value (0.0188) is less than α (0.05), we reject our null hypothesis and we have enough evidence to conclude that the mean APTT of DVT patients is different from 53seconds. Example: Mean APTT among DVTpatients (Contd.)
  • 27.
    References • Bluman, A.(2004). Elementary statistics: A step by step approach. Boston: Mc Graw Hill.
  • 28.
    Acknowledgements Dr Tazeen SaeedAli RM, RM, BScN, MSc ( Epidemiology & Biostatistics), Phd (Medical Sciences), Post Doctorate (Health Policy & Planning) Associate Dean School of Nursing & Midwifery The Aga Khan University Karachi. Kiran Ramzan Ali Lalani BScN, MSc Epidemiology & Biostatistics (Candidate) Registered Nurse (NICU) Aga Khan University Hospital