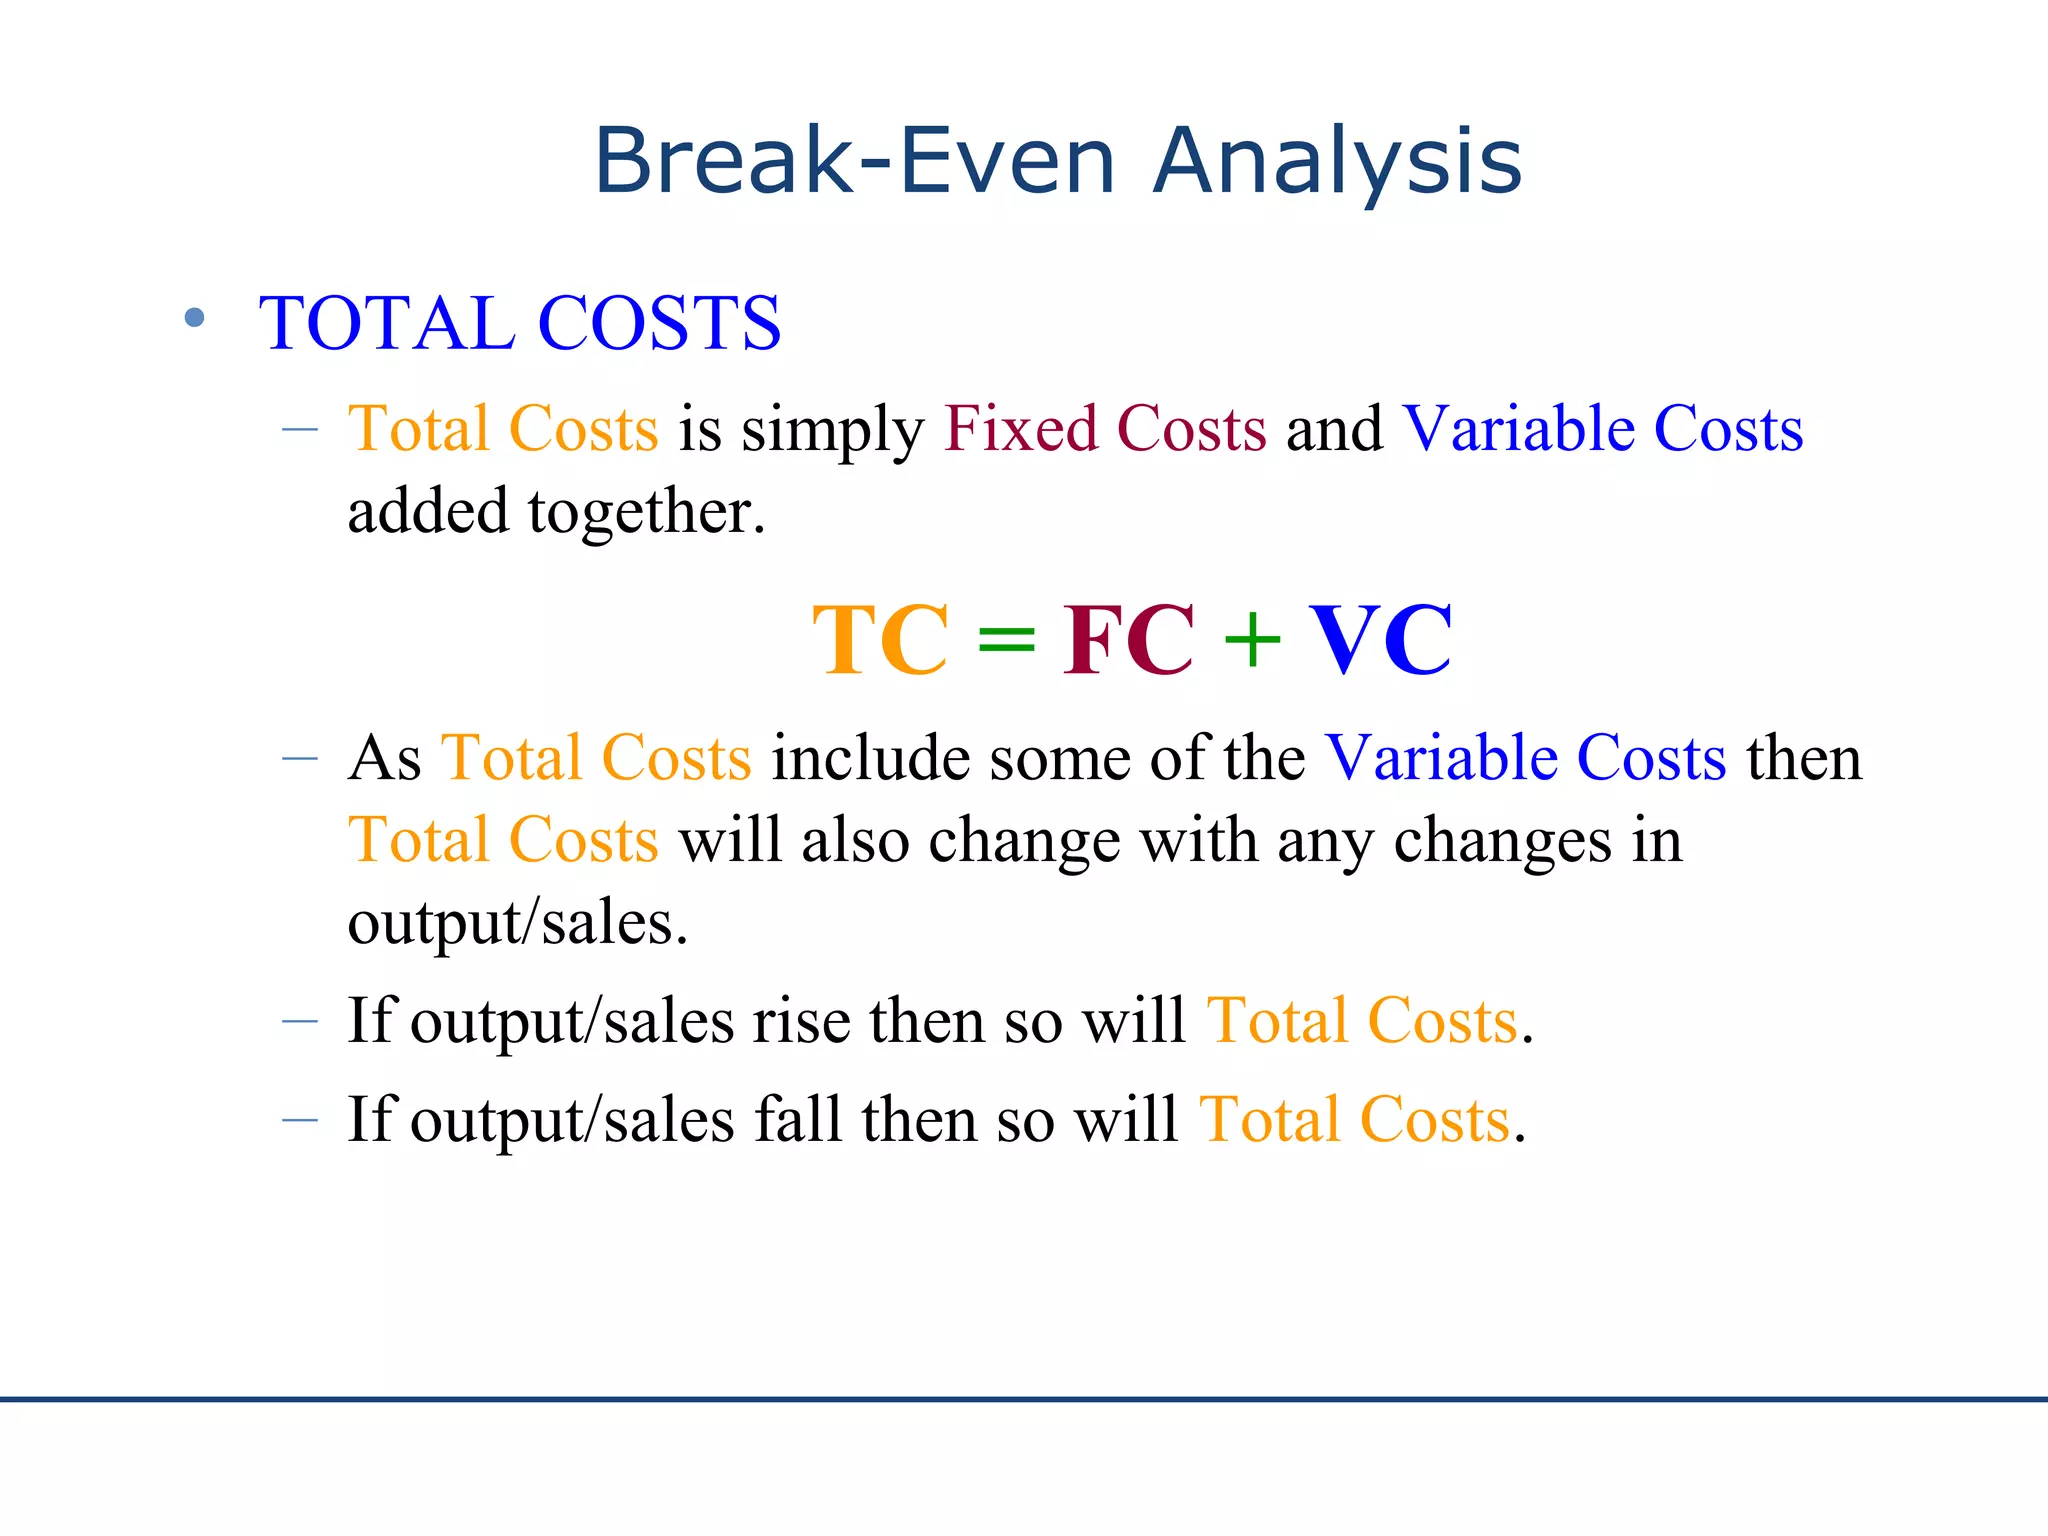
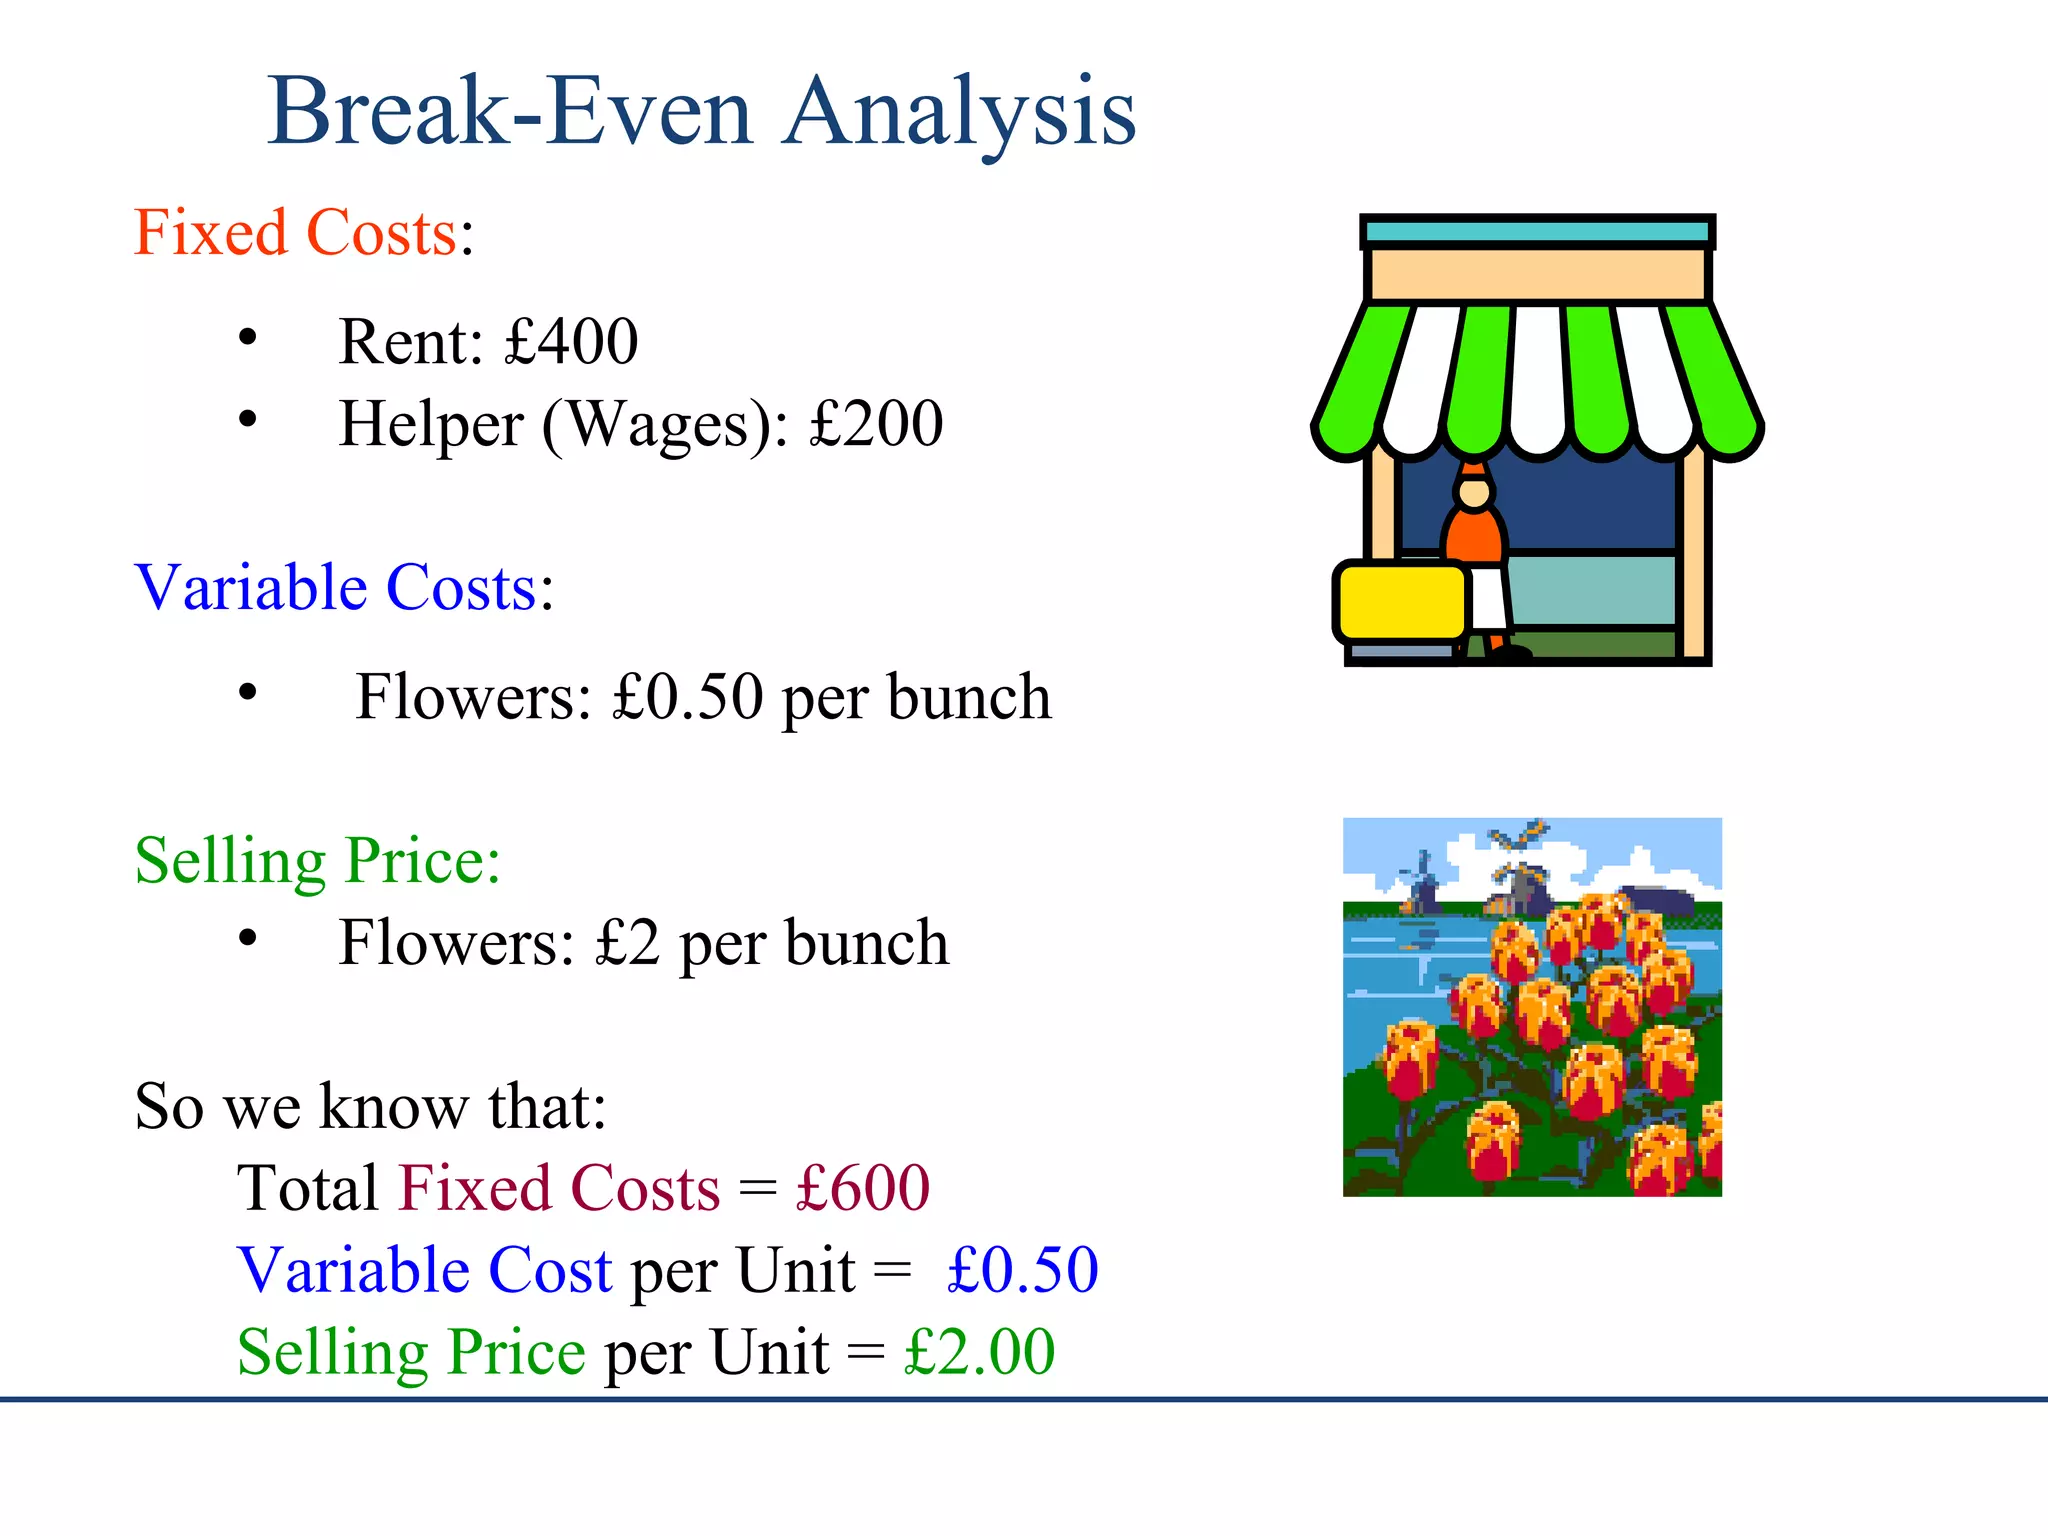
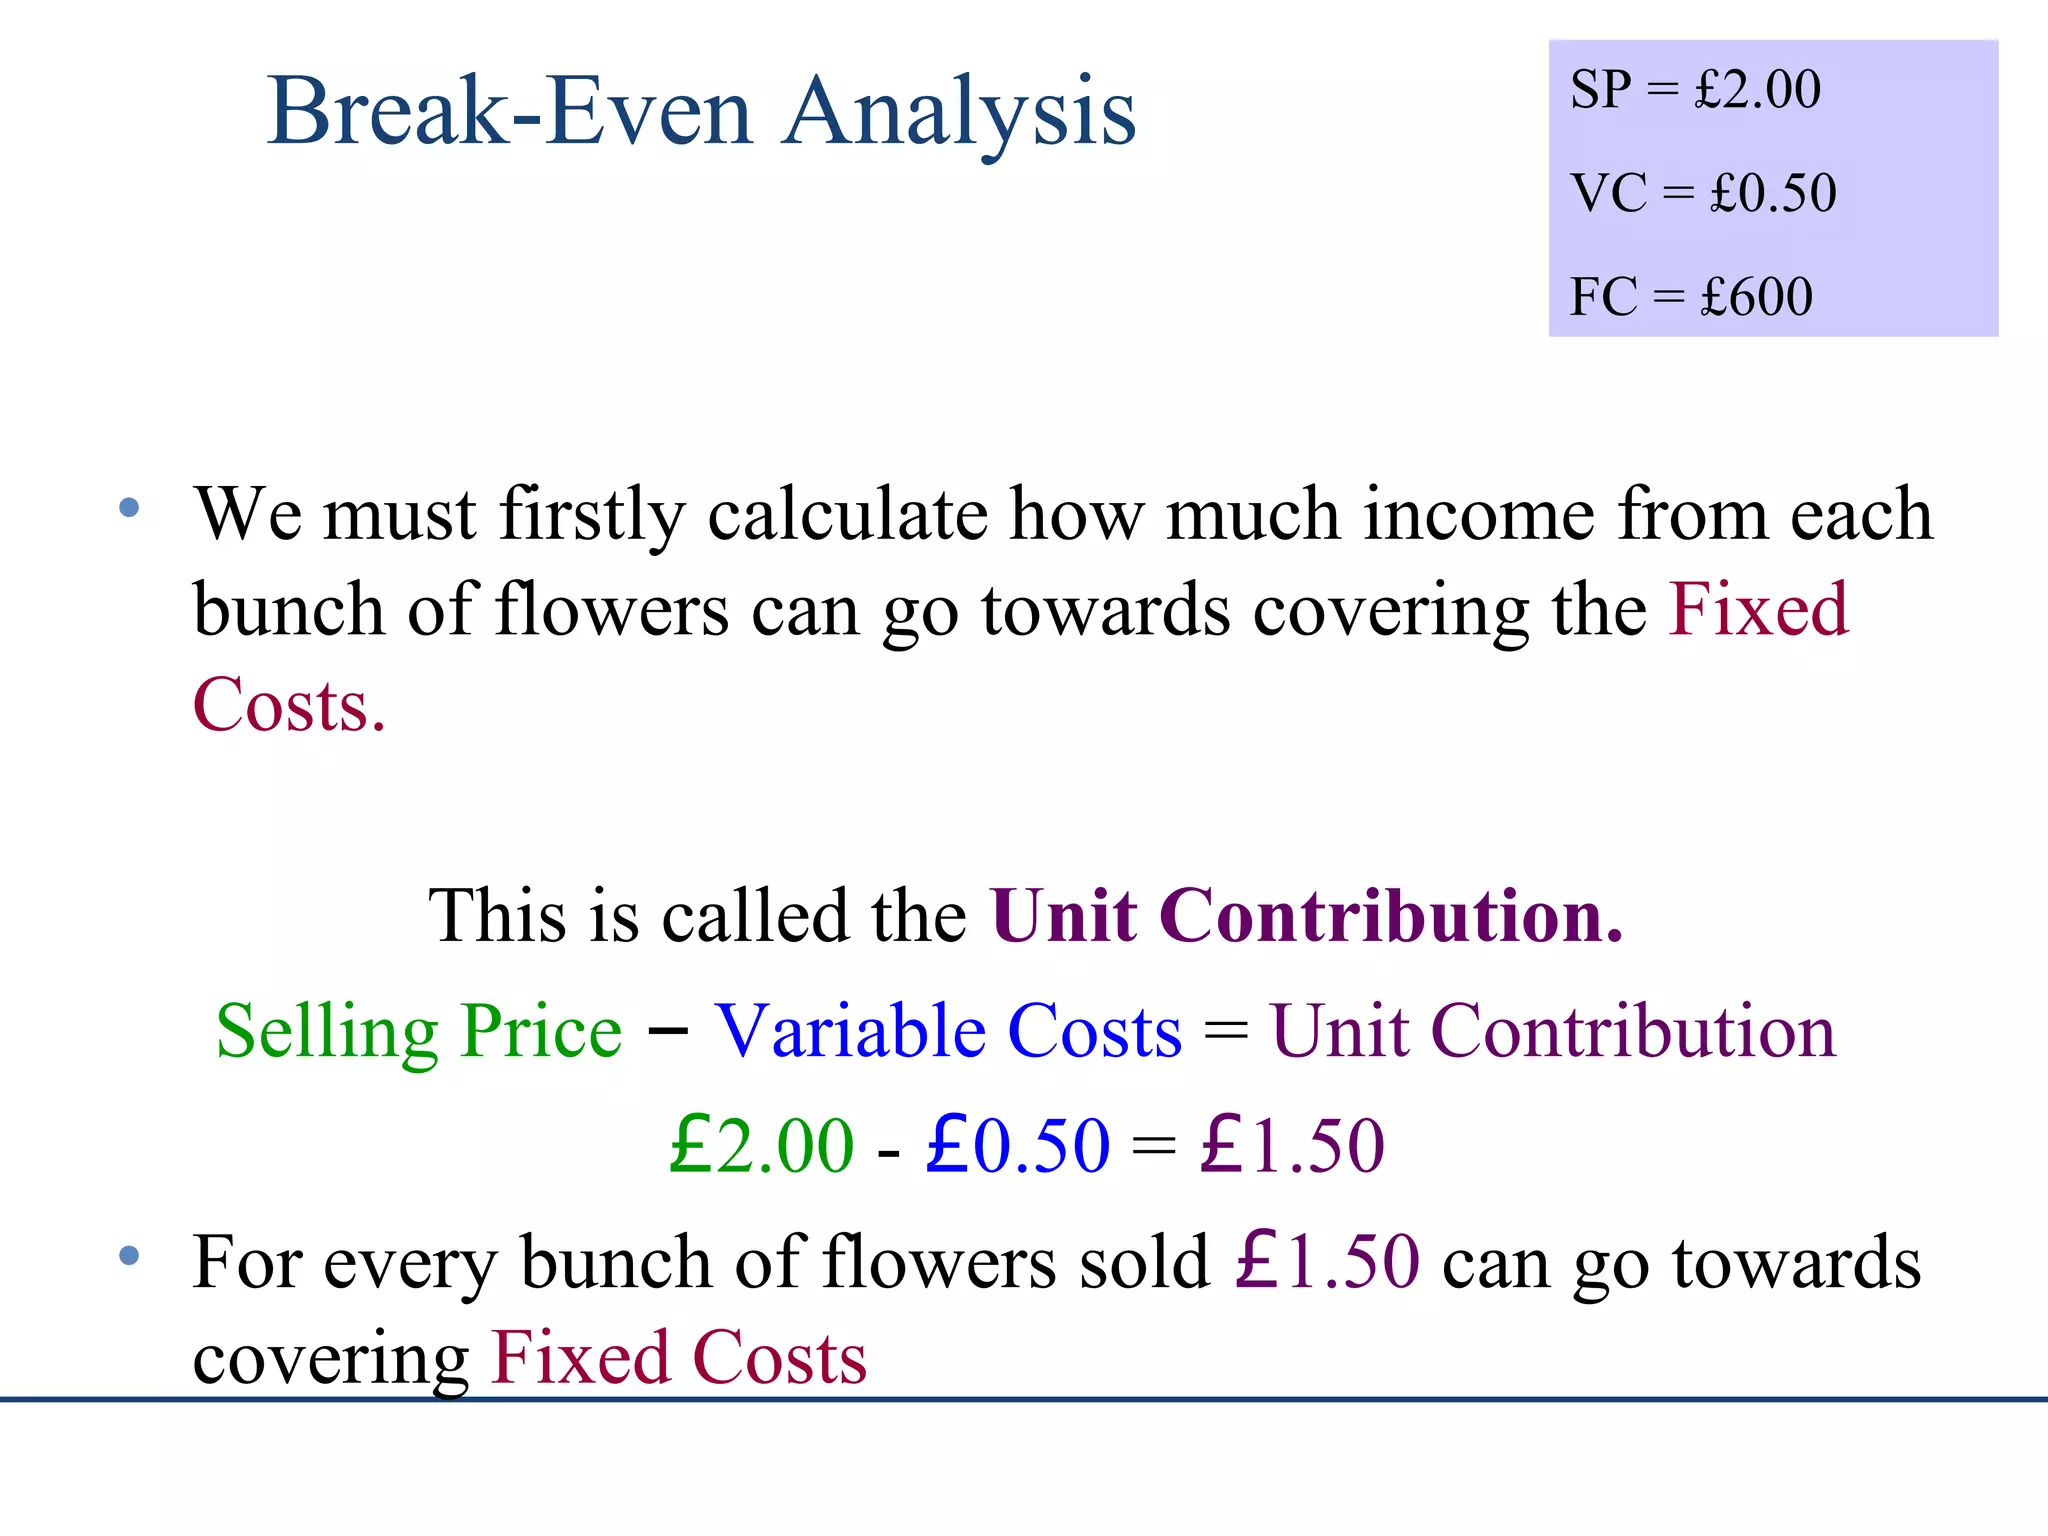
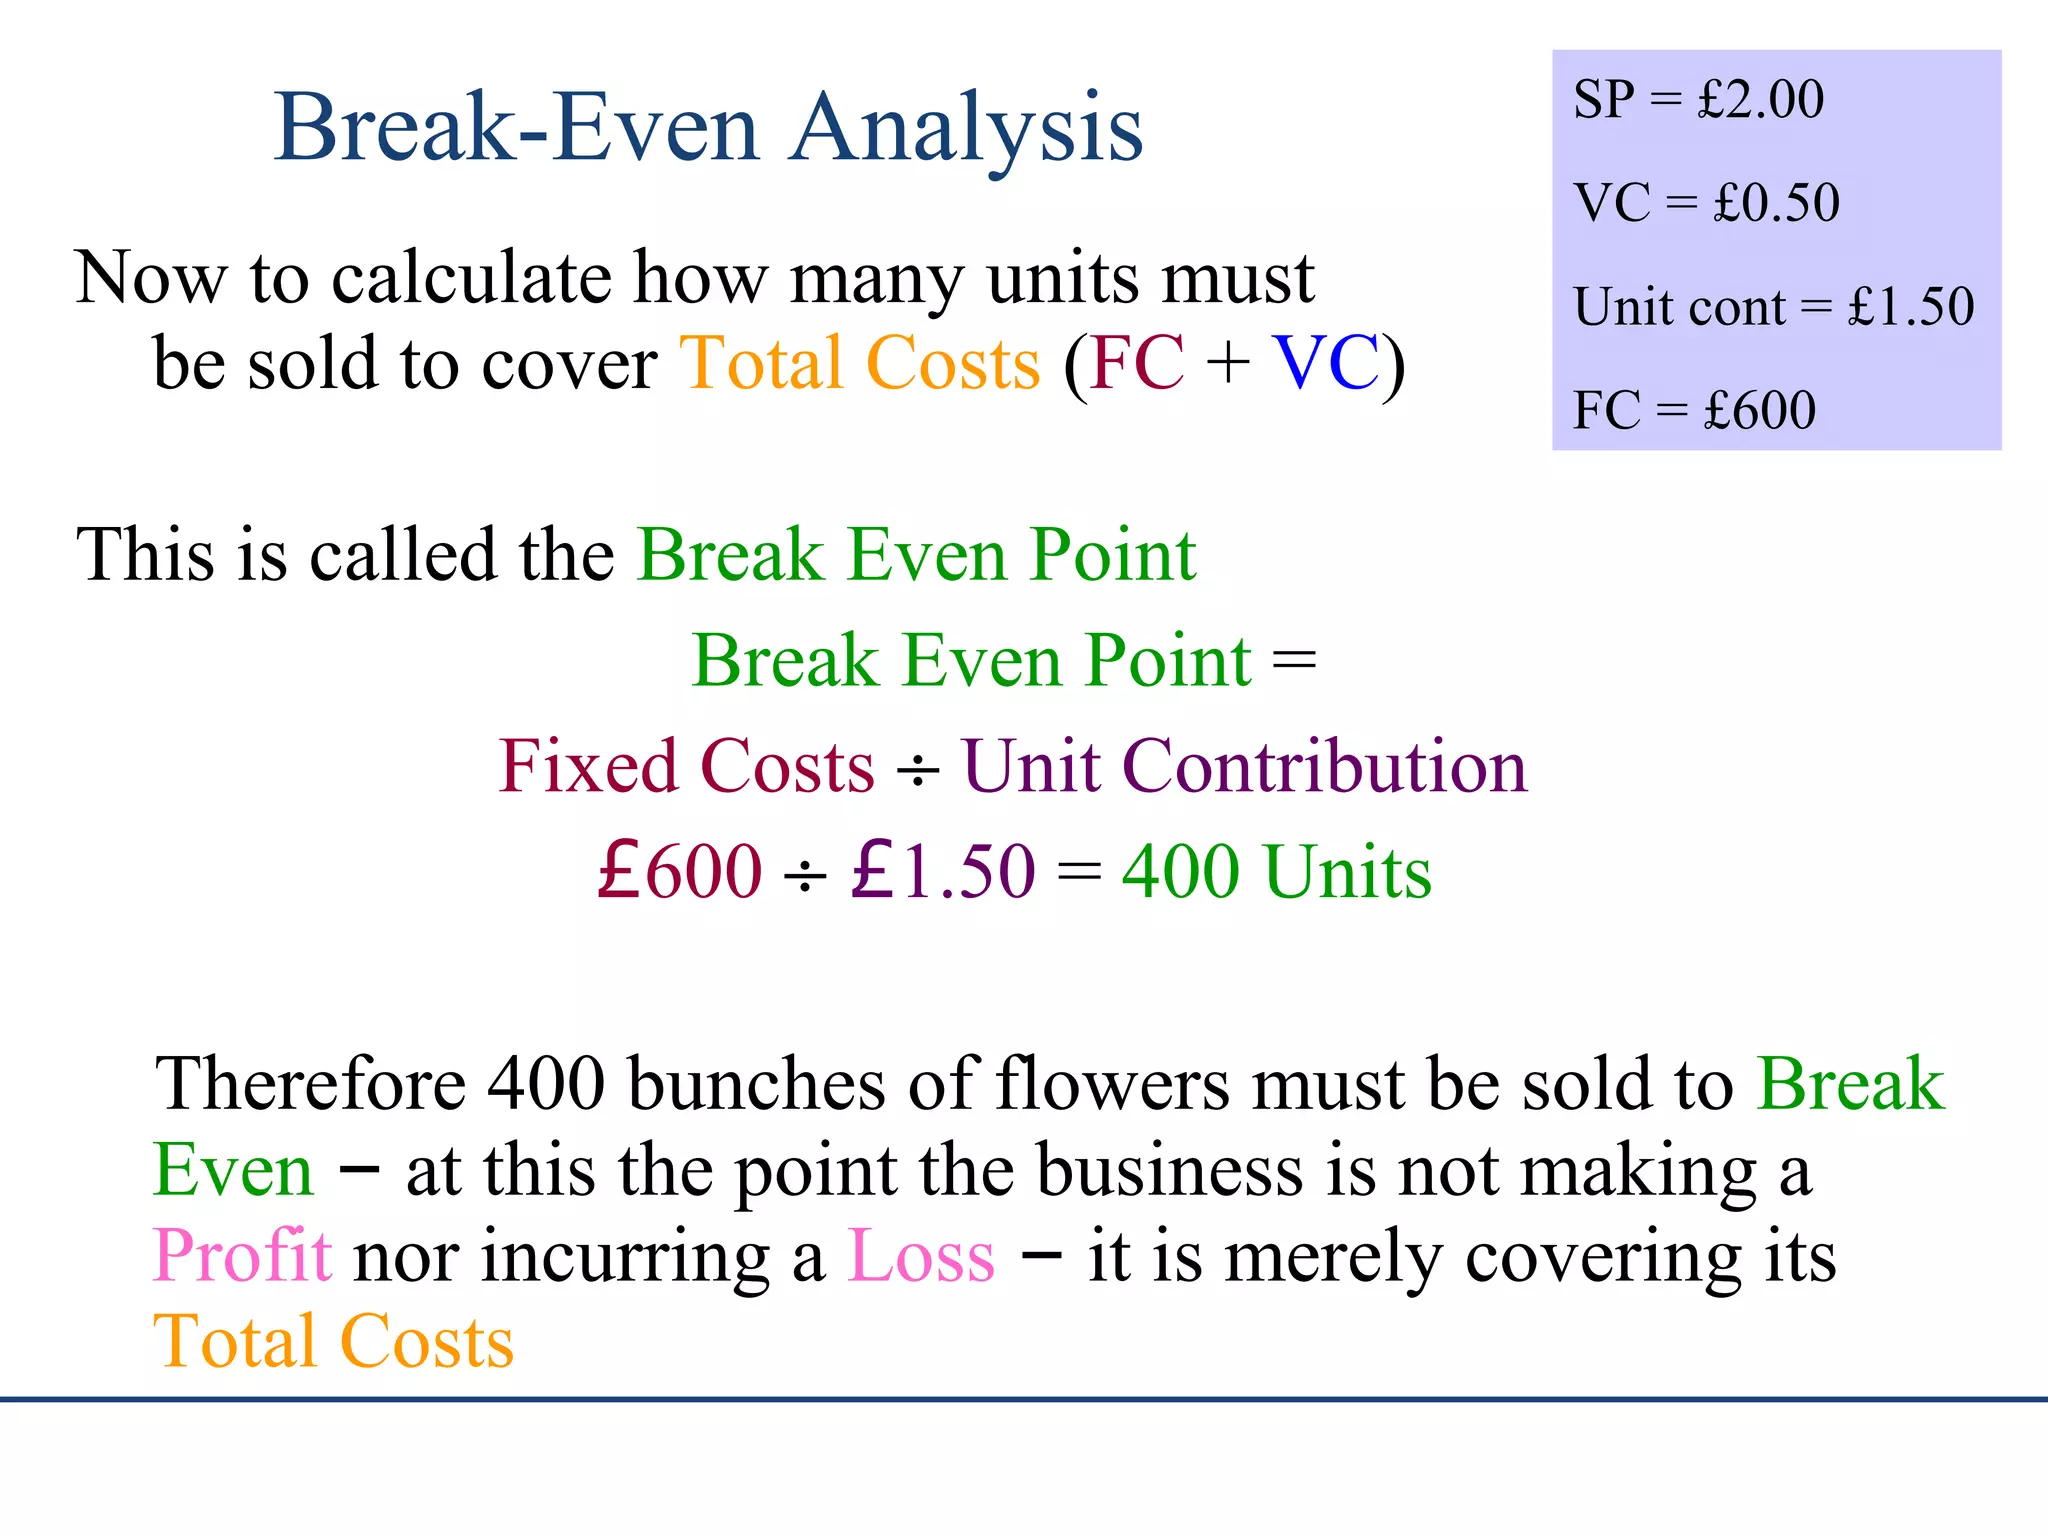
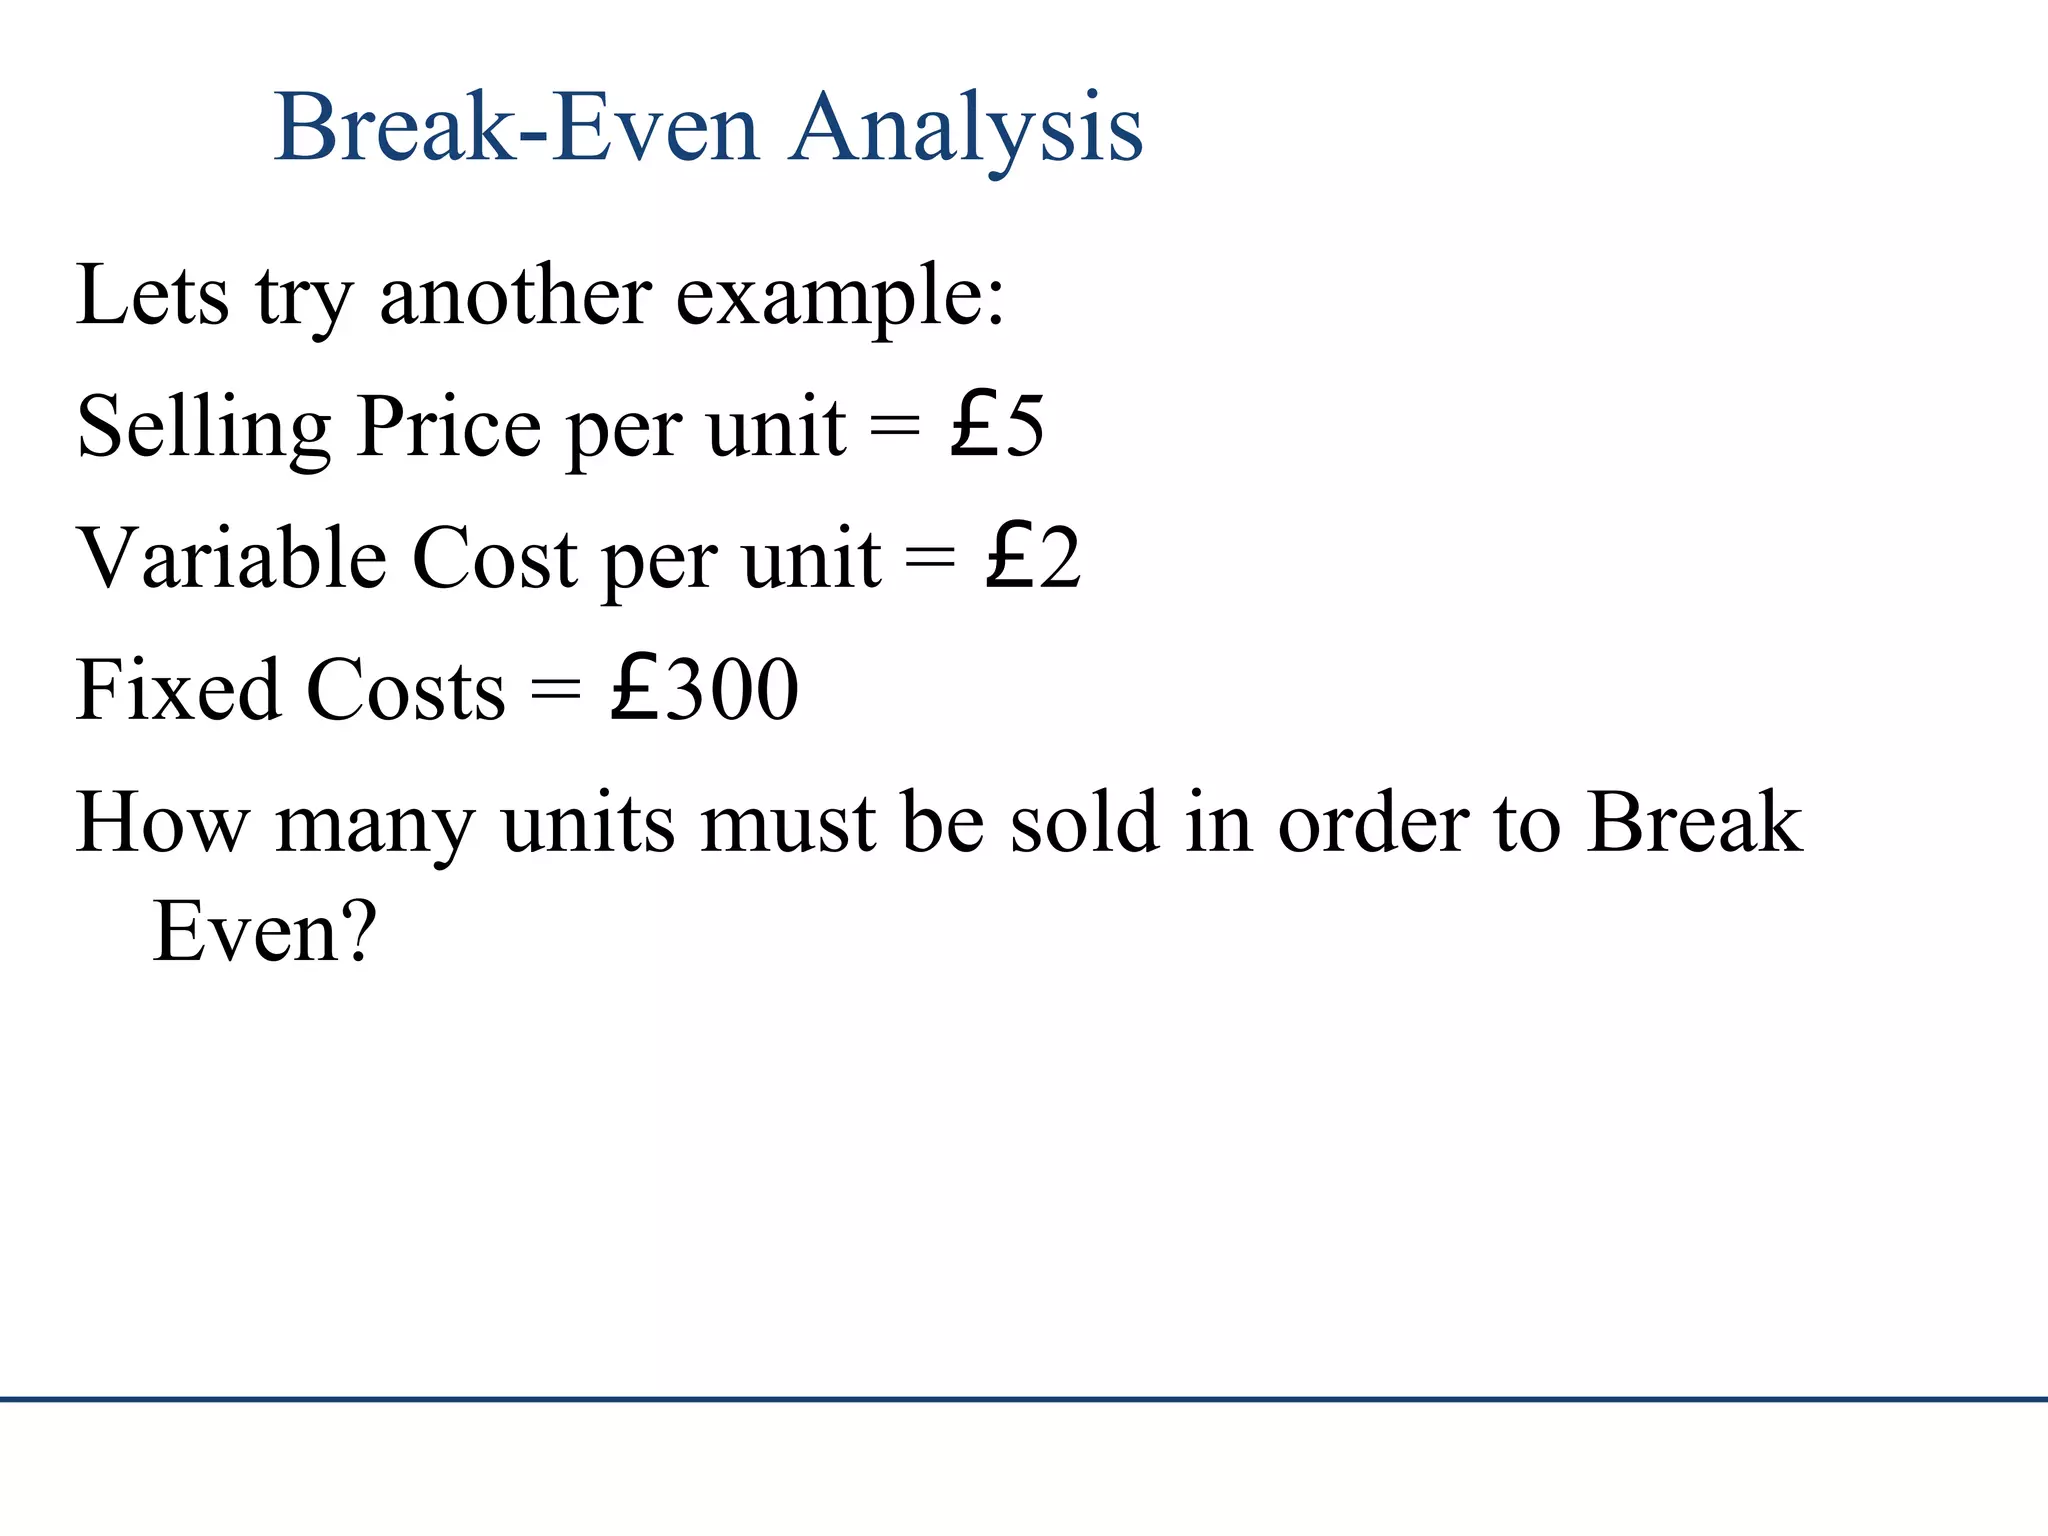
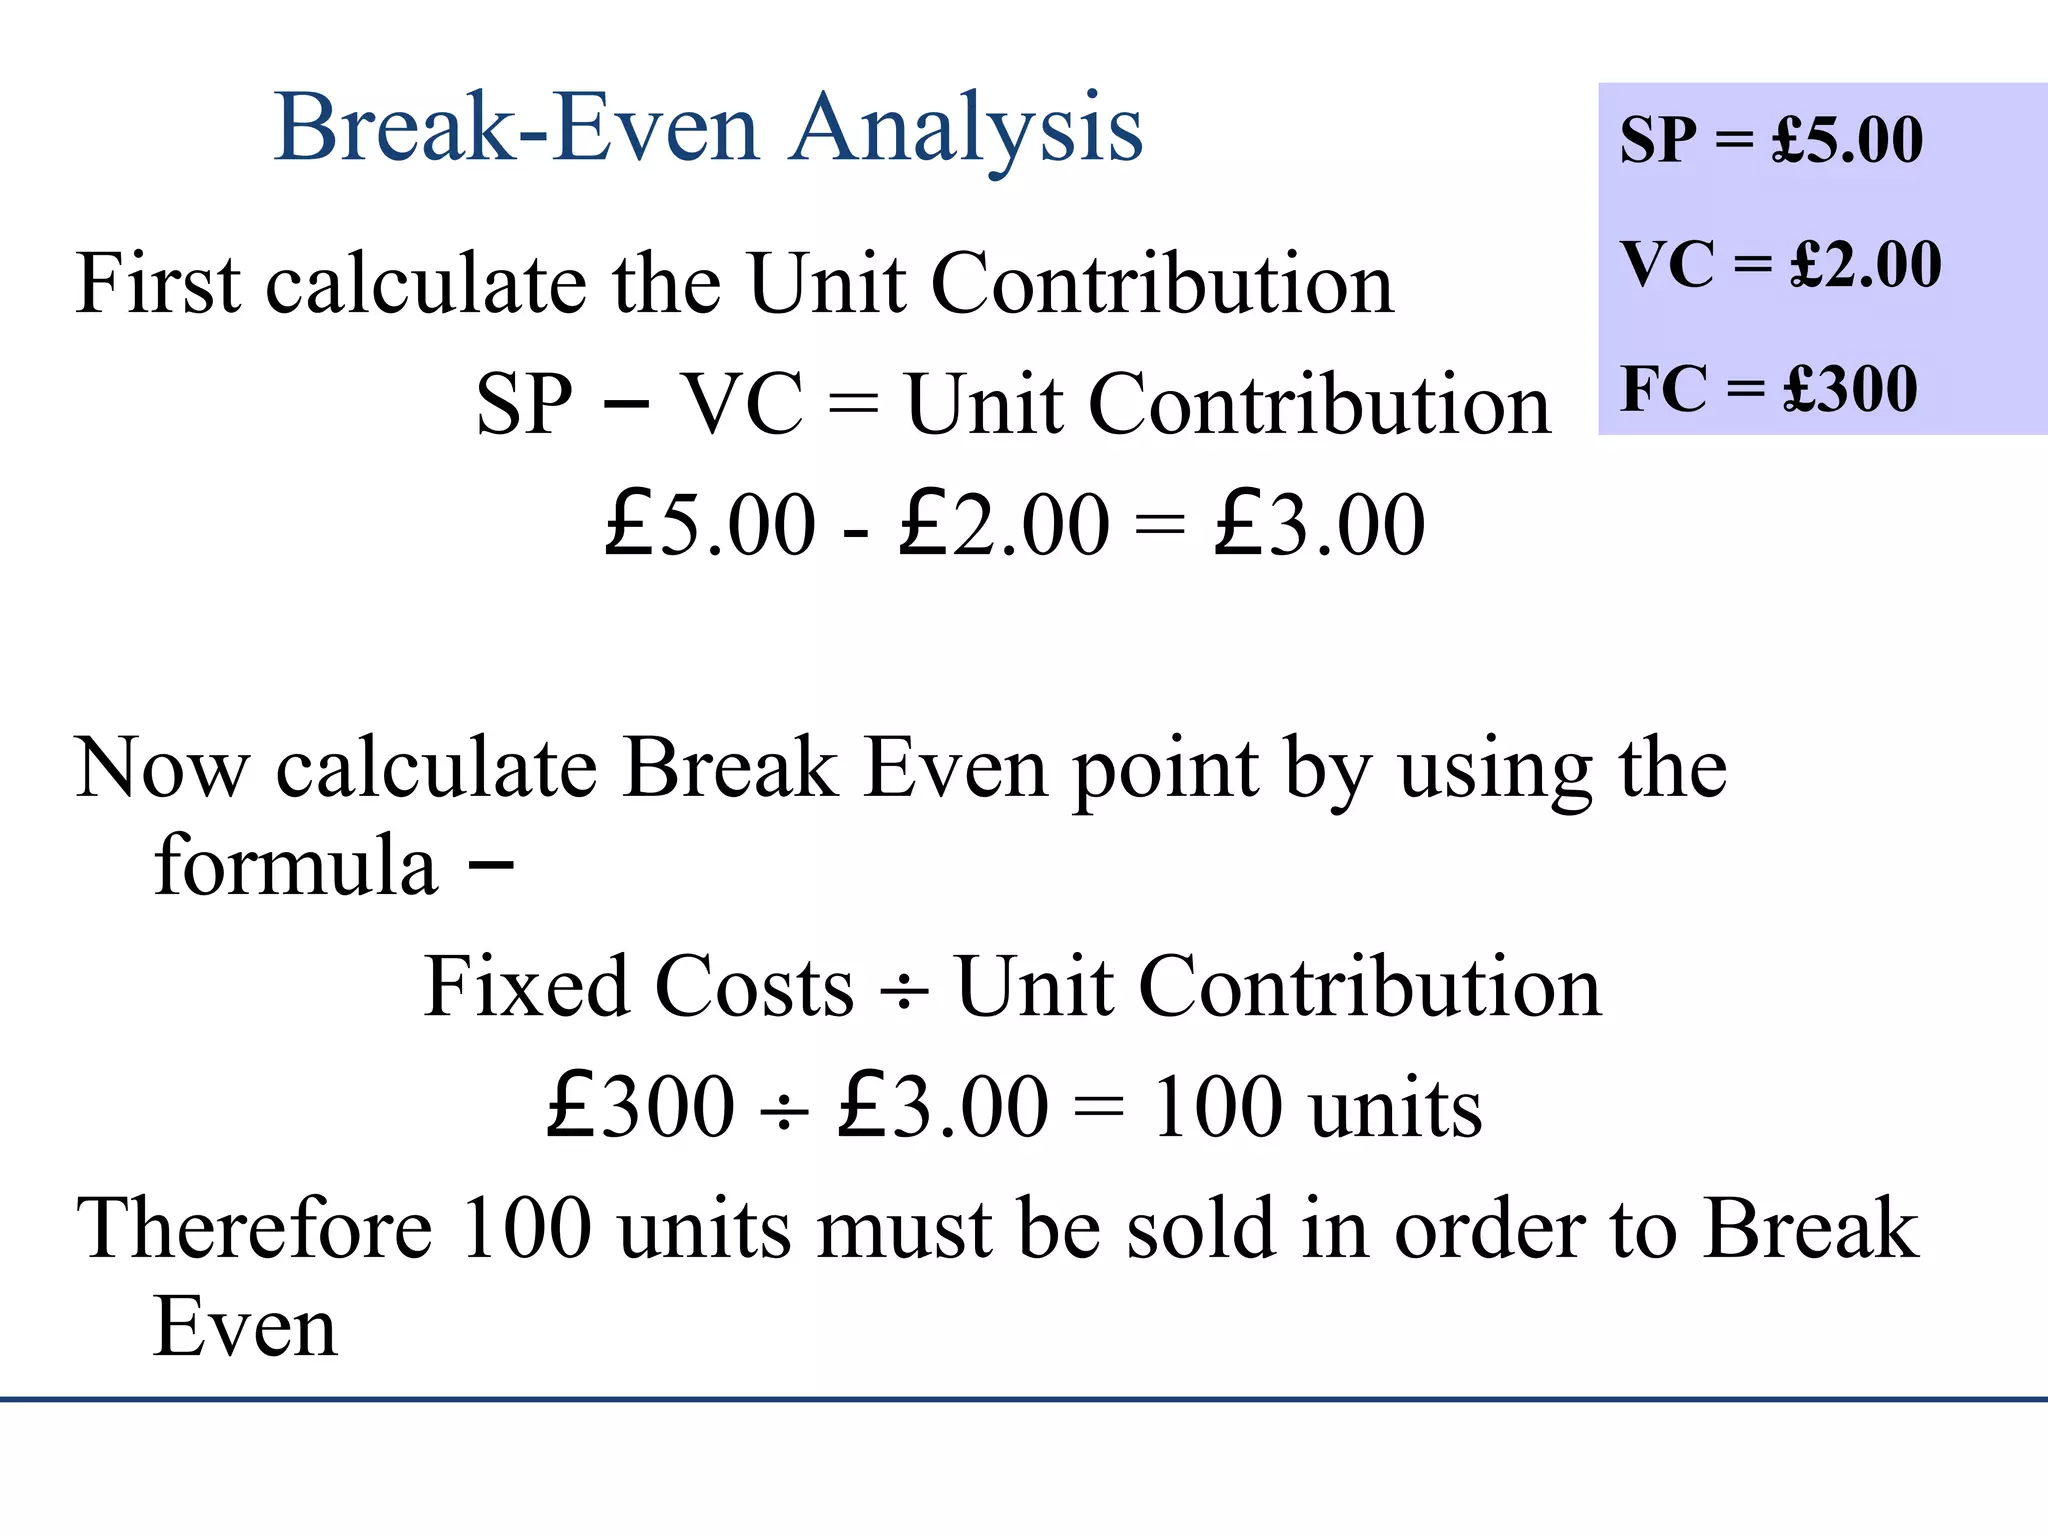
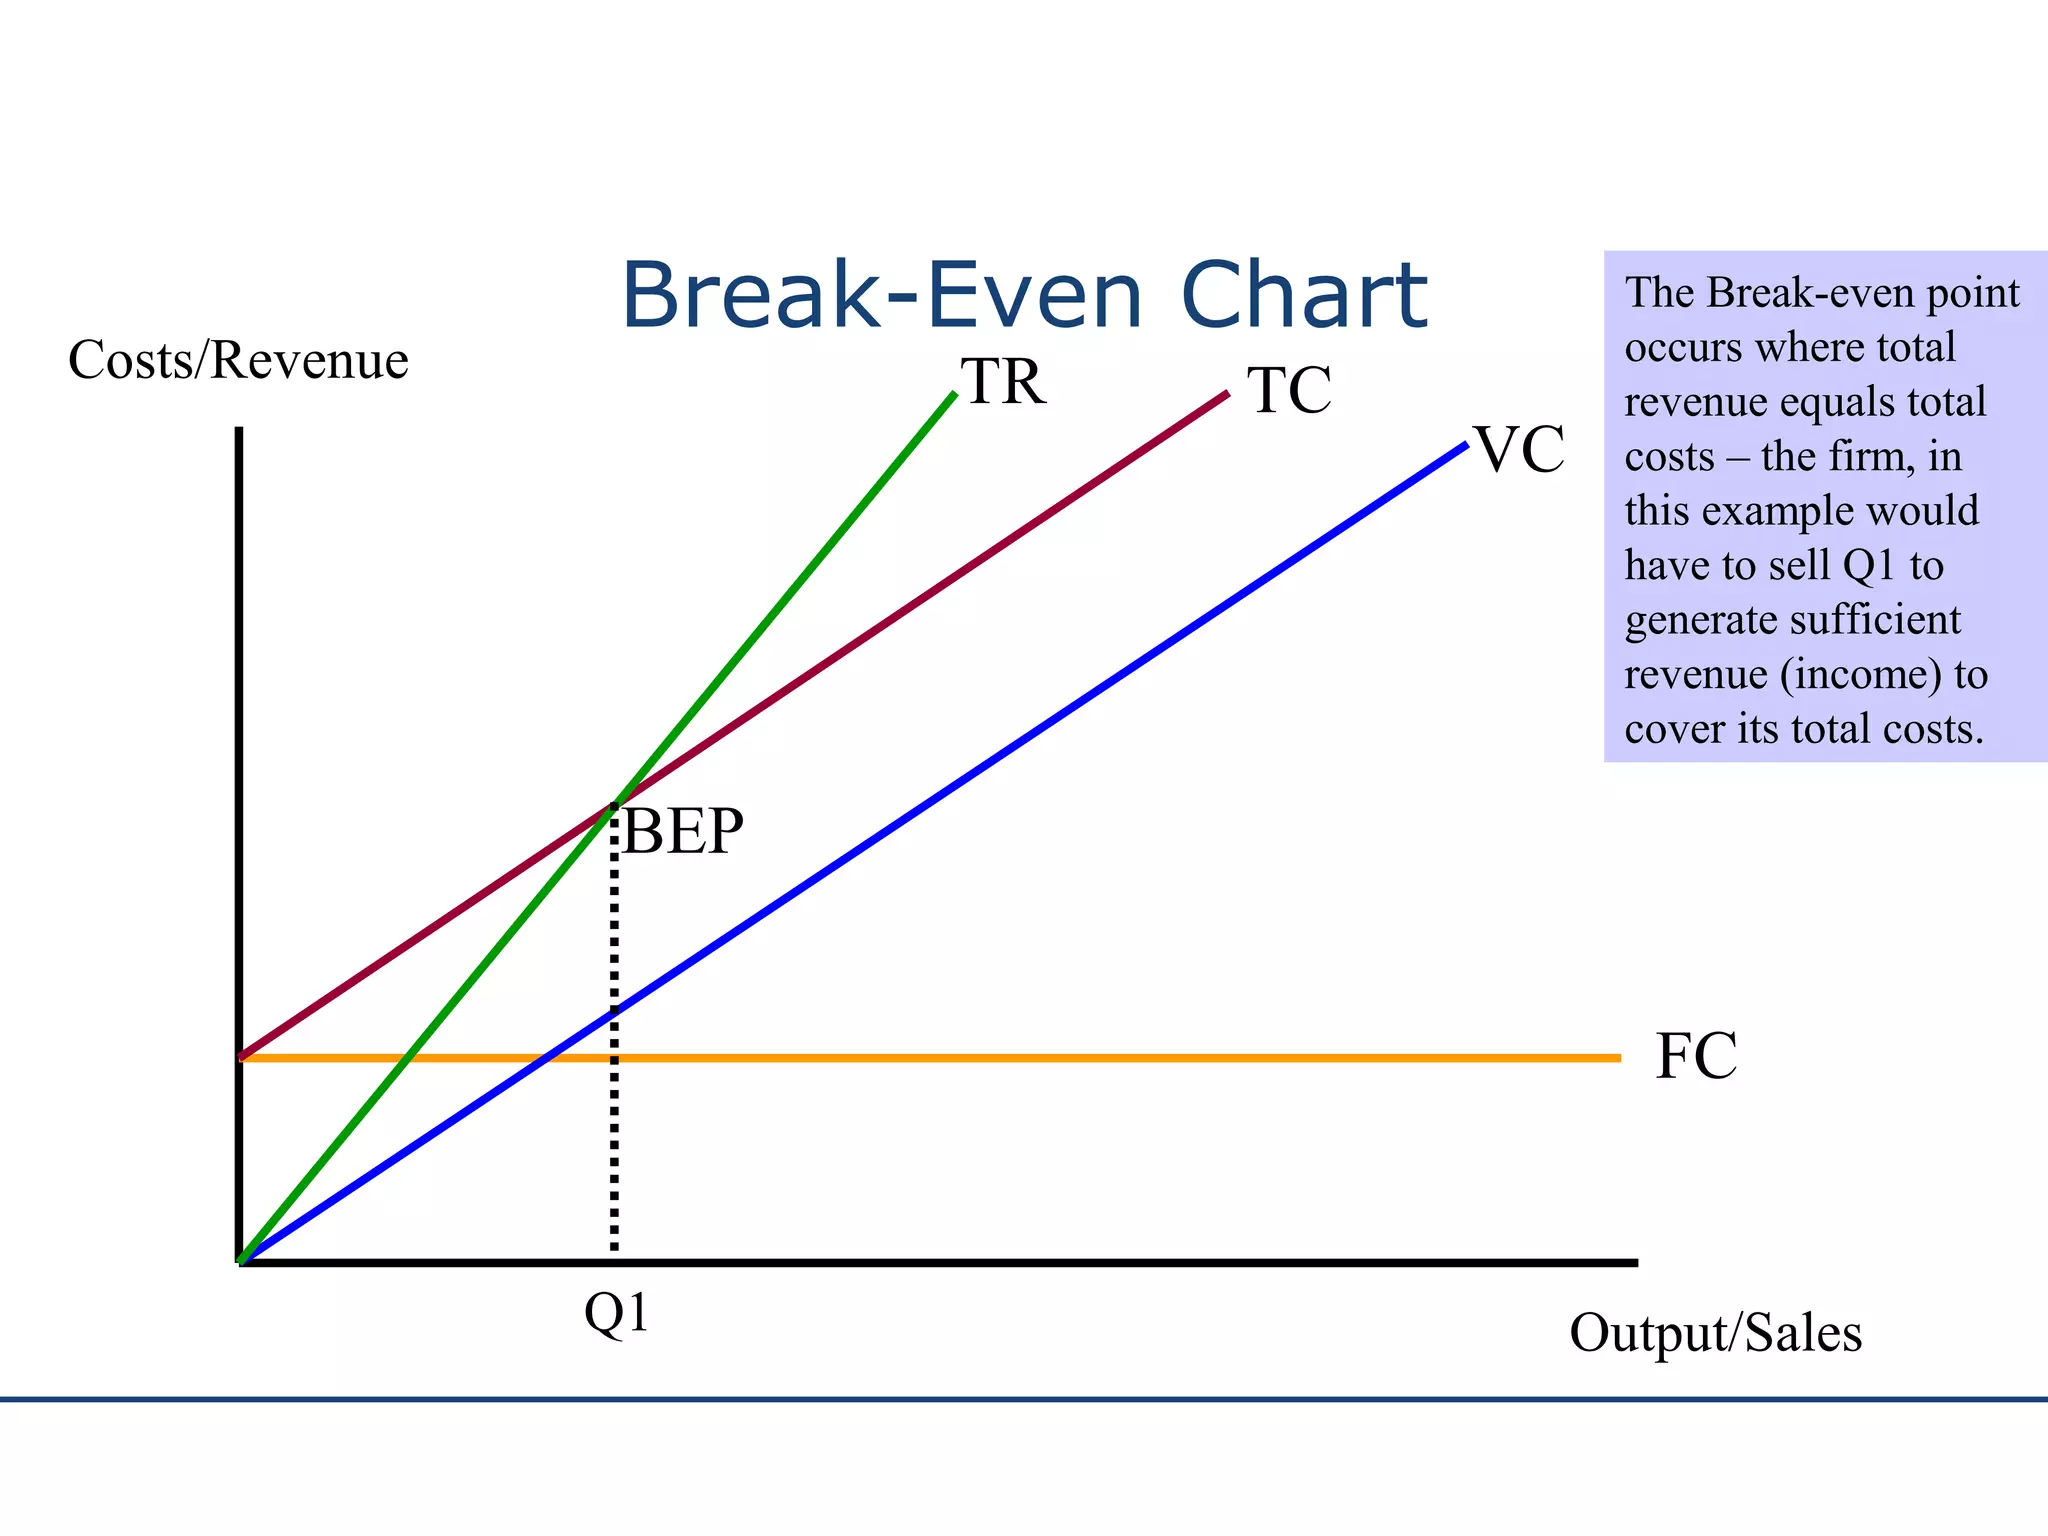
http://www.bized.ac.uk
• Break-Even Analysis is used to
– predict future profits/losses
– predict results eg produce Product A or Product
B
• Break-Even Point is when Sales Revenue
equals Total Costs
• at this point no profit or loss is incurred
• the firm merely covers its total costs
• Break-Even Point can be shown in graph
form or by use of formulae
Break-Even Analysis
http://www.bized.ac.uk
There are two basic types of costs a company incurs.
• Variable Costs
• Fixed Costs
Variable costs are costs that change with changes in production
levels or sales. Examples include: Costs of materials used in the
production of the goods.
Fixed costs remain roughly the same regardless of sales/output
levels. Examples include: Rent, Insurance and Wages
In order to calculate how profitable a product will be,
we must firstly look at the Costs involved -
Break-Even Analysis
http://www.bized.ac.uk
Break-Even Analysis
• TOTAL COSTS
– Total Costs is simply Fixed Costs and Variable Costs
added together.
TC = FC + VC
– As Total Costs include some of the Variable Costs then
Total Costs will also change with any changes in
output/sales.
– If output/sales rise then so will Total Costs.
– If output/sales fall then so will Total Costs.
http://www.bized.ac.uk
The Break-even point occurs when Total Costs equals
Revenue (Sales Income)
Revenues (Sales Income) = Total Costs
Break-Even Analysis
At this point the business is not making a Profit nor
incurring a Loss – it is merely covering its Total Costs
Let us have a look at a simple example.
Bannerman Trading Company
opens a flower shop.
http://www.bized.ac.uk
Fixed Costs:
• Rent: £400
• Helper (Wages): £200
Variable Costs:
• Flowers: £0.50 per bunch
Selling Price:
• Flowers: £2 per bunch
So we know that:
Total Fixed Costs = £600
Variable Cost per Unit = £0.50
Selling Price per Unit = £2.00
Break-Even Analysis
http://www.bized.ac.uk
• We must firstly calculate how much income from each
bunch of flowers can go towards covering the Fixed
Costs.
This is called the Unit Contribution.
Selling Price – Variable Costs = Unit Contribution
£2.00 - £0.50 = £1.50
• For every bunch of flowers sold £1.50 can go towards
covering Fixed Costs
Break-Even Analysis SP = £2.00
VC = £0.50
FC = £600
http://www.bized.ac.uk
Now to calculate how many units must
be sold to cover Total Costs (FC + VC)
This is called the Break Even Point
Break Even Point =
Fixed Costs ÷ Unit Contribution
£600 ÷ £1.50 = 400 Units
Therefore 400 bunches of flowers must be sold to Break
Even – at this the point the business is not making a
Profit nor incurring a Loss – it is merely covering its
Total Costs
Break-Even Analysis SP = £2.00
VC = £0.50
Unit cont = £1.50
FC = £600
http://www.bized.ac.uk
Lets try another example:
Selling Price per unit = £5
Variable Cost per unit = £2
Fixed Costs = £300
How many units must be sold in order to Break
Even?
Break-Even Analysis
http://www.bized.ac.uk
First calculate the Unit Contribution
SP – VC = Unit Contribution
£5.00 - £2.00 = £3.00
Now calculate Break Even point by using the
formula –
Fixed Costs ÷ Unit Contribution
£300 ÷ £3.00 = 100 units
Therefore 100 units must be sold in order to Break
Even
Break-Even Analysis SP = £5.00
VC = £2.00
FC = £300
http://www.bized.ac.uk
Break-Even Chart
Costs/Revenue
Output/Sales
FC
VC
TCTR
The Break-even point
occurs where total
revenue equals total
costs – the firm, in
this example would
have to sell Q1 to
generate sufficient
revenue (income) to
cover its total costs.
Q1
BEP
http://www.bized.ac.uk
Assumptions of Break Even
Analysis
• All Fixed and Variable costs can be
identified
• Variable costs are assumed to vary
directly with output
• Fixed costs will remain constant
• Selling prices are assumed to remain
constant for all levels of output
http://www.bized.ac.uk
Assumptions Continued
• The sales mix of products will remain
constant – break even charts cannot
handle multi-product situations
• It is assumed that all production will be
sold
• The volume of activity is the only
relevant factor which will affect costs
http://www.bized.ac.ukLimitations of Break Even
Analysis
• Some costs cannot be identified as precisely
Fixed or Variable
• Semi-variable costs cannot be easily
accommodated in break-even analysis
• Costs and revenues tend not to be constant
• With Fixed costs the assumption that they
are constant over the whole range of output
from zero to maximum capacity is unrealistic
http://www.bized.ac.uk
Limitations Continued
• Price reduction may be necessary to
protect sales in the face of increased
competition
• The sales mix may change with changes
in tastes and fashions
• Productivity may be affected by strikes
and absenteeism
• The balance between Fixed and Variable
costs may be altered by new technology

Break Even Charts Simplified

  • 1.
    http://www.bized.ac.uk • Break-Even Analysisis used to – predict future profits/losses – predict results eg produce Product A or Product B • Break-Even Point is when Sales Revenue equals Total Costs • at this point no profit or loss is incurred • the firm merely covers its total costs • Break-Even Point can be shown in graph form or by use of formulae Break-Even Analysis
  • 2.
    http://www.bized.ac.uk There are twobasic types of costs a company incurs. • Variable Costs • Fixed Costs Variable costs are costs that change with changes in production levels or sales. Examples include: Costs of materials used in the production of the goods. Fixed costs remain roughly the same regardless of sales/output levels. Examples include: Rent, Insurance and Wages In order to calculate how profitable a product will be, we must firstly look at the Costs involved - Break-Even Analysis
  • 3.
    http://www.bized.ac.uk Break-Even Analysis • TOTALCOSTS – Total Costs is simply Fixed Costs and Variable Costs added together. TC = FC + VC – As Total Costs include some of the Variable Costs then Total Costs will also change with any changes in output/sales. – If output/sales rise then so will Total Costs. – If output/sales fall then so will Total Costs.
  • 4.
    http://www.bized.ac.uk The Break-even pointoccurs when Total Costs equals Revenue (Sales Income) Revenues (Sales Income) = Total Costs Break-Even Analysis At this point the business is not making a Profit nor incurring a Loss – it is merely covering its Total Costs Let us have a look at a simple example. Bannerman Trading Company opens a flower shop.
  • 5.
    http://www.bized.ac.uk Fixed Costs: • Rent:£400 • Helper (Wages): £200 Variable Costs: • Flowers: £0.50 per bunch Selling Price: • Flowers: £2 per bunch So we know that: Total Fixed Costs = £600 Variable Cost per Unit = £0.50 Selling Price per Unit = £2.00 Break-Even Analysis
  • 6.
    http://www.bized.ac.uk • We mustfirstly calculate how much income from each bunch of flowers can go towards covering the Fixed Costs. This is called the Unit Contribution. Selling Price – Variable Costs = Unit Contribution £2.00 - £0.50 = £1.50 • For every bunch of flowers sold £1.50 can go towards covering Fixed Costs Break-Even Analysis SP = £2.00 VC = £0.50 FC = £600
  • 7.
    http://www.bized.ac.uk Now to calculatehow many units must be sold to cover Total Costs (FC + VC) This is called the Break Even Point Break Even Point = Fixed Costs ÷ Unit Contribution £600 ÷ £1.50 = 400 Units Therefore 400 bunches of flowers must be sold to Break Even – at this the point the business is not making a Profit nor incurring a Loss – it is merely covering its Total Costs Break-Even Analysis SP = £2.00 VC = £0.50 Unit cont = £1.50 FC = £600
  • 8.
    http://www.bized.ac.uk Lets try anotherexample: Selling Price per unit = £5 Variable Cost per unit = £2 Fixed Costs = £300 How many units must be sold in order to Break Even? Break-Even Analysis
  • 9.
    http://www.bized.ac.uk First calculate theUnit Contribution SP – VC = Unit Contribution £5.00 - £2.00 = £3.00 Now calculate Break Even point by using the formula – Fixed Costs ÷ Unit Contribution £300 ÷ £3.00 = 100 units Therefore 100 units must be sold in order to Break Even Break-Even Analysis SP = £5.00 VC = £2.00 FC = £300
  • 10.
    http://www.bized.ac.uk Break-Even Chart Costs/Revenue Output/Sales FC VC TCTR The Break-evenpoint occurs where total revenue equals total costs – the firm, in this example would have to sell Q1 to generate sufficient revenue (income) to cover its total costs. Q1 BEP
  • 11.
    http://www.bized.ac.uk Assumptions of BreakEven Analysis • All Fixed and Variable costs can be identified • Variable costs are assumed to vary directly with output • Fixed costs will remain constant • Selling prices are assumed to remain constant for all levels of output
  • 12.
    http://www.bized.ac.uk Assumptions Continued • Thesales mix of products will remain constant – break even charts cannot handle multi-product situations • It is assumed that all production will be sold • The volume of activity is the only relevant factor which will affect costs
  • 13.
    http://www.bized.ac.ukLimitations of BreakEven Analysis • Some costs cannot be identified as precisely Fixed or Variable • Semi-variable costs cannot be easily accommodated in break-even analysis • Costs and revenues tend not to be constant • With Fixed costs the assumption that they are constant over the whole range of output from zero to maximum capacity is unrealistic
  • 14.
    http://www.bized.ac.uk Limitations Continued • Pricereduction may be necessary to protect sales in the face of increased competition • The sales mix may change with changes in tastes and fashions • Productivity may be affected by strikes and absenteeism • The balance between Fixed and Variable costs may be altered by new technology