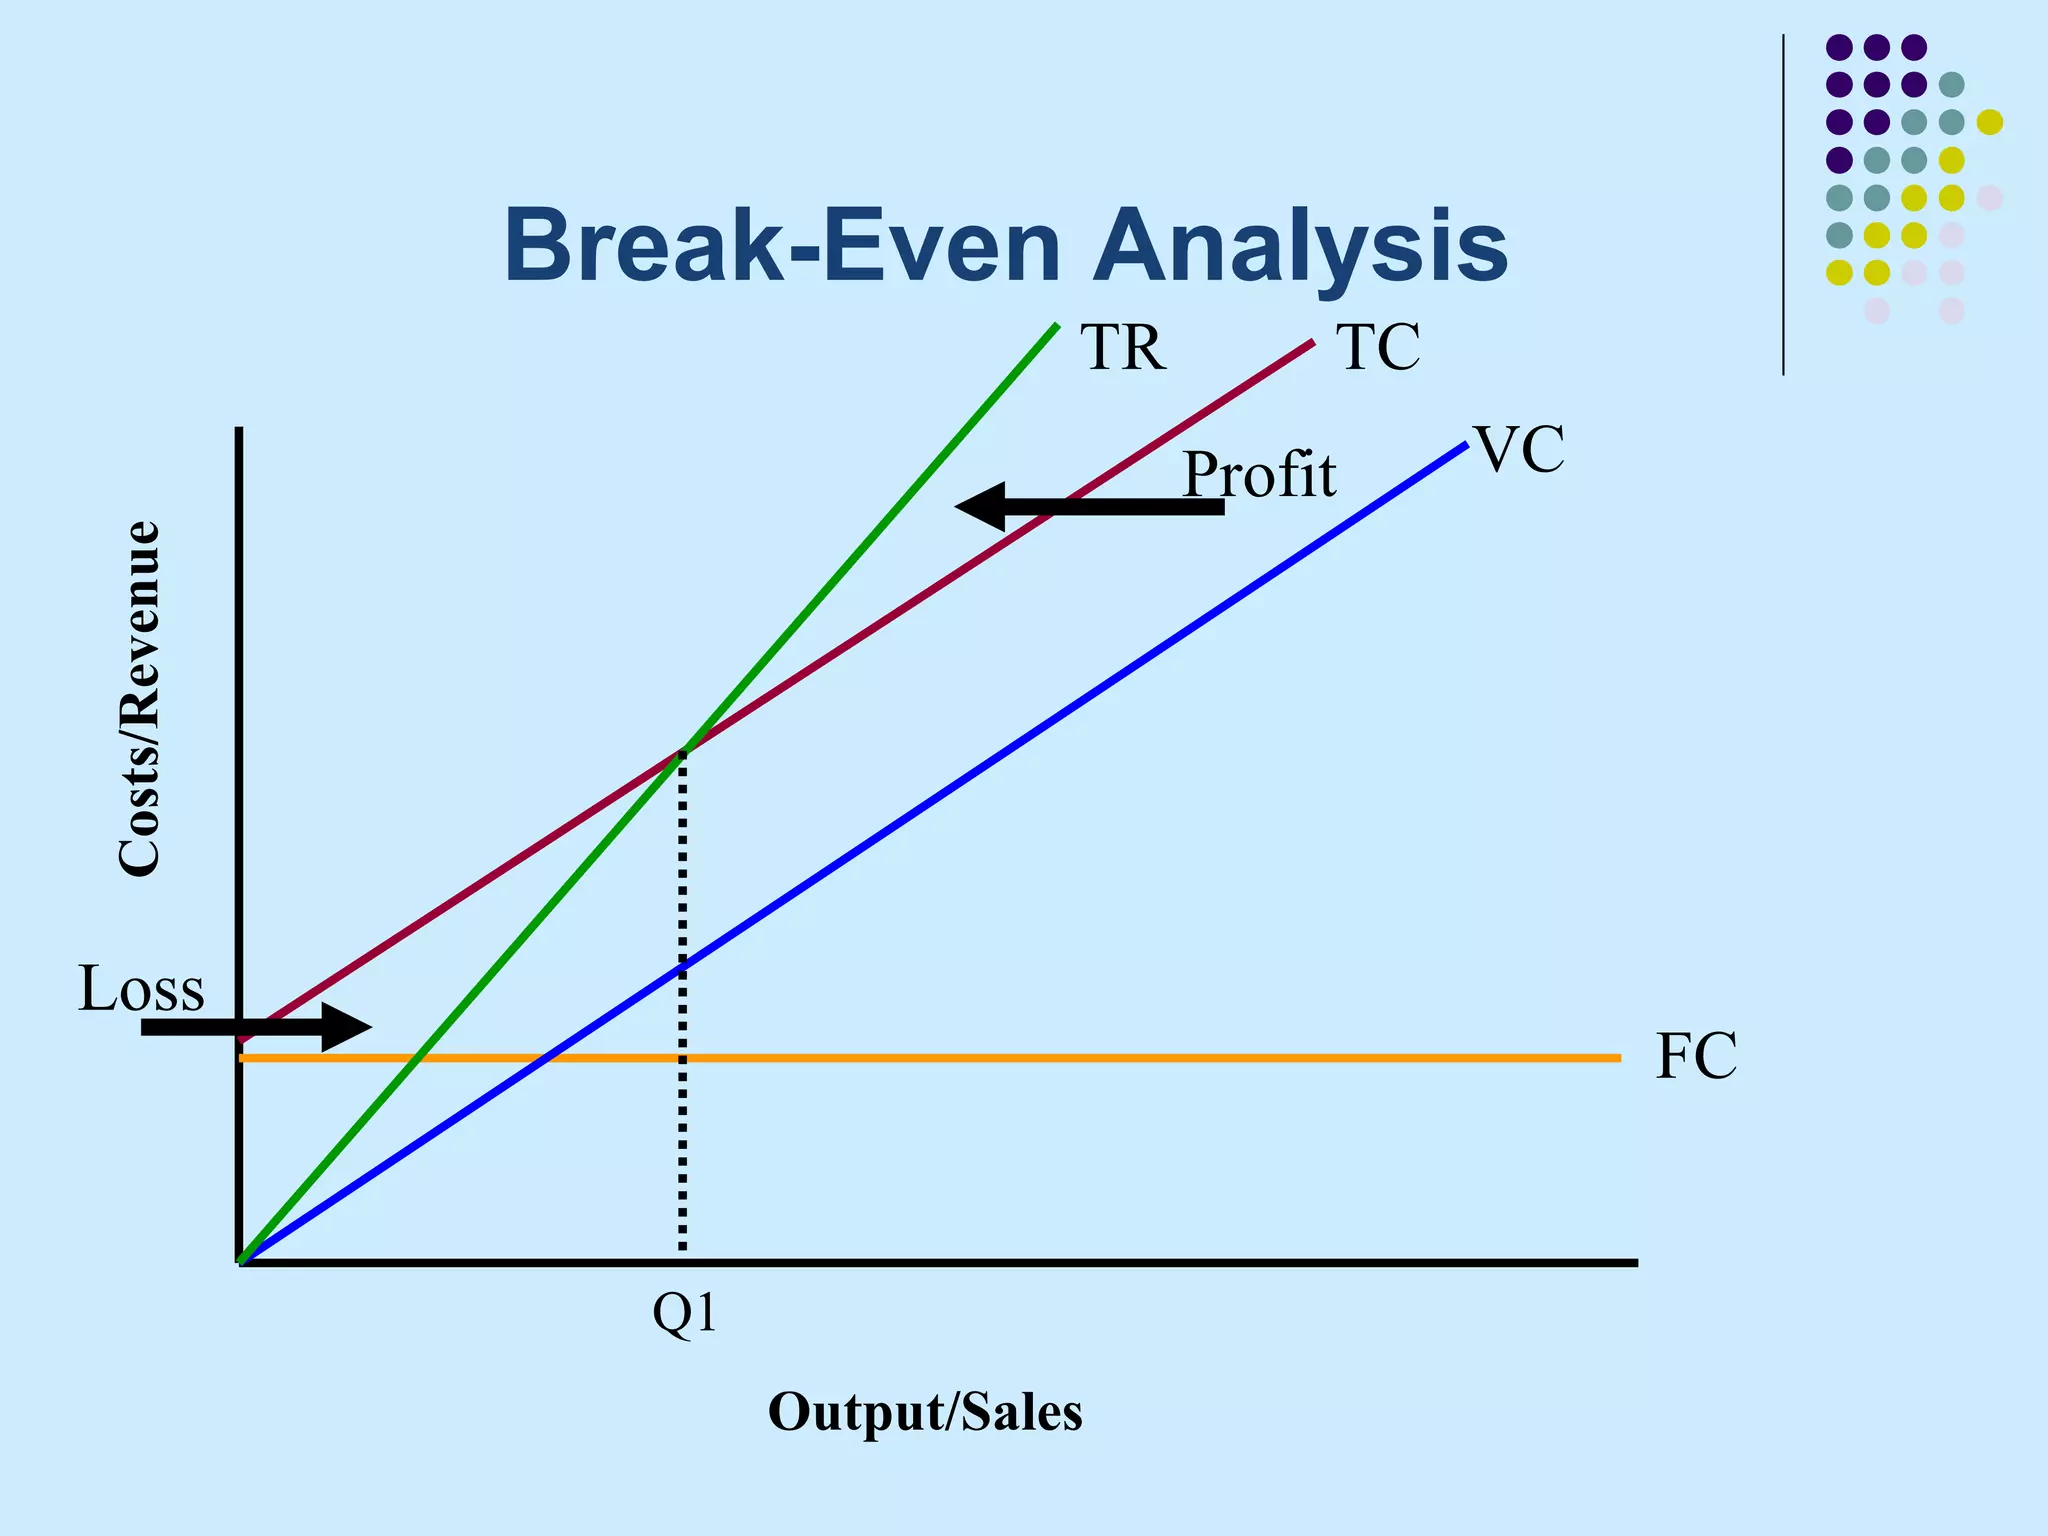
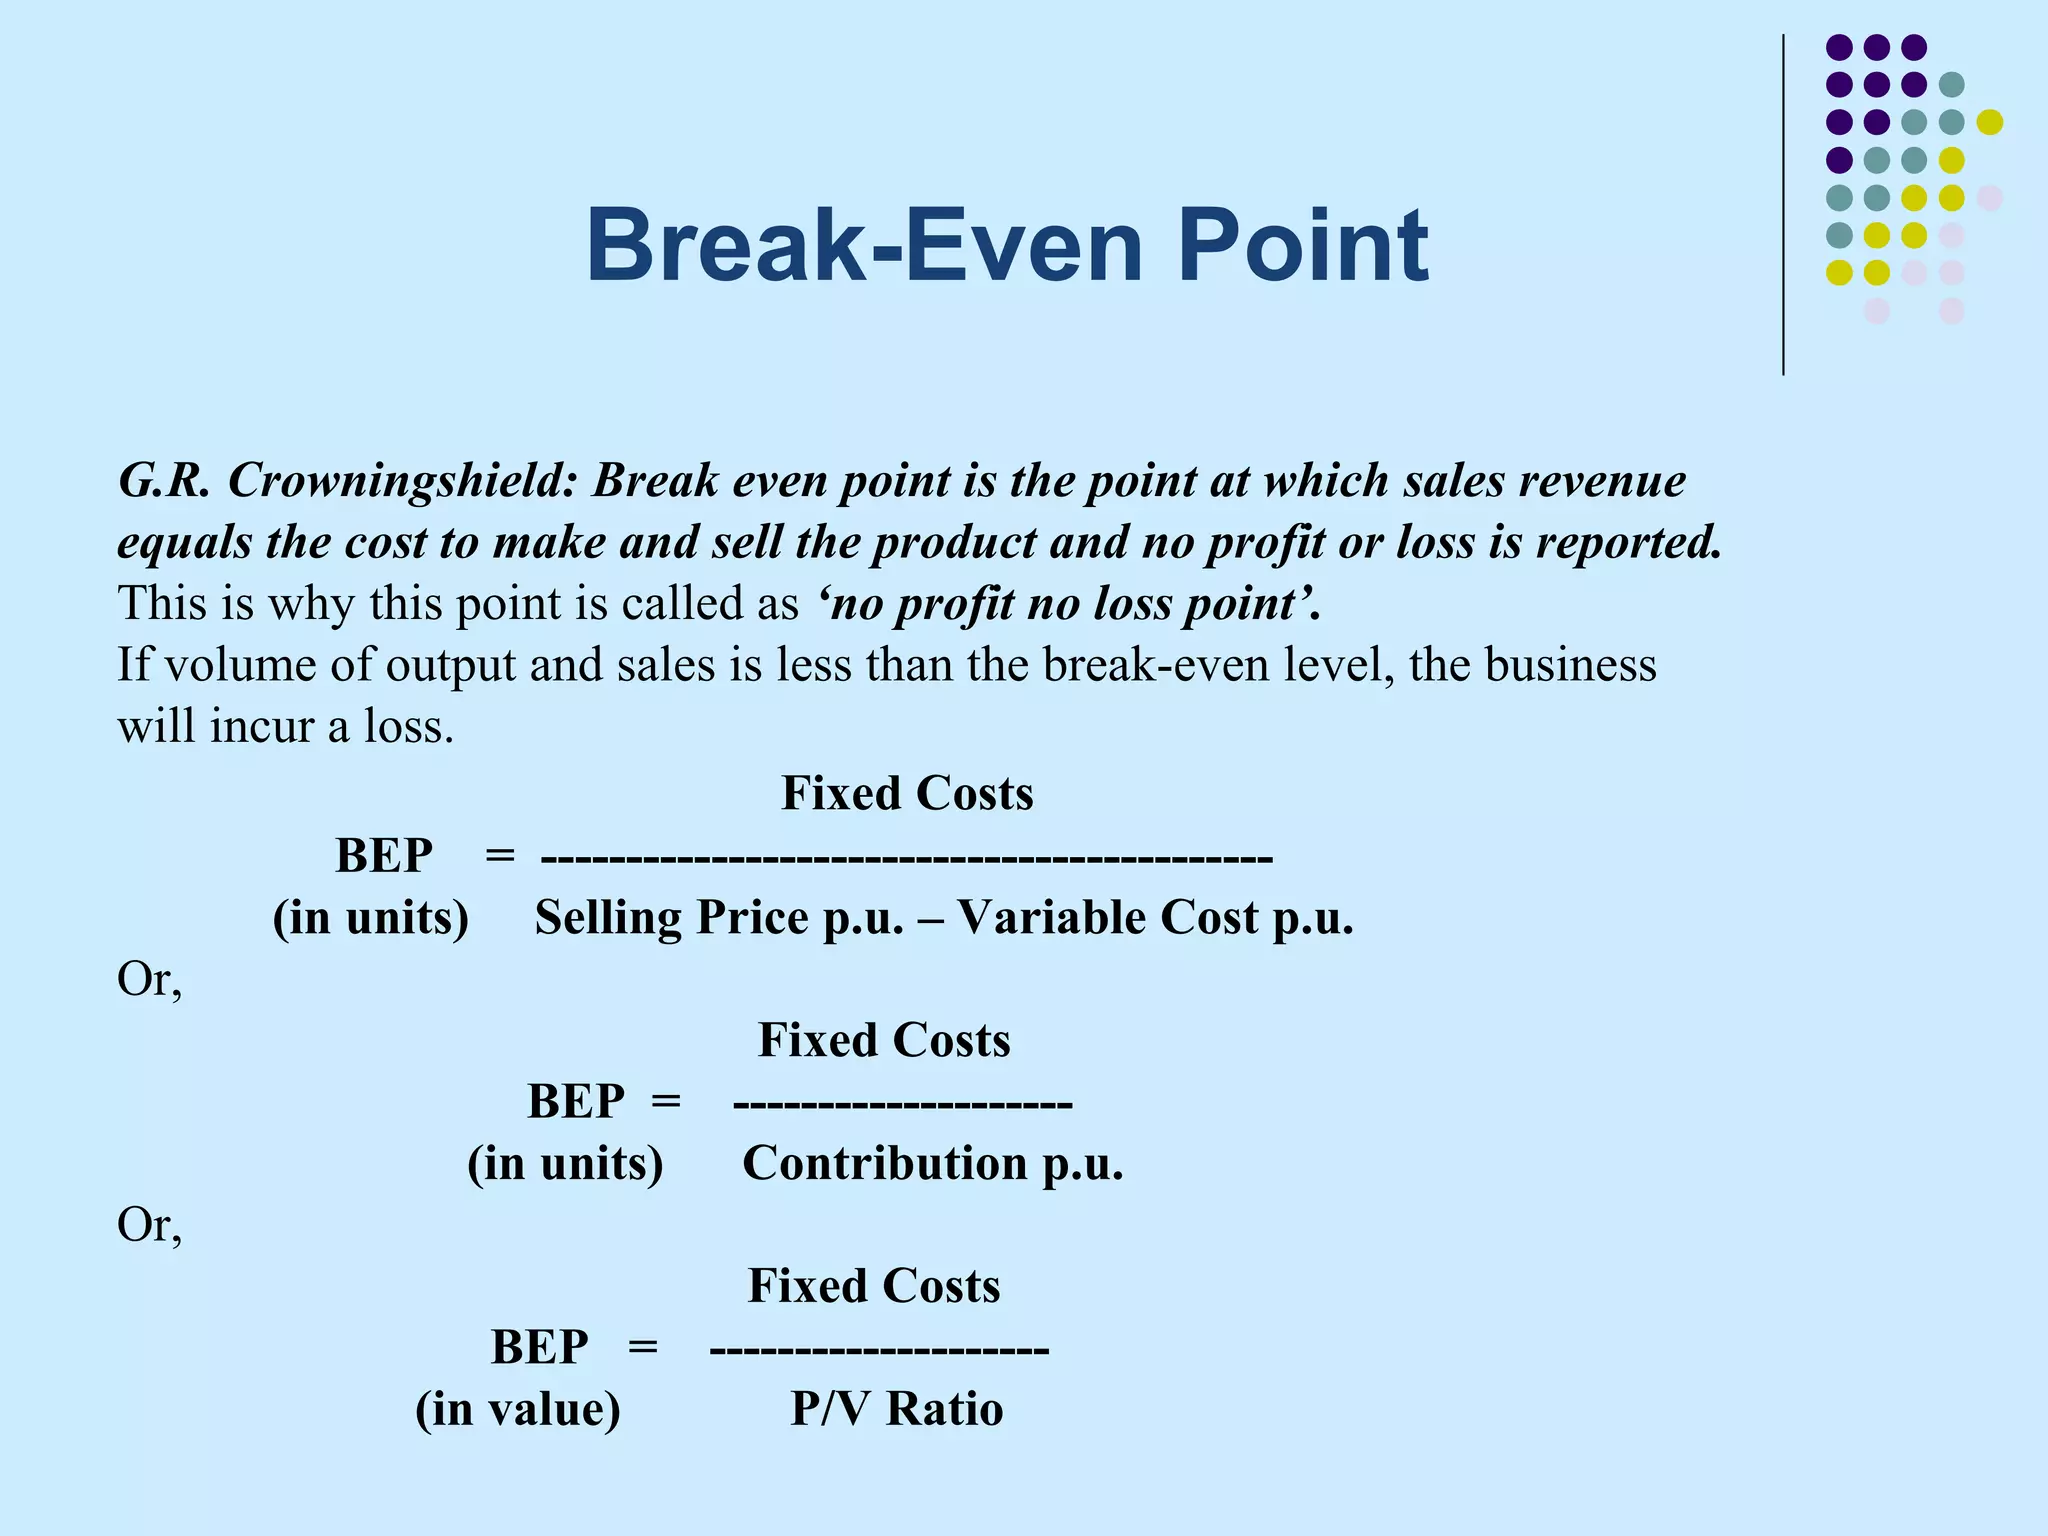
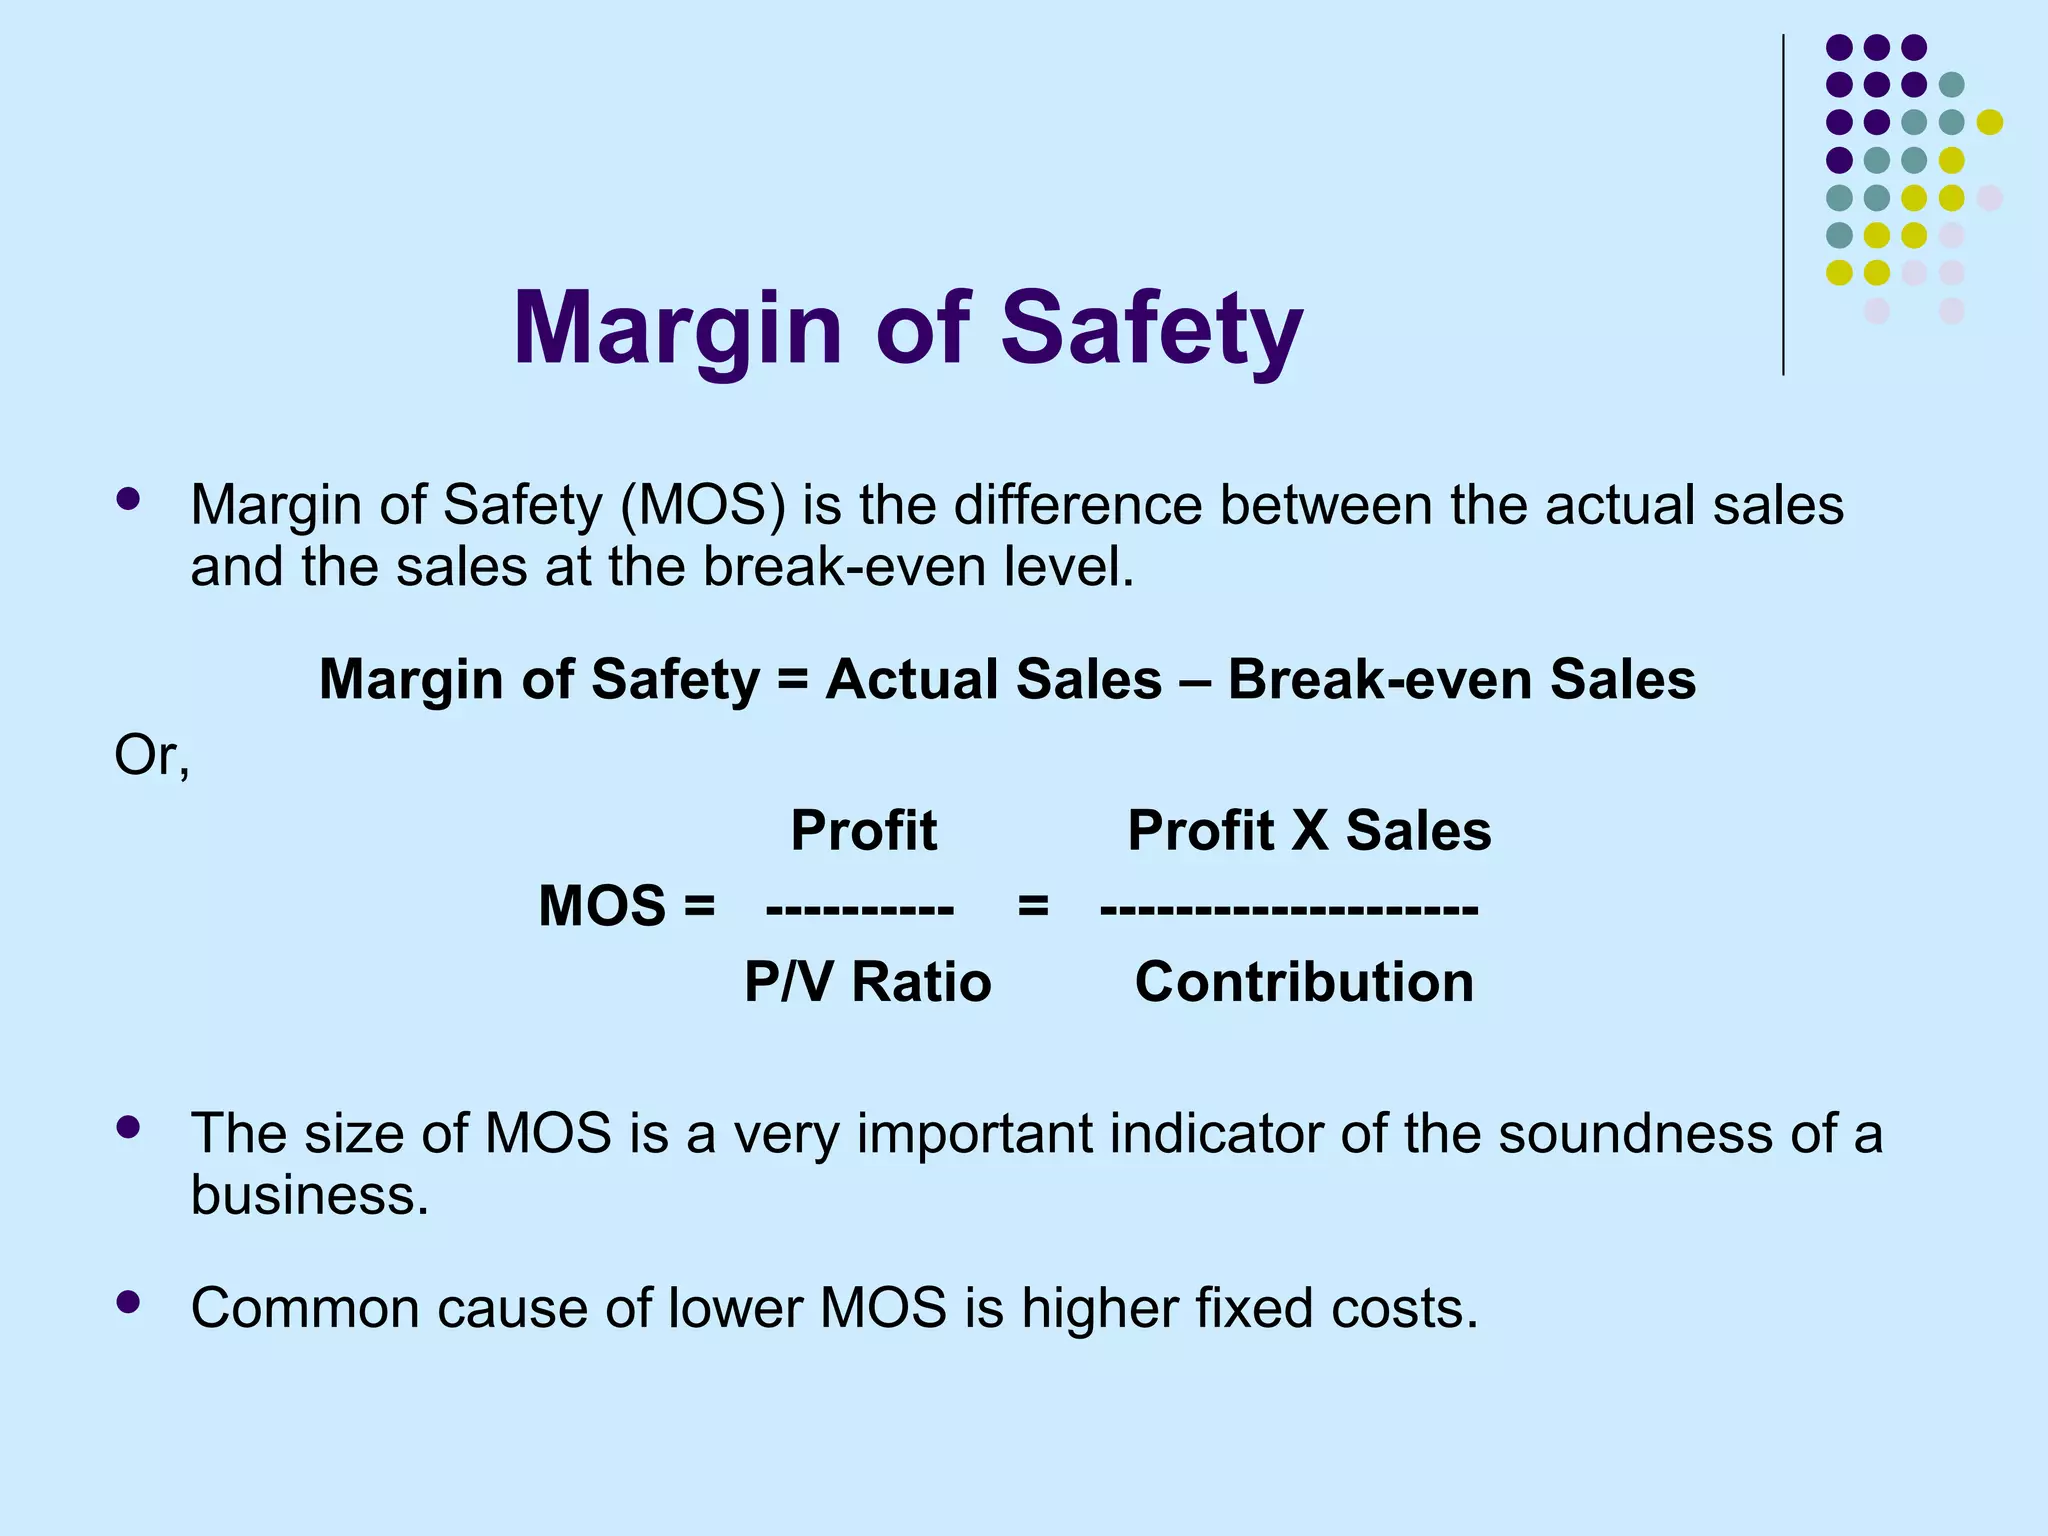
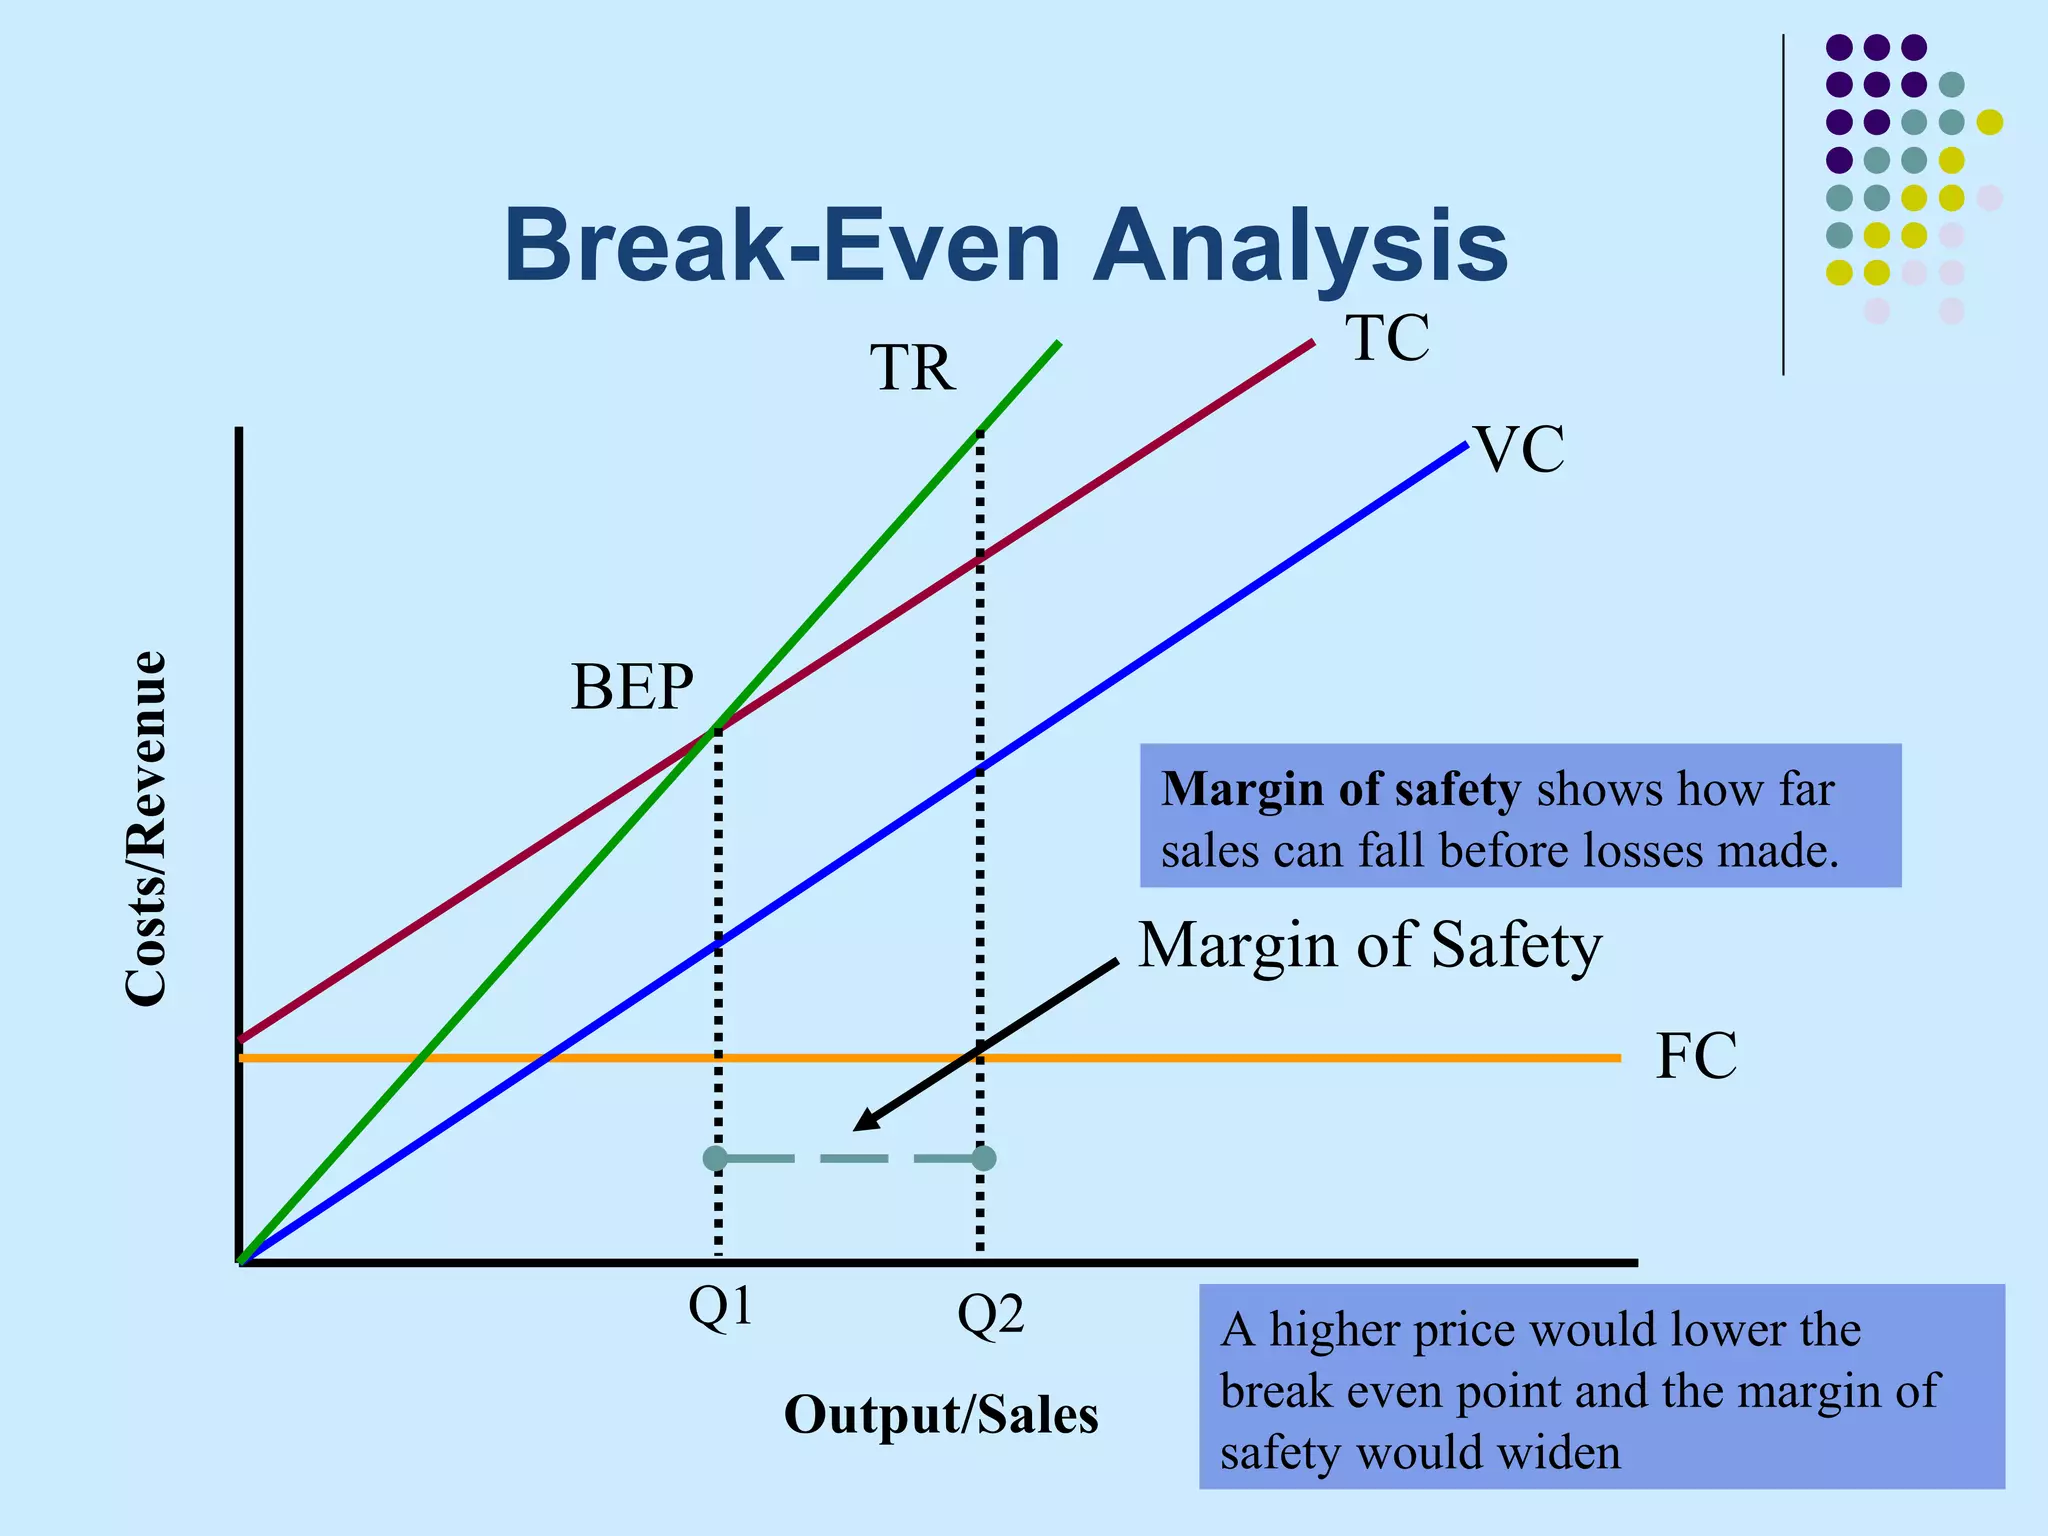
Cost-Volume-Profit Analysis
   It is the study of effects of the changes in the costs and volume
    on the profit of the company.
   this study is important for the management as it helps in taking
    vital decisions such as pricing of the product, determining product
    mix, choice of the production facility etc.
   It also helps the manager in deciding the volume of production
    because the higher the volume of production, the lower the total
    cost per unit.
   Thus, volume affects the costs and in turn costs affect the
    profit.
Cost-Volume-Profit Analysis

Assumptions:
►All costs can be accurately classified either into fixed costs or
variable costs
►All cost and revenue behaviour is linear
►All costs are affected by changes in activity only
►All units produced are sold, i.e. there is no unsold stock
►In cases when more than one type of product is sold, the sales
mix will remain constant.
Cost-Volume-Profit Analysis
CVP income statement is sometimes also called ‘marginal
costing statement’

CVP income statement:

               Total sales
               Less Variable Cost
               = Contribution
               Less Fixed Costs
               = Profit

         Selling Price = Total Cost + Profit
Profit-Volume Ratio or
      Contribution Margin Ratio
P/V Ratio is the measure of the contribution per every
rupee sold, to cover fixed cost and to generate profit.

                   P/V Ratio = (Sales – Variable Cost)
                              ------------------------------- X 100
                                           Sales

Or,

      = Selling Price per unit – Variable Cost per unit
       ------------------------------------------------------------------   X 100
                           Selling Price per unit
Break-Even Analysis
                                  TR        TC
                                       Profit    VC
Costs/Revenue


Loss
                                                      FC


                  Q1
                       Output/Sales
Break-Even Point

G.R. Crowningshield: Break even point is the point at which sales revenue
equals the cost to make and sell the product and no profit or loss is reported.
This is why this point is called as ‘no profit no loss point’.
If volume of output and sales is less than the break-even level, the business
will incur a loss.
                                  Fixed Costs
           BEP = -------------------------------------------
        (in units) Selling Price p.u. – Variable Cost p.u.
Or,
                                 Fixed Costs
                      BEP = --------------------
                   (in units)   Contribution p.u.
Or,
                                Fixed Costs
                    BEP = --------------------
                (in value)        P/V Ratio
Break-Even Analysis

   A higher price or lower price does not mean that break even will
    never be reached.
   The Break even point depends on the number of sales needed to
    generate revenue to cover costs.
   Example 1: Fixed Cost = Rs.24,000
             Selling Price = Rs.100 p.u.
             Variable Cost = Rs.40 p.u.
   Example 2: Fixed Cost = Rs.10,000
             Sales = Rs.40,000
             Variable Cost = Rs.24,000
             Units sold = 4,000
Margin of Safety
   Margin of Safety (MOS) is the difference between the actual sales
    and the sales at the break-even level.
         Margin of Safety = Actual Sales – Break-even Sales
Or,
                         Profit       Profit X Sales
                 MOS = ---------- = --------------------
                       P/V Ratio      Contribution

   The size of MOS is a very important indicator of the soundness of a
    business.
   Common cause of lower MOS is higher fixed costs.
Break-Even Analysis
                           TR                   TC
                                                      VC


                 BEP
Costs/Revenue


                                       Margin of safety shows how far
                                       sales can fall before losses made.
                                       Margin of Safety
                                                               FC


                   Q1           Q2       A higher price would lower the
                                         break even point and the margin of
                        Output/Sales
                                         safety would widen
Break-Even Analysis
Links of Break-even to pricing strategies and elasticity:
   Penetration pricing – ‘high’ volume, ‘low’ price – more sales to break
    even
   Market Skimming – ‘high’ price ‘low’ volumes – fewer sales to break even

Elasticity – what is likely to happen to sales when prices are
   increased or decreased?
Higher prices might mean fewer sales to break-even but those sales may
   take a longer time to achieve.

Lower prices might encourage more customers but higher volume needed
  before sufficient revenue generated to break-even

PPT on break even analysis

  • 1.
    Cost-Volume-Profit Analysis  It is the study of effects of the changes in the costs and volume on the profit of the company.  this study is important for the management as it helps in taking vital decisions such as pricing of the product, determining product mix, choice of the production facility etc.  It also helps the manager in deciding the volume of production because the higher the volume of production, the lower the total cost per unit.  Thus, volume affects the costs and in turn costs affect the profit.
  • 2.
    Cost-Volume-Profit Analysis Assumptions: ►All costscan be accurately classified either into fixed costs or variable costs ►All cost and revenue behaviour is linear ►All costs are affected by changes in activity only ►All units produced are sold, i.e. there is no unsold stock ►In cases when more than one type of product is sold, the sales mix will remain constant.
  • 3.
    Cost-Volume-Profit Analysis CVP incomestatement is sometimes also called ‘marginal costing statement’ CVP income statement: Total sales Less Variable Cost = Contribution Less Fixed Costs = Profit Selling Price = Total Cost + Profit
  • 4.
    Profit-Volume Ratio or Contribution Margin Ratio P/V Ratio is the measure of the contribution per every rupee sold, to cover fixed cost and to generate profit. P/V Ratio = (Sales – Variable Cost) ------------------------------- X 100 Sales Or, = Selling Price per unit – Variable Cost per unit ------------------------------------------------------------------ X 100 Selling Price per unit
  • 5.
    Break-Even Analysis TR TC Profit VC Costs/Revenue Loss FC Q1 Output/Sales
  • 6.
    Break-Even Point G.R. Crowningshield:Break even point is the point at which sales revenue equals the cost to make and sell the product and no profit or loss is reported. This is why this point is called as ‘no profit no loss point’. If volume of output and sales is less than the break-even level, the business will incur a loss. Fixed Costs BEP = ------------------------------------------- (in units) Selling Price p.u. – Variable Cost p.u. Or, Fixed Costs BEP = -------------------- (in units) Contribution p.u. Or, Fixed Costs BEP = -------------------- (in value) P/V Ratio
  • 7.
    Break-Even Analysis  A higher price or lower price does not mean that break even will never be reached.  The Break even point depends on the number of sales needed to generate revenue to cover costs.  Example 1: Fixed Cost = Rs.24,000 Selling Price = Rs.100 p.u. Variable Cost = Rs.40 p.u.  Example 2: Fixed Cost = Rs.10,000 Sales = Rs.40,000 Variable Cost = Rs.24,000 Units sold = 4,000
  • 8.
    Margin of Safety  Margin of Safety (MOS) is the difference between the actual sales and the sales at the break-even level. Margin of Safety = Actual Sales – Break-even Sales Or, Profit Profit X Sales MOS = ---------- = -------------------- P/V Ratio Contribution  The size of MOS is a very important indicator of the soundness of a business.  Common cause of lower MOS is higher fixed costs.
  • 9.
    Break-Even Analysis TR TC VC BEP Costs/Revenue Margin of safety shows how far sales can fall before losses made. Margin of Safety FC Q1 Q2 A higher price would lower the break even point and the margin of Output/Sales safety would widen
  • 10.
    Break-Even Analysis Links ofBreak-even to pricing strategies and elasticity:  Penetration pricing – ‘high’ volume, ‘low’ price – more sales to break even  Market Skimming – ‘high’ price ‘low’ volumes – fewer sales to break even Elasticity – what is likely to happen to sales when prices are increased or decreased? Higher prices might mean fewer sales to break-even but those sales may take a longer time to achieve. Lower prices might encourage more customers but higher volume needed before sufficient revenue generated to break-even