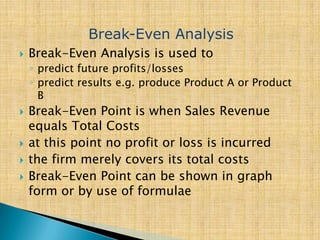
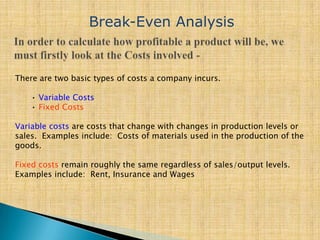
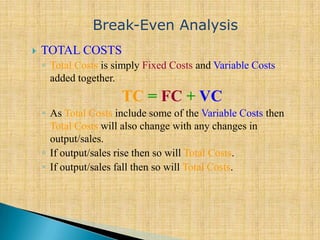
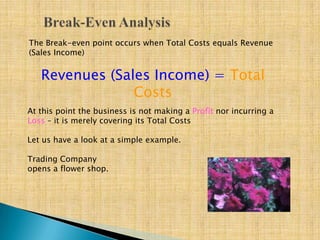
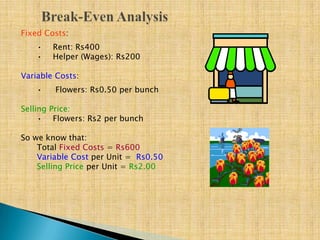
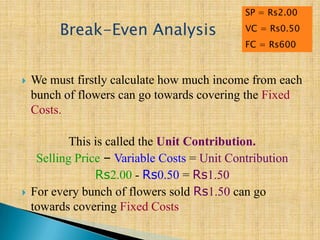
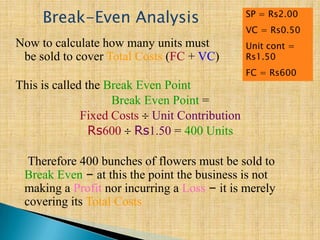
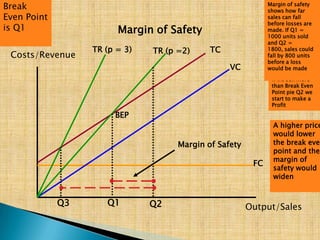
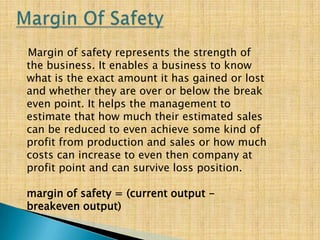
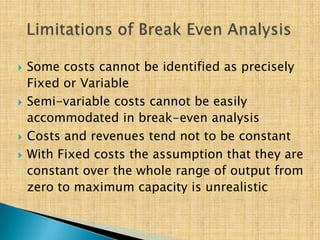
 SUFIYAN
 CHAITANYA
 ESHAN
 NUPUR
 Breakeven analysis examines the short run
relationship between changes in volume and
changes in total sales revenue, expenses and
net profit
 Also known as C-V-P analysis (Cost Volume
Profit Analysis)
 Break-Even Analysis is used to
◦ predict future profits/losses
◦ predict results e.g. produce Product A or Product
B
 Break-Even Point is when Sales Revenue
equals Total Costs
 at this point no profit or loss is incurred
 the firm merely covers its total costs
 Break-Even Point can be shown in graph
form or by use of formulae
Break-Even Analysis
There are two basic types of costs a company incurs.
• Variable Costs
• Fixed Costs
Variable costs are costs that change with changes in production levels or
sales. Examples include: Costs of materials used in the production of the
goods.
Fixed costs remain roughly the same regardless of sales/output levels.
Examples include: Rent, Insurance and Wages
Break-Even Analysis
Break-Even Analysis
 TOTAL COSTS
◦ Total Costs is simply Fixed Costs and Variable Costs
added together.
TC = FC + VC
◦ As Total Costs include some of the Variable Costs then
Total Costs will also change with any changes in
output/sales.
◦ If output/sales rise then so will Total Costs.
◦ If output/sales fall then so will Total Costs.
The Break-even point occurs when Total Costs equals Revenue
(Sales Income)
Revenues (Sales Income) = Total
Costs
At this point the business is not making a Profit nor incurring a
Loss – it is merely covering its Total Costs
Let us have a look at a simple example.
Trading Company
opens a flower shop.
Fixed Costs:
• Rent: Rs400
• Helper (Wages): Rs200
Variable Costs:
• Flowers: Rs0.50 per bunch
Selling Price:
• Flowers: Rs2 per bunch
So we know that:
Total Fixed Costs = Rs600
Variable Cost per Unit = Rs0.50
Selling Price per Unit = Rs2.00
 We must firstly calculate how much income from each
bunch of flowers can go towards covering the Fixed
Costs.
This is called the Unit Contribution.
Selling Price – Variable Costs = Unit Contribution
Rs2.00 - Rs0.50 = Rs1.50
 For every bunch of flowers sold Rs1.50 can go
towards covering Fixed Costs
Break-Even Analysis
SP = Rs2.00
VC = Rs0.50
FC = Rs600
Now to calculate how many units must
be sold to cover Total Costs (FC + VC)
This is called the Break Even Point
Break Even Point =
Fixed Costs Unit Contribution
Rs600 Rs1.50 = 400 Units
Therefore 400 bunches of flowers must be sold to
Break Even – at this the point the business is not
making a Profit nor incurring a Loss – it is merely
covering its Total Costs
Break-Even Analysis SP = Rs2.00
VC = Rs0.50
Unit cont =
Rs1.50
FC = Rs600
Break-Even Chart
Costs/Revenue
Output/Sales
FC
VC
TCTR (p = RS 2)
Q1
Loss
Profit
BEP
The Break-even
point occurs
where total
revenue equals
total costs – the
firm, in this
example would
have to sell Q1 to
generate
sufficient revenue
(income) to cover
its total costs.
Costs/Revenue
Output/Sales
FC
VC
TCTR (p =2)
Q1 Q2
If we sell more
than Break Even
Point pie Q2 we
start to make a
Profit
Margin of Safety
Margin of safety
shows how far
sales can fall
before losses are
made. If Q1 =
1000 units sold
and Q2 =
1800, sales could
fall by 800 units
before a loss
would be made
TR (p = 3)
Q3
A higher price
would lower
the break even
point and the
margin of
safety would
widen
Break
Even Point
is Q1
BEP
Margin of Safety
Margin of safety represents the strength of
the business. It enables a business to know
what is the exact amount it has gained or lost
and whether they are over or below the break
even point. It helps the management to
estimate that how much their estimated sales
can be reduced to even achieve some kind of
profit from production and sales or how much
costs can increase to even then company at
profit point and can survive loss position.
margin of safety = (current output -
breakeven output)
 All Fixed and Variable costs can be
identified
 Variable costs are assumed to vary directly
with output
 Fixed costs will remain constant
 Selling prices are assumed to remain
constant for all levels of output
 The sales mix of products will remain
constant – break even charts cannot handle
multi-product situations
 It is assumed that all production will be sold
 The volume of activity is the only relevant
factor which will affect costs
 Some costs cannot be identified as precisely
Fixed or Variable
 Semi-variable costs cannot be easily
accommodated in break-even analysis
 Costs and revenues tend not to be constant
 With Fixed costs the assumption that they are
constant over the whole range of output from
zero to maximum capacity is unrealistic
 Price reduction may be necessary to
protect sales in the face of increased
competition
 The sales mix may change with changes
in tastes and fashions
 Productivity may be affected by strikes
and absenteeism
 The balance between Fixed and Variable
costs may be altered by new technology
Cost accounting

Cost accounting

  • 1.
  • 2.
     Breakeven analysisexamines the short run relationship between changes in volume and changes in total sales revenue, expenses and net profit  Also known as C-V-P analysis (Cost Volume Profit Analysis)
  • 3.
     Break-Even Analysisis used to ◦ predict future profits/losses ◦ predict results e.g. produce Product A or Product B  Break-Even Point is when Sales Revenue equals Total Costs  at this point no profit or loss is incurred  the firm merely covers its total costs  Break-Even Point can be shown in graph form or by use of formulae Break-Even Analysis
  • 4.
    There are twobasic types of costs a company incurs. • Variable Costs • Fixed Costs Variable costs are costs that change with changes in production levels or sales. Examples include: Costs of materials used in the production of the goods. Fixed costs remain roughly the same regardless of sales/output levels. Examples include: Rent, Insurance and Wages Break-Even Analysis
  • 5.
    Break-Even Analysis  TOTALCOSTS ◦ Total Costs is simply Fixed Costs and Variable Costs added together. TC = FC + VC ◦ As Total Costs include some of the Variable Costs then Total Costs will also change with any changes in output/sales. ◦ If output/sales rise then so will Total Costs. ◦ If output/sales fall then so will Total Costs.
  • 6.
    The Break-even pointoccurs when Total Costs equals Revenue (Sales Income) Revenues (Sales Income) = Total Costs At this point the business is not making a Profit nor incurring a Loss – it is merely covering its Total Costs Let us have a look at a simple example. Trading Company opens a flower shop.
  • 7.
    Fixed Costs: • Rent:Rs400 • Helper (Wages): Rs200 Variable Costs: • Flowers: Rs0.50 per bunch Selling Price: • Flowers: Rs2 per bunch So we know that: Total Fixed Costs = Rs600 Variable Cost per Unit = Rs0.50 Selling Price per Unit = Rs2.00
  • 8.
     We mustfirstly calculate how much income from each bunch of flowers can go towards covering the Fixed Costs. This is called the Unit Contribution. Selling Price – Variable Costs = Unit Contribution Rs2.00 - Rs0.50 = Rs1.50  For every bunch of flowers sold Rs1.50 can go towards covering Fixed Costs Break-Even Analysis SP = Rs2.00 VC = Rs0.50 FC = Rs600
  • 9.
    Now to calculatehow many units must be sold to cover Total Costs (FC + VC) This is called the Break Even Point Break Even Point = Fixed Costs Unit Contribution Rs600 Rs1.50 = 400 Units Therefore 400 bunches of flowers must be sold to Break Even – at this the point the business is not making a Profit nor incurring a Loss – it is merely covering its Total Costs Break-Even Analysis SP = Rs2.00 VC = Rs0.50 Unit cont = Rs1.50 FC = Rs600
  • 10.
    Break-Even Chart Costs/Revenue Output/Sales FC VC TCTR (p= RS 2) Q1 Loss Profit BEP The Break-even point occurs where total revenue equals total costs – the firm, in this example would have to sell Q1 to generate sufficient revenue (income) to cover its total costs.
  • 11.
    Costs/Revenue Output/Sales FC VC TCTR (p =2) Q1Q2 If we sell more than Break Even Point pie Q2 we start to make a Profit Margin of Safety Margin of safety shows how far sales can fall before losses are made. If Q1 = 1000 units sold and Q2 = 1800, sales could fall by 800 units before a loss would be made TR (p = 3) Q3 A higher price would lower the break even point and the margin of safety would widen Break Even Point is Q1 BEP Margin of Safety
  • 12.
    Margin of safetyrepresents the strength of the business. It enables a business to know what is the exact amount it has gained or lost and whether they are over or below the break even point. It helps the management to estimate that how much their estimated sales can be reduced to even achieve some kind of profit from production and sales or how much costs can increase to even then company at profit point and can survive loss position. margin of safety = (current output - breakeven output)
  • 13.
     All Fixedand Variable costs can be identified  Variable costs are assumed to vary directly with output  Fixed costs will remain constant  Selling prices are assumed to remain constant for all levels of output
  • 14.
     The salesmix of products will remain constant – break even charts cannot handle multi-product situations  It is assumed that all production will be sold  The volume of activity is the only relevant factor which will affect costs
  • 15.
     Some costscannot be identified as precisely Fixed or Variable  Semi-variable costs cannot be easily accommodated in break-even analysis  Costs and revenues tend not to be constant  With Fixed costs the assumption that they are constant over the whole range of output from zero to maximum capacity is unrealistic
  • 16.
     Price reductionmay be necessary to protect sales in the face of increased competition  The sales mix may change with changes in tastes and fashions  Productivity may be affected by strikes and absenteeism  The balance between Fixed and Variable costs may be altered by new technology