The document appears to be a student project report on break-even analysis and break-even point. It includes sections on definitions of key terms related to break-even analysis like fixed costs, variable costs, selling price. It also discusses the assumptions and limitations of break-even analysis. The document provides an example calculation of break-even point using the contribution margin method and defines break-even point as the sales volume where total revenue equals total costs and profit is zero. It is a student report submitted to the University of Mumbai for an M.Com course.
A customer-centric costing system that bases all cost workings for a product from its market price. The purpose is to reduce cost of a product as low as possible to arrive at a price that would be either equal to or less than that of competitors’ product while delivering the same functionality.
MARGINAL COSTING AS A TOOL FOR DECISION MAKINGShubham Boni
DON'T FORGET TO LIKE AND SHARE THE PRESENTATION.
MARGINAL COST:-
“Marginal cost is the additional cost of producing an additional unit of product.”
MARGINAL COSTING:-
“In Marginal costing technique, only variable costs are charged as product costs and included in inventory valuation.”
MARGINAL COSTING HELPS IN DECISION MAKING:-
1.Fixation of Selling Price.
2.Exploring New markets.
3.Make or buy decisions.
4.Product mix
5.Operate plant or shut down.
CASE STUDY 1:-
MAKE OR BUY DECISION.
CASE STUDY 2:-
PRODUCT MIX.
The presentation covers the basics of Cost Accounting.
It gives a birds eye view of the subject of Cost Accounting.
The advantages, limitations, need, scope, classification are covered.
the document is on Cost volume profit analysis.
(Cost-volume-profit (CVP) analysis is used to determine how changes in costs and volume affect a company's operating income and net income.)
Would it accelerate your business to network more? How do you calculate the actual dollars gained from attending industry conferences, summits, trade shows, dinners, and networking receptions?
Join us for a step-by-step tutorial on how to calculate the ROI on the time and money you spend attending events. We have distilled the hard and soft costs into a free, downloadable excel template that allows you to calculate your return.
Find out how learning program return on investment (ROI) is effectively conveyed using specific tools, strategies, and best practices. Define measurable outcomes, and build a compelling case.
Learn more: http://www.lynda.com/Education-Elearning-training-tutorials/1792-0.html
Determining the Mathematical ROI of a Project Management Office (PMO) Impleme...Ricardo Viana Vargas
Slides from the white paper which objective is to present, discuss and apply a mathematical model based on the use of Monte Carlo simulation in conjunction with researches on project success/failure rates of projects to develop a 10 step model to calculate the mathematical return on investment (ROI) for the Project Office implementation.
This presentation provides an overview of the basic principles and calculations often used in developing a financial justication analysis as part of a Business Case. Topics covered include:
- Pre-Tax Cash Flow
- Payback Period
- Accounting Terms and Principles
- Depreciation Methods
- After-Tax Cash Flow
- Discounted Cash Flow
- Net Present Value
- Internal Rate of Return
- Modified Internal Rate or Return
- Economic Value Added
- Packaging the Business Case
The presentations describes the 1991 Liberalization Privatization Globalization(LPG) model of Indian economy. Following are the topics discussed in the ppt:
Reasons for implementing LPG
Definitions
Advantages
Disadvantages
Disinvestment Commission
Successful privatizations in India
FDI
MNCs
Effects
Marginal costing is a costing technique wherein the marginal cost, i.e. variable cost is charged to units of cost, while the fixed cost for the period is completely written off against the contribution.
This powerpoint presentation is created by Gyanbikash.com for the students of class nine to ten from their accounting NCTB textbook for multimedia class.
Costs and its types - Fixed, Variable, Marginal and TotalTakshila Learning
Costs and its types – Fixed, Variable, Marginal and Total – CA, CMA Foundation, CS Executive, and Class 12 Economics. Distinguish between fixed cost and variable cost The amount of money spent by a firm on the production of goods is called cost Costs are classified into fixed, variable marginal, and total
Need 2 sets.So total 2 fresh posts and 4 repliesDescribe the d.docxmigdalialyle
Need 2 sets.So total 2 fresh posts and 4 replies
Describe the differences in behavior of fixed costs, variable costs, semi-variable costs and step costs. Then discuss how break-even analysis and contribution margin can be useful in making business decisions.
Submission Instructions:
Any written explanations should use complete sentences, and appropriate grammar, punctuation, spelling and word usage.
Your initial post should be at 200-300 words, formatted and cited in current APA style with support from at least 2 academic sources. Your initial post is worth 8 points.
You should respond to at least two of your peers by extending, refuting/correcting, or adding additional nuance to their posts. Your reply posts are worth 2 points (1 point per response.)
All replies must be constructive and use literature where possible.
Post by classmate 1
In describing the differences in behavior of fixed costs, variable costs, semi-variable costs and step cost, it is imperative to understand what each are and how they affect expense to an organization. A fixed cost is an expense to a business that does not change by either an increase or decrease in business activity. Some examples of fixed cost are rent or business insurance. These expenses remain constant regardless of business volume. A variable cost on the other hand, increases or decreases based on business activity or volume. Some examples of variable costs are ingredients in a product made. If one has a company that makes plastic cups, then variable expense of plastic or ingredients to make plastic cups increase with volume or business activity. Conversely, the variable expense to produce the product line decreases with less volume or business activity. The sum of fixed costs and variable costs is total costs. The key takeaway here is more production increases variable cost but fixed costs remain constant; but with increased volume in relation to unit cost reduces the fixed cost per unit. For example if fixed costs for an organization is $10,000, when more products are produced the per unit cost reduces the fixed unit cost per unit. This(increased volume) is a good thing.
According to reading of bookkeeping express, “Semi-variable costs consist of both fixed and variable costs. Part of the cost stays consistent (often a base cost) and part fluctuates with business activity. Examples include commission payments and overage charges Step costs are unique as they are a fixed cost that fall within certain threshold based on increased volume or decreased volume. This is an investment decision based on either taking on or not taking on new customers based on increasing expenses. This fixed cost can actually change."
The contribution margin is the sales prices of a product minus the variable cost to produce that product. If we them input this calculation over the units sales price, we get the contribution margin ratio. The break- even analysis determines at which point a company ...
This presentation, created by Syed Faiz ul Hassan, explores the profound influence of media on public perception and behavior. It delves into the evolution of media from oral traditions to modern digital and social media platforms. Key topics include the role of media in information propagation, socialization, crisis awareness, globalization, and education. The presentation also examines media influence through agenda setting, propaganda, and manipulative techniques used by advertisers and marketers. Furthermore, it highlights the impact of surveillance enabled by media technologies on personal behavior and preferences. Through this comprehensive overview, the presentation aims to shed light on how media shapes collective consciousness and public opinion.
0x01 - Newton's Third Law: Static vs. Dynamic AbusersOWASP Beja
f you offer a service on the web, odds are that someone will abuse it. Be it an API, a SaaS, a PaaS, or even a static website, someone somewhere will try to figure out a way to use it to their own needs. In this talk we'll compare measures that are effective against static attackers and how to battle a dynamic attacker who adapts to your counter-measures.
About the Speaker
===============
Diogo Sousa, Engineering Manager @ Canonical
An opinionated individual with an interest in cryptography and its intersection with secure software development.
Sharpen existing tools or get a new toolbox? Contemporary cluster initiatives...Orkestra
UIIN Conference, Madrid, 27-29 May 2024
James Wilson, Orkestra and Deusto Business School
Emily Wise, Lund University
Madeline Smith, The Glasgow School of Art
Acorn Recovery: Restore IT infra within minutesIP ServerOne
Introducing Acorn Recovery as a Service, a simple, fast, and secure managed disaster recovery (DRaaS) by IP ServerOne. A DR solution that helps restore your IT infra within minutes.
Have you ever wondered how search works while visiting an e-commerce site, internal website, or searching through other types of online resources? Look no further than this informative session on the ways that taxonomies help end-users navigate the internet! Hear from taxonomists and other information professionals who have first-hand experience creating and working with taxonomies that aid in navigation, search, and discovery across a range of disciplines.
This presentation by Morris Kleiner (University of Minnesota), was made during the discussion “Competition and Regulation in Professions and Occupations” held at the Working Party No. 2 on Competition and Regulation on 10 June 2024. More papers and presentations on the topic can be found out at oe.cd/crps.
This presentation was uploaded with the author’s consent.
International Workshop on Artificial Intelligence in Software Testing
Break-Even Analysis and Break-Even Point
1. 1
Cosmopolitan’s
Valia CL College of Commerce, BSc. (IT) & BMS.
D.N.Nagar, Andheri (w), Mumbai-400053.
A PROJECT
ON
“Break-Even Analysis and Break-Even Point”
In the subject of Advanced Cost Accounting
SUBMITTED TO
UNIVERSITY OF MUMBAI,
FOR SEMESTER-2 OF
MASTER OF COMMERCE
By
Avinash Vilas Chavan
Roll No. 04
UNDER THE GUIDANCE OF
Prof. C.A. Dipen Bhayani
YEAR: 2014-2015
2. 2
Cosmopolitan’s
Valia CL College of Commerce, BSc. (IT) & BMS.
D.N.Nagar, Andheri (w), Mumbai-400053.
DECLARATION BY THE STUDENT
I, Avinash Vilas Chavan
Roll No. 04 hereby declare that the project for the paper
Advanced Cost Accounting, titled,
“Break-Even Analysis and Break-Even Point”
Submitted by me for semester-2 during the academic year 2014-2015, is based on
actual work carried out by me under the guidance and supervision of
Prof C.A. Dipen Bhayani.
I, further state that this work is original and not submitted anywhere else for any
examination.
Signature of Student
3. 3
EVALUATION CERTIFICATE
This is to certify that the under signed have assessed and
evaluated the project on “Break-Even Analysis and Break-Even
Point”
Submitted by Avinash Vilas Chavan Student of M.Com. Part-I
(Semester-II).
This project is original to the best of our knowledge and has
been accepted for Internal Assessment.
Internal Examiner External Examiner Principal
(Prof. C.A. Dipen Bhayani) (Prof. ) (Dr. Satheesh menon)
4. 4
Acknowledgement
To list who all helped me is difficult because they are so
numerous and depth is so enormous.
I would like to acknowledge the following as being idealistic
channel and fresh dimension in the completion of this project.
I take this opportunity to thank the University of Mumbai for
giving me chance to do this project.
I would like to thank my Principal Dr. Satheesh menon, for
providing the necessary facilities required for completion of this
project.
I take this opportunity to thank our co-ordinator Prof.
V.M.Mathew, for his moral support and guidance.
I would also like to express my sincere gratitude towards my
project guide Prof. C.A. Dipen Bhayani under whose guidance
and care made the project successful.
I would like to thank my college library, for having provided
various reference books and magazines related to my project.
Lastly, I would like to thank each and every person who directly
or indirectly helped me in the completion of the project,
especially my parents and my peers who supported me
throughout my project.
(Avinash V. Chavan)
5. 5
Cosmopolitan’s
Valia CL College of Commerce, BSc. (IT) & BMS.
D.N.Nagar, Andheri (w), Mumbai-400053.
Internal Assessment: Protect 40 marks
Name of the Student: Chavan Avinash Vilas
Class:M.Com. Part-I Semester-II Roll Number: 04
Subject: Advanced Cost Accounting
Topic for the project: Break-Even Analysis and Break-Even Point
Marks AwardedSignature
Documentation
Internal Examiner
(Out of 10 Marks)
External Examiner
(Out of 10 Marks)
Presentation
(Out of 10 Marks)
Viva and Interaction
(Out of 10 Marks)
Total Marks(out of 40)
College Stamp
6. 6
INDEX
S.R.
NO.
PARTICULAR
1. BREAK EVEN ANALYSIS
2. BREAK EVEN CHART
3. DEFINITION AND EXPLANATION
FIXED COST
VARIABLE COST
SELLING PRICE
SEMI VARIABLE COST
4. ASSUMPTION OF BREAK EVEN ANALYSIS
5. LIMITATION OF BREAK EVEN ANALYSIS
6. BREAK EVEN POINT
DEFINITION OF BEP
EQUATION METHOD
CONTRIBUTION MARGIN METHOD
7. BIBILOGRAPHY
7. 7
BREAK EVEN ANALYSIS AND BREAK EVEN POINT
Break Even Analysis:
Break-even analysis is a technique widely used by production and management and
management accountants. It is based on categorizing production costs between those which are
“variable’ (costs that change when the production output changes) and those that are “fixed”
(costs not directly related to the volume of production).
Total variable and fixed costs are compared with sales revenue in order to determine the
level of sales volume, sales value or production at which the business makes a neither a profit
nor a loss (the “break-even-point”).
Definition:
A calculation of the sales volume (in units) required to just cover costs. A lower sales volume
would be unprofitable and a higher volume would be profitable. Break even analysis focuses on
the relationship between fixed cost, variable cost (or cost per units), and selling price (or selling
price per unit).
The Break Even Chart:
In its simplest form, the break even chart is a graphical representation of costs at various levels
of activity shown on the same chart as the variation of income (or sales, revenue) with the same
variation in activity. The point at which neither profit nor loss is made is known as the “break-
even point” and is represented on the chart below by the intersection of the two lines:
8. 8
In the diagram above, the line OA represent the variation of income at varying levels of
production activity (“output”). OB represent the total fixed costs in the business. As output
increases, variable costs are incurred, meaning that total costs (fixes + variable) also increase. At
low levels of output, costs are greater than income. At point of intersection P, costs are exactly
equal to income, and hence neither profit nor loss is made.
9. 9
Definition of fixed costs
Costs that do not change when production or sales levels do change, such as rent, property tax,
insurance, or interest expenses. The fixed costs are summarized for a specific time period
(generally one month).
Explanation of fixed costs with example:
Fixed costs are those business costs that are not directly related to the level of production or
output. In other words, even if the business has a zero output or high output the level of fixed
output the level of fixed costs will remain broadly the same. In the long term fixed costs can alter
– perhaps as a result of investment in production capacity (e.g. adding new factory unit) or
through the growth in overheads required to support a larger, more complex business.
Example of Fixed cost:
Rent and taxes
Depreciation
Research and development
Marketing (non- revenue related )
Administration costs
10. 10
Definition of Variable cost (per units cost)
Variable costs are costs that change in proportion to the good or service that a business
produces. Variable costs are also the sum of marginal costs over all units produced. They can
also be considered normal costs. Fixed costs and variable costs make up the two components of
total cost.
Direct costs, however, are costs that can easily be associated with a particular cost object.
However, not all variable costs are direct costs. For example, variable manufacturing overhead
costs are variable costs that are indirect costs, not direct costs. Variable costs are sometimes
called unit-level costs as they vary with the number of units produced.
Direct labor and overhead are often called conversion cost, while direct material and direct labor
are often referred to as prime cost.
In marketing, it is necessary to know how costs divide between variable and fixed. This
distinction is crucial in forecasting the earnings generated by various changes in unit sales and
thus the financial impact of proposed marketing campaigns. In a survey of nearly 200 senior
marketing managers, 60 percent responded that they found the "variable and fixed costs" metric
very useful
Explanation of variable cost with example:
Variable costs are those costs which vary directly with the level of output. They represent
payments output-related inputs such as raw materials, direct labor, fuel and revenue- related
costs such as commission.
For example, a firm pays for raw materials. When activity is decreased, less raw material is used,
and so the spending for raw materials falls. When activity is increased, more raw material is
used, and spending therefore rises. Note that the changes in expenses happen with little or no
need for managerial intervention. These costs are variable costs.
A company will pay for line rental and maintenance fees each period regardless of how much
power gets used. And some electrical equipment (air conditioning or lighting) may be kept
11. 11
running even in periods of low activity. These expenses can be regarded as fixed. But beyond
this, the company will use electricity to run plant and machinery as required. The busier the
company, the more the plant will be run, and so the more electricity gets used. This extra
spending can therefore be regarded as variable.
In retail the cost of goods is almost entirely a variable cost; this is not true of manufacturing
where many fixed costs, such as depreciation, are included in the cost of goods.
Although taxation usually varies with profit, which in turn varies with sales volume, it is not
normally considered a variable cost.
For some employees, salary is paid on monthly rates, independent of how many hours the
employees work. This is a fixed cost. On the other hand, the hours of hourly employees can often
be varied, so this type of labour cost is a variable cost. The cost of material is a variable cost
Definition of selling price (per unit price)
The price that a unit is sold for sales tax is not included the selling price and a sales tax paid is
not included as a cost. The selling price times the number of units sold equals the total sales.
12. 12
Definition of semi-variable cost:
Semi-variable cost is an expense which contains both a fixed-cost component and a variable-
cost component. The fixed cost element shall be a part of the cost that needs to be paid
irrespective of the level of activity achieved by the entity. On the other hand the variable
component of the cost is payable proportionate to the level of activity.
Explanation of semi-variable cost;
It shows similarities to telephone bills. One must pay line rental and on top of that a price that
depends on how heavy one is using the service. So it changes with output. Another example is
satellite television. A price for the box must be paid monthly and to get additional movies, more
money has to be given.
Cost of energy, such as electricity, is a good example as it is integral to production of goods and
services. This component straddles both the fixed and variable universe because electrical power
is essential for the basic operation of the business in lighting and heating – this portion is a sunk
cost that is foregone regardless of production. As demand ramps up, more energy is required to
ramp up the production process in the use of machinery or large banks of computers for instance.
Cost of electrical energy will then rise accordingly as production activities increase. Therefore,
the cost of electricity can be viewed as semi-variable.
Take the highest output and costs. Take the lowest output and costs. Take one from the other =
movement in cost per unit Calculate variable cost per unit Put back into highest total cost and
rework variable cost to the output, leaving fixed cost.
13. 13
Assumption Of Break Even Analysis:
The Break even Analysis Depends On three Key Assumption:
1. Average per-unit sales prices (per-unit revenue):
This is the price that you receive per unit of sales. Take into account sales discount and
special offers. Get this numbers from sales forecast. For non-unit based businesses, make the
per- unit revenue Rs. 1 and enter your costs as a percent of a rupees. The most common
questions about this inputs relate to averaging many different products into a single
estimates. The analysis requires a single number and if you build your sales forecast first,
then you will have this number. You are not alone in this the vast majority of businesses sell
more than one item, and have to average for their Break even Analysis.
2. Average Per-unit Cost:
This is incremental cost, or variable cost, of each unit sales. If you buy goods for resale, this
is what you paid, on average, for the goods you sell. If you sell a services, this is what it
costs you, per dollar of revenue or unit of services delivered, to deliver that services. If you
are using a units-based Sales Forecast table (for manufacturing and mixed business types),
you can projects unit costs from the sales forecast table. If you are using the basic sales
Forecast table for retail, services and distribution businesses, use a percentage estimate, e.g.
a retail store running a 50% margin would have a per-unit cost of .5, and a per-unit revenue
of 1.
3. Monthly Fixed Cost:
Technically, a break even analysis defines fixed cost as costs that would continue even if
you want broke. Instead, we recommend that you use your regular running costs, including
payroll and normal expenses (total monthly Operating Expenses). This will give you a better
insight on financial realities. If averaging and estimating is difficult, use your Profit and
14. 14
Loss table to calculate a working fixed cost estimate – it will be a rough estimate, but it will
provide a useful input for a conservative Break even Analysis.
Limitation OF Break Even Analysis:
It is best suited to the analysis of one product at a time. It may be difficult to classify a cost
as all variable or all fixed; and there may be a tendency to continue to use a break even
analysis the cost income function have changed.
It is important to understand what the result of your Break even analysis are telling you.
If, for example, the calculation reports that you would break even when you sold your 500th
unit, decide whether this seems feasible. If you don’t think you can sell 500 units within a
reasonable period of time (dedicated by your financial situation, patience and personal
expectations), then this may not be the right business for you to go into. If you think 500 unit
is possible but would take while, try lowering your price and calculated and analyzing the
new breakeven point.
Alternatively, take a look at your costs – both fixed and variable – and identify areas
where you might be able to make cuts.
Lastly, understand that breakeven analysis is not a predictor of demand, so if you go
into market with the wrong product or the wrong price, it may be tough to ever hit the break
even point.
15. 15
Break even point:
The sales volume (express as units sold) at which the company breaks even. Profits are Rs.0 at
the break even point. The break even point is calculated by the following formula:
Break Even Point (BEP) = Fixed cost / contribution (selling price- variable cost)
Time period:
The fixed costs are summarized for a specific time period.
The per unit variable cost is not dependant on a specific period of time.
The per unit selling price is not dependant on a specific period of time.
The Break even Point is expressed the number of units, over a specific time period, that
must be sold to obtain a Net Profit Rs.0. the time period the units must be sold is always
the same as the time period of fixed costs.
Typically the period is monthly, however it could be Yearly or even Hourly. For
example, a farmer seeking the break even on an annual corn crop would choose a yearly
time period. The farmer would add up the fixed costs for the whole year and the break
even sales volume would be expressed as yearly sales volume.
The text that is written in the time period field is copied to the title of the break even Graph and
Break Even Report. If you leave the field blank then nothing will be copied.
16. 16
BREAK EVEN POINT:
Assume the following:
Fixed Cost:
Monthly Rent: 100Rs.
Insurance (600Rs. P.A. 600/12 months) 50Rs.
Total Monthly Fixed Costs 150Rs.
Variable Cost:
Materials 3Rs.
Labor 6Rs.
Total Variable Cost 7Rs.
Selling price: 10Rs.
Break Even Point Calculation
Break Even Point = Fixed costs / (selling price – Variable Costs)
= 150 / (10 – 7)
= 150 / 3
Break Even Point = 50
To break even the company must sell 50 units per month.
If the company just broke even, then its Profits and Loss statements would look like the
followings:
17. 17
Monthly Profits and Loss Statements
Sales
Goss sales (10Rs. Per units 50 units) 500Rs.
Les COGS (7Rs. Per Units Units) 350Rs.
Nets Sales 150Rs.
Expenses
Rent 100Rs.
Insurance 50RS.
Total Expenses 150Rs.
Net Profit 0 RS.
18. 18
Definition Of Break Even Point:
Break-even point is the level of sales at which profit is zero. According to this definition, at
break-even point sales are equal to fixed cost plus variable cost. This concepts is further
explained by the following equation:
[Break-even sales= fixed cost + variable cost]
The break-even point can be calculated using either the equation method or margin method.
These two method are equivalent:
Equation method:
The equation method center on the contribution approach to the income statement.
The format of this statement can be expressed is equation form as follow:
Profit = (Sales – Variable expenses) – Fixed Expenses
Rearranging this equation slightly yields the following equation, which is widely used in cost
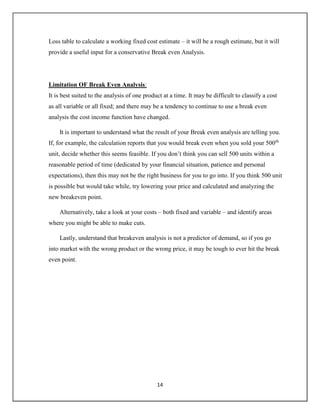
volume profit (CVP) analysis:
Sales = Variable expenses + Fixed Expenses + Profit
According to the definition of break-even point, break-even point is the level of sales where
profits are zero. Therefore the break-even point can be computed by finding that point where
sales just equal the total of the variable expenses plus fixed expenses and profit is zero.
Example:
For example we can use the following data to calculate break-even point.
1. Sales prices per units = 250 Rs.
2. Variable cost per unit = 150Rs.
3. Total fixed expenses = 35000Rs.
Calculate break even point.
19. 19
Calculation:
Sales = Variable Expenses + Fixed Expenses + Profits
Rs.250Q* = Rs.150Q + Rs.35000 + Rs. 0**
Rs.100Q = Rs.35000
Q = 35000 / 100
Q = 350 units
[Q* = numbers of units sold]
**The break-even point can be computed by finding that point where profits is zero.
The break even point in sales Rupees can be computed by multiplying the break even level of
units sales by the selling price per units.
350 units x 250Rs. per units = Rs. 87500
Contribution Margin Method:
The contribution Margin method is actually just a short cut conversion of the equation method
already described. The approach center on the idea discussed earlier that each unit sold provides
a certain amount of contribution margin that goes toward covering fixed cost. To find out how
many units must sold to break even, divide the total fixed cost by the unit contribution margin
be.
Break even Point In Units = Fixed Expenses / Unit contribution Margin
35000Rs. / Rs.100* per unit
350 units
*Rs. 250 (sales) – Rs. 150 (variable Exp.)
A variation of this method uses the Contribution Margin Ration (CM ratio) instead of the unit
Contribution margin. The result is the break even in total sales dollars rather than in total units
sold.
Break even point in total sales dollars = Fixed Expenses / CM Ratio
= Rs. 35000 / 0.40
= Rs. 87500
This approach is particularly suitable in situation where a company has multiple product lines
and wishes to compute a single break even point for the company as a whole.
20. 20
The following formula is also used to calculate break even point
Break even point in Rupees = [Fixed cost / 1 – (variable cost – Sales)]
This formula can produce the same answer:
Break even point = [Rs. 35000 / 1 – (150/250)]
= Rs. 35000 / 1 – 0.6
= Rs. 35000 / 0.4
= Rs. 87500
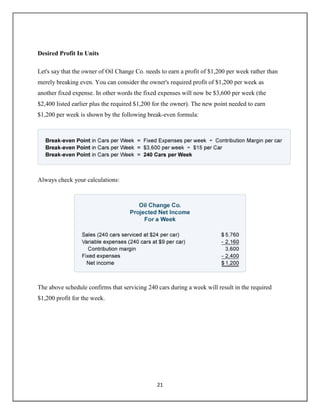
Break-even Point In Units
The break-even point in units for Oil Change Co. is the number of cars it needs to service in
order to cover the company's fixed and variable expenses. The break-even point formula is to
divide the total amount of fixed costs by the contribution margin per car:
It's always a good idea to check your calculations. The following schedule confirms that the
break-even point is 160 cars per week:
21. 21
Desired Profit In Units
Let's say that the owner of Oil Change Co. needs to earn a profit of $1,200 per week rather than
merely breaking even. You can consider the owner's required profit of $1,200 per week as
another fixed expense. In other words the fixed expenses will now be $3,600 per week (the
$2,400 listed earlier plus the required $1,200 for the owner). The new point needed to earn
$1,200 per week is shown by the following break-even formula:
Always check your calculations:
The above schedule confirms that servicing 240 cars during a week will result in the required
$1,200 profit for the week.
22. 22
Break-even Point In Sales Dollars
One can determine the break-even point in sales dollars (instead of units) by dividing the
company's total fixed expenses by the contribution margin ratio.
The contribution margin ratio is the contribution margin divided by sales (revenues)
The ratio can be calculated using company totals or per unit amounts. We will compute the
contribution margin ratio for the Oil Change Co. by using its per unit amounts:
The break-even point in sales dollars for Oil Change Co. is:
The break-even point of $3,840 of sales per week can be verified by referring back to the break-
even point in units. Recall there were 160 units necessary to break-even. At $24 per unit the
necessary sales in dollars would be $3,840.
23. 23
Desired Profit In Sales Dollars
Let's assume a company needs to cover $2,400 of fixed expenses each week plus earn $1,200 of
profit each week. In essence the company needs to cover the equivalent of $3,600 of fixed
expenses each week.
Presently the company has annual sales of $100,000 and its variable expenses amount to $37,500
per year. These two facts result in a contribution margin ratio of 62.5%:
The amount of sales necessary to give the owner a profit of $1,200 per week is determined by
this break-even point formula:
To verify that this answer is reasonable, we prepared the following schedule:
24. 24
As you can see, for the owner to have a profit of $1,200 per week or $62,400 per year, the
company's annual sales must triple. Presently the annual sales are $100,000 but the sales need to
be $299,520 per year in order for the annual profit to be $62,400.
25. 25
BIBILOGRAPHY
1. Icai Costing Book (Marginal Cost)
2. Break even Analysis Document By Emmanuel (Scribd)
3. M.com Part- 1 Advanced Cost Accounting Book By Ainapure