Downloaded 622 times
![Frequency response of a linear system
Consider a stable linear system whose transfer function is given by
Y (s)
G(s) =
U (s)
For a sinusoidal input u(t) = Asinωt, the output of the system is given by
y(t) = Y sin(ωt + φ)
where
Y = A|G(jω)|
Im[G(jω)]
φ = ∠G(jω) = tan−1
Re[G(jω)]
A stable linear system subjected to a sinusoidal input will, at steady state, have a
sinusoidal output of the same frequency as the input. But the amplitude and phase
of output will, in general, be different from those of the input.
September 6, 2011 Control Systems Laboratory, IIT Kanpur Page 3](https://image.slidesharecdn.com/bodelect-130422045432-phpapp01/75/Bode-lect-3-2048.jpg)
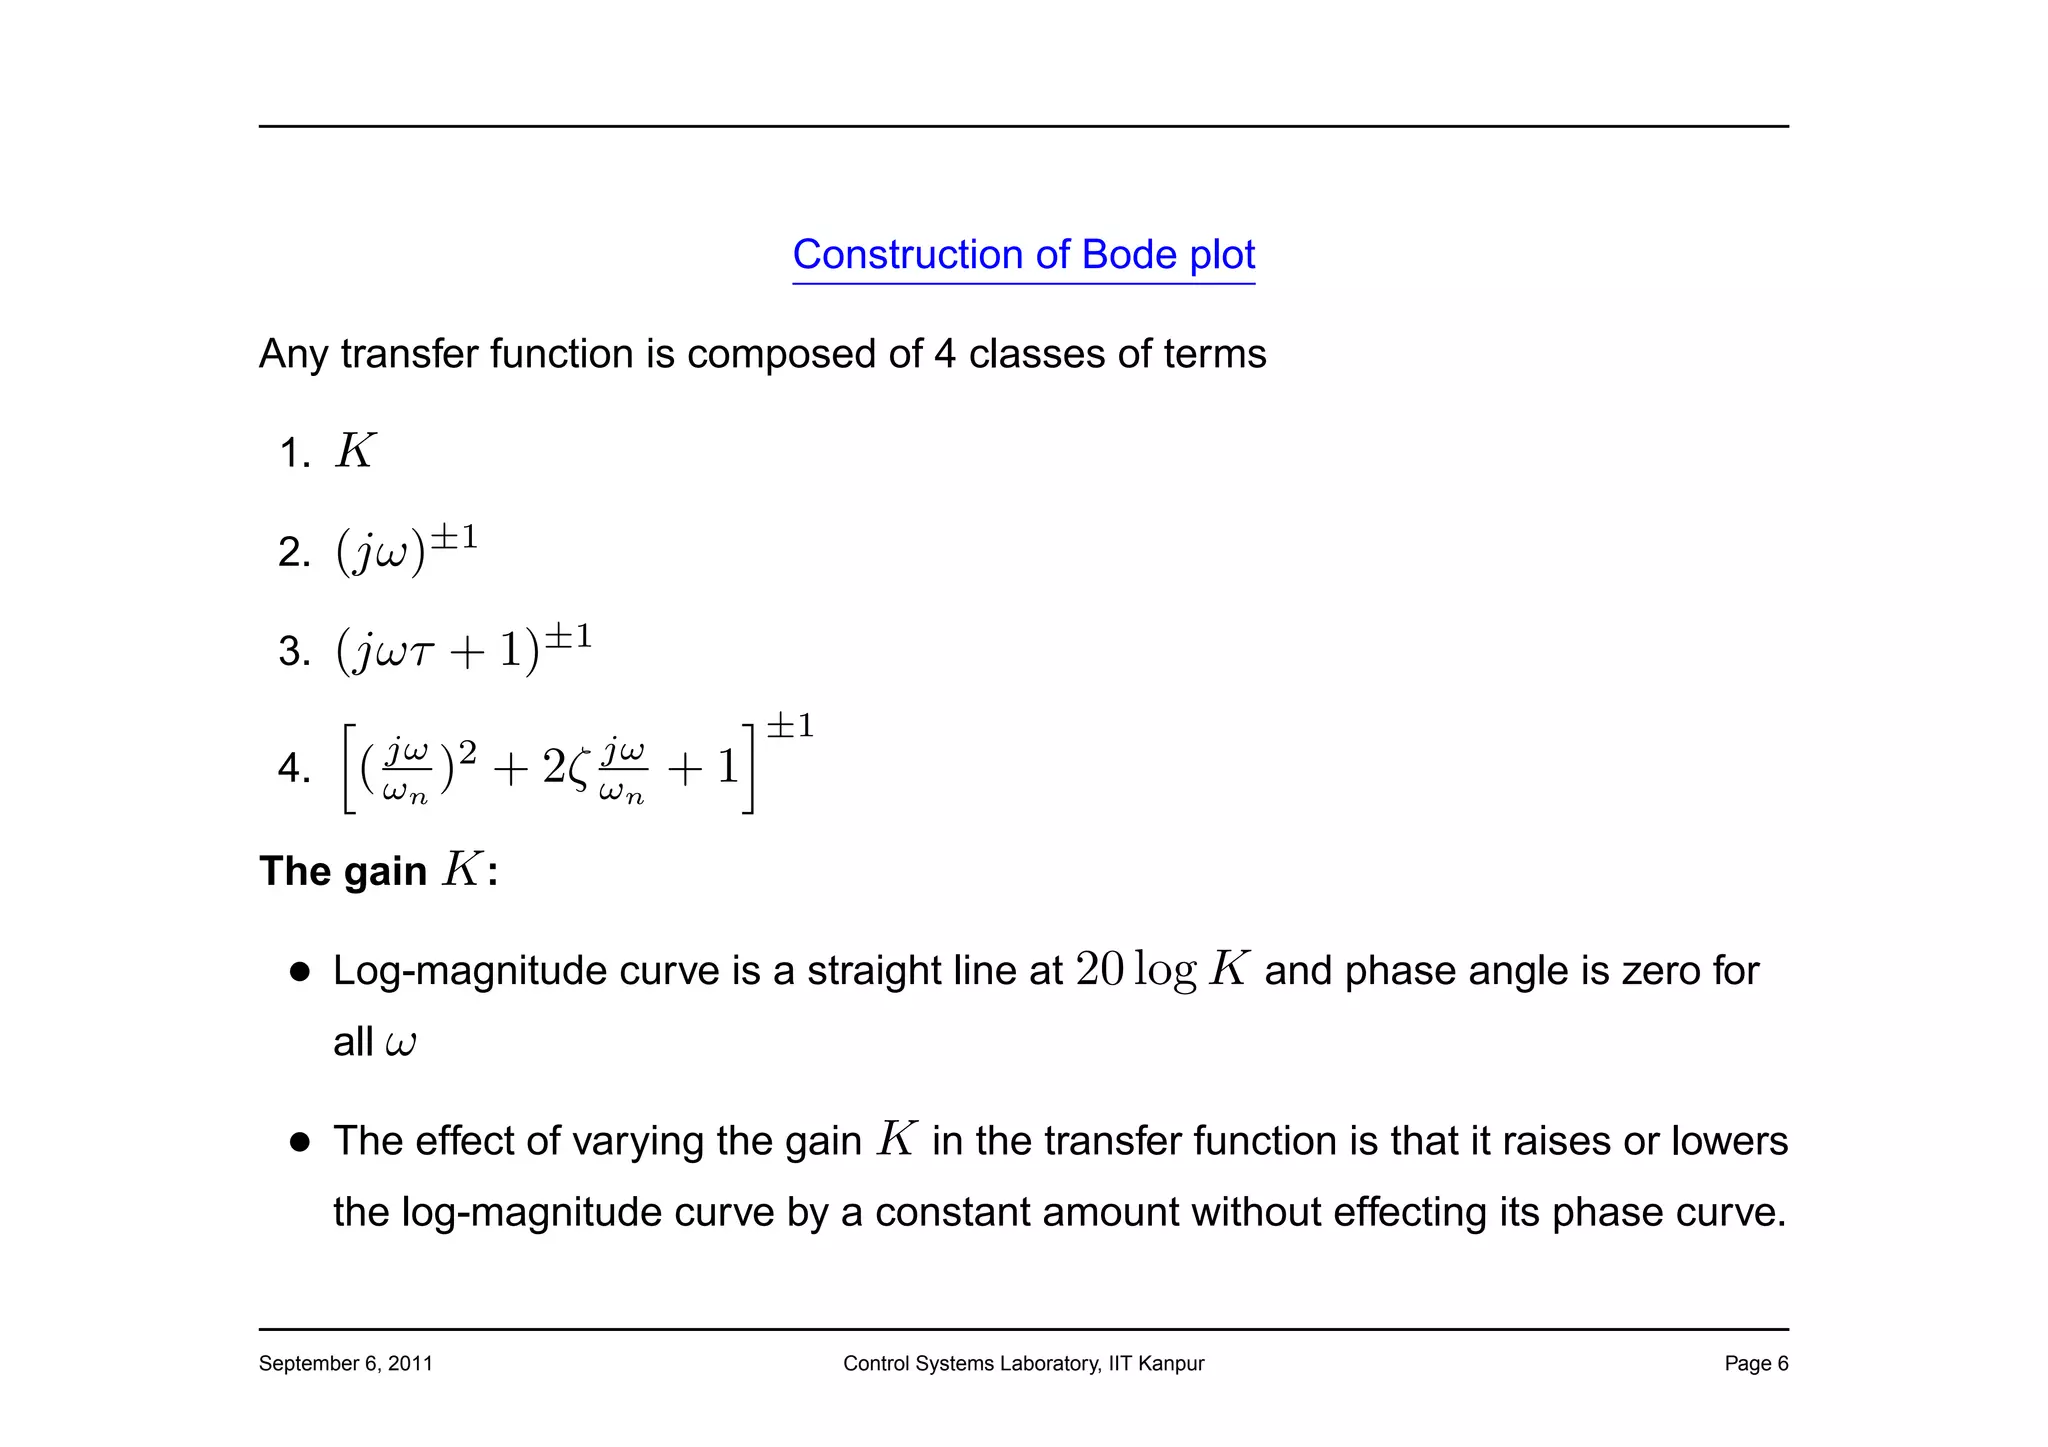
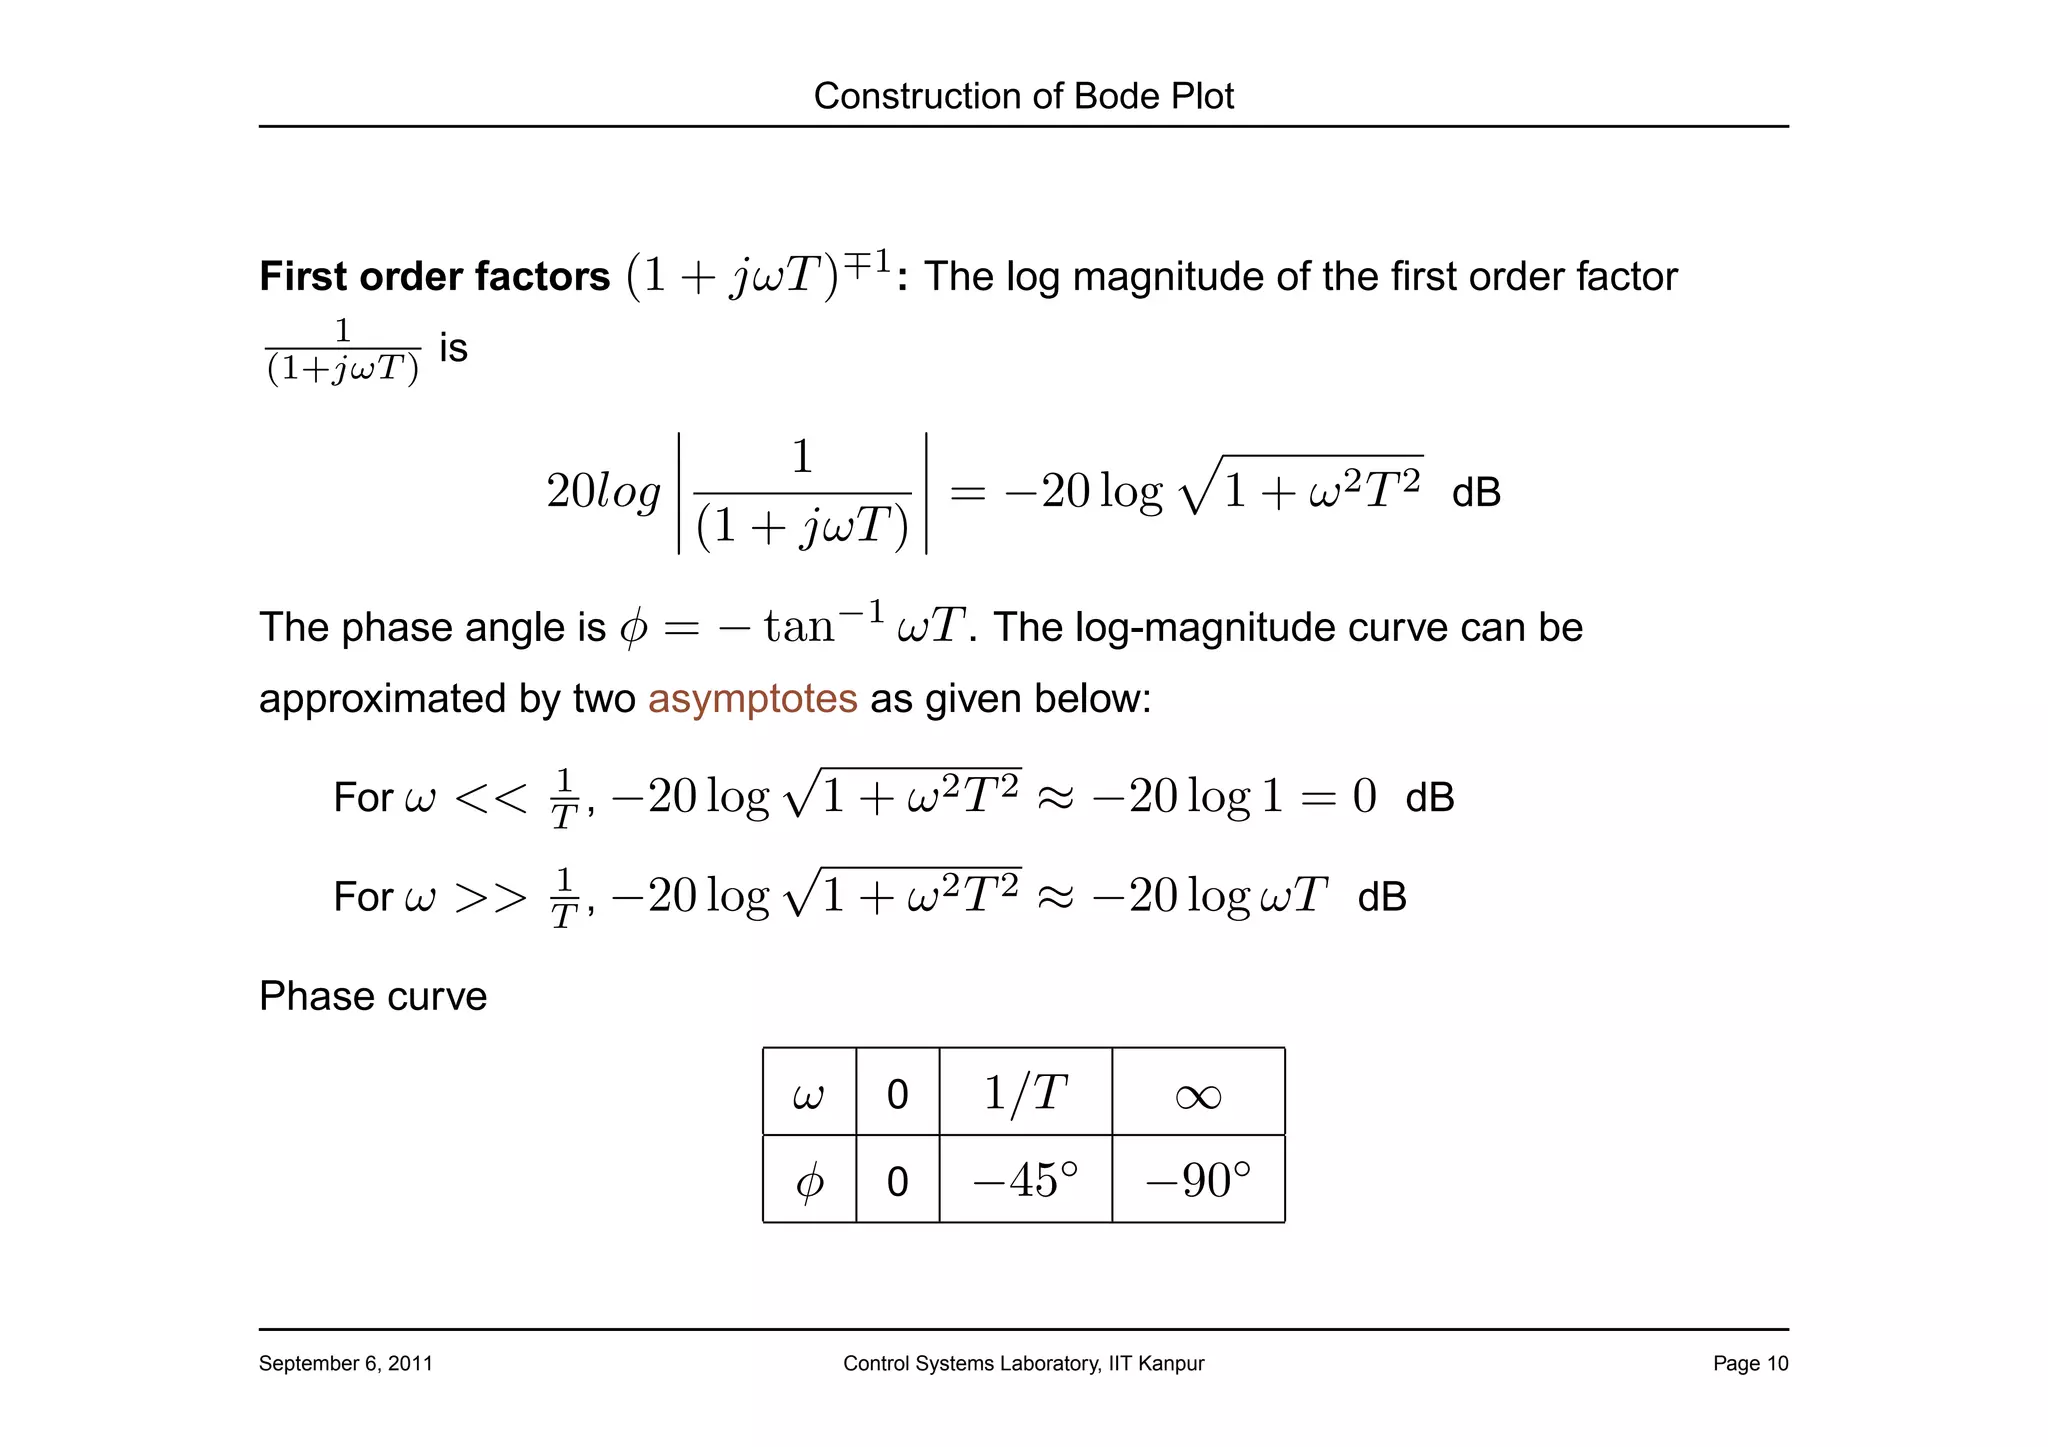
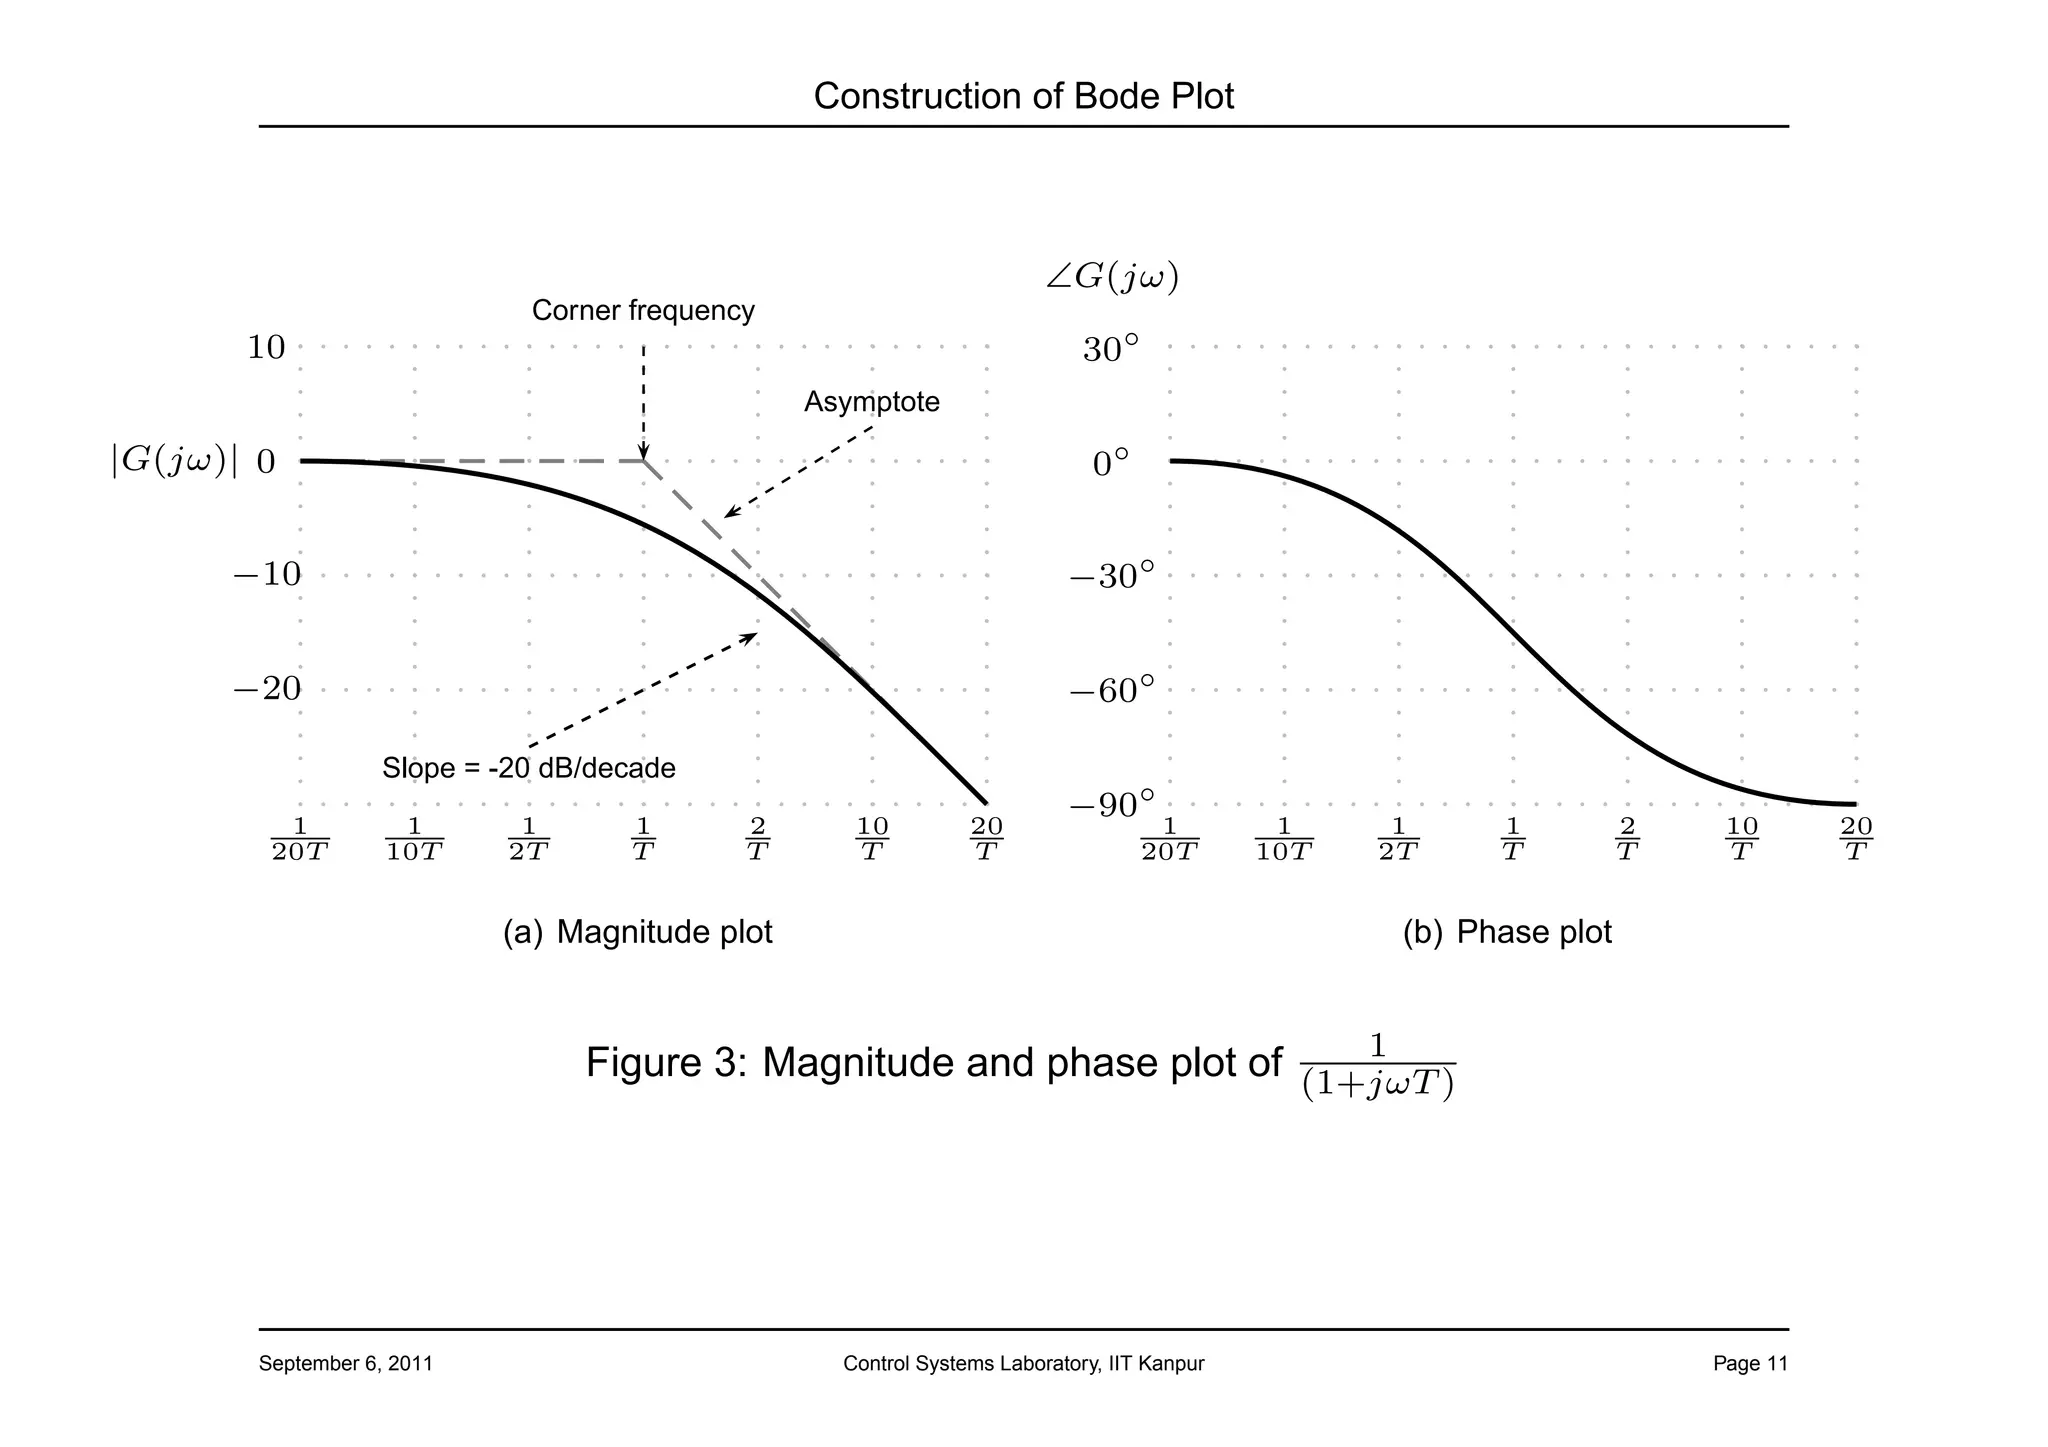
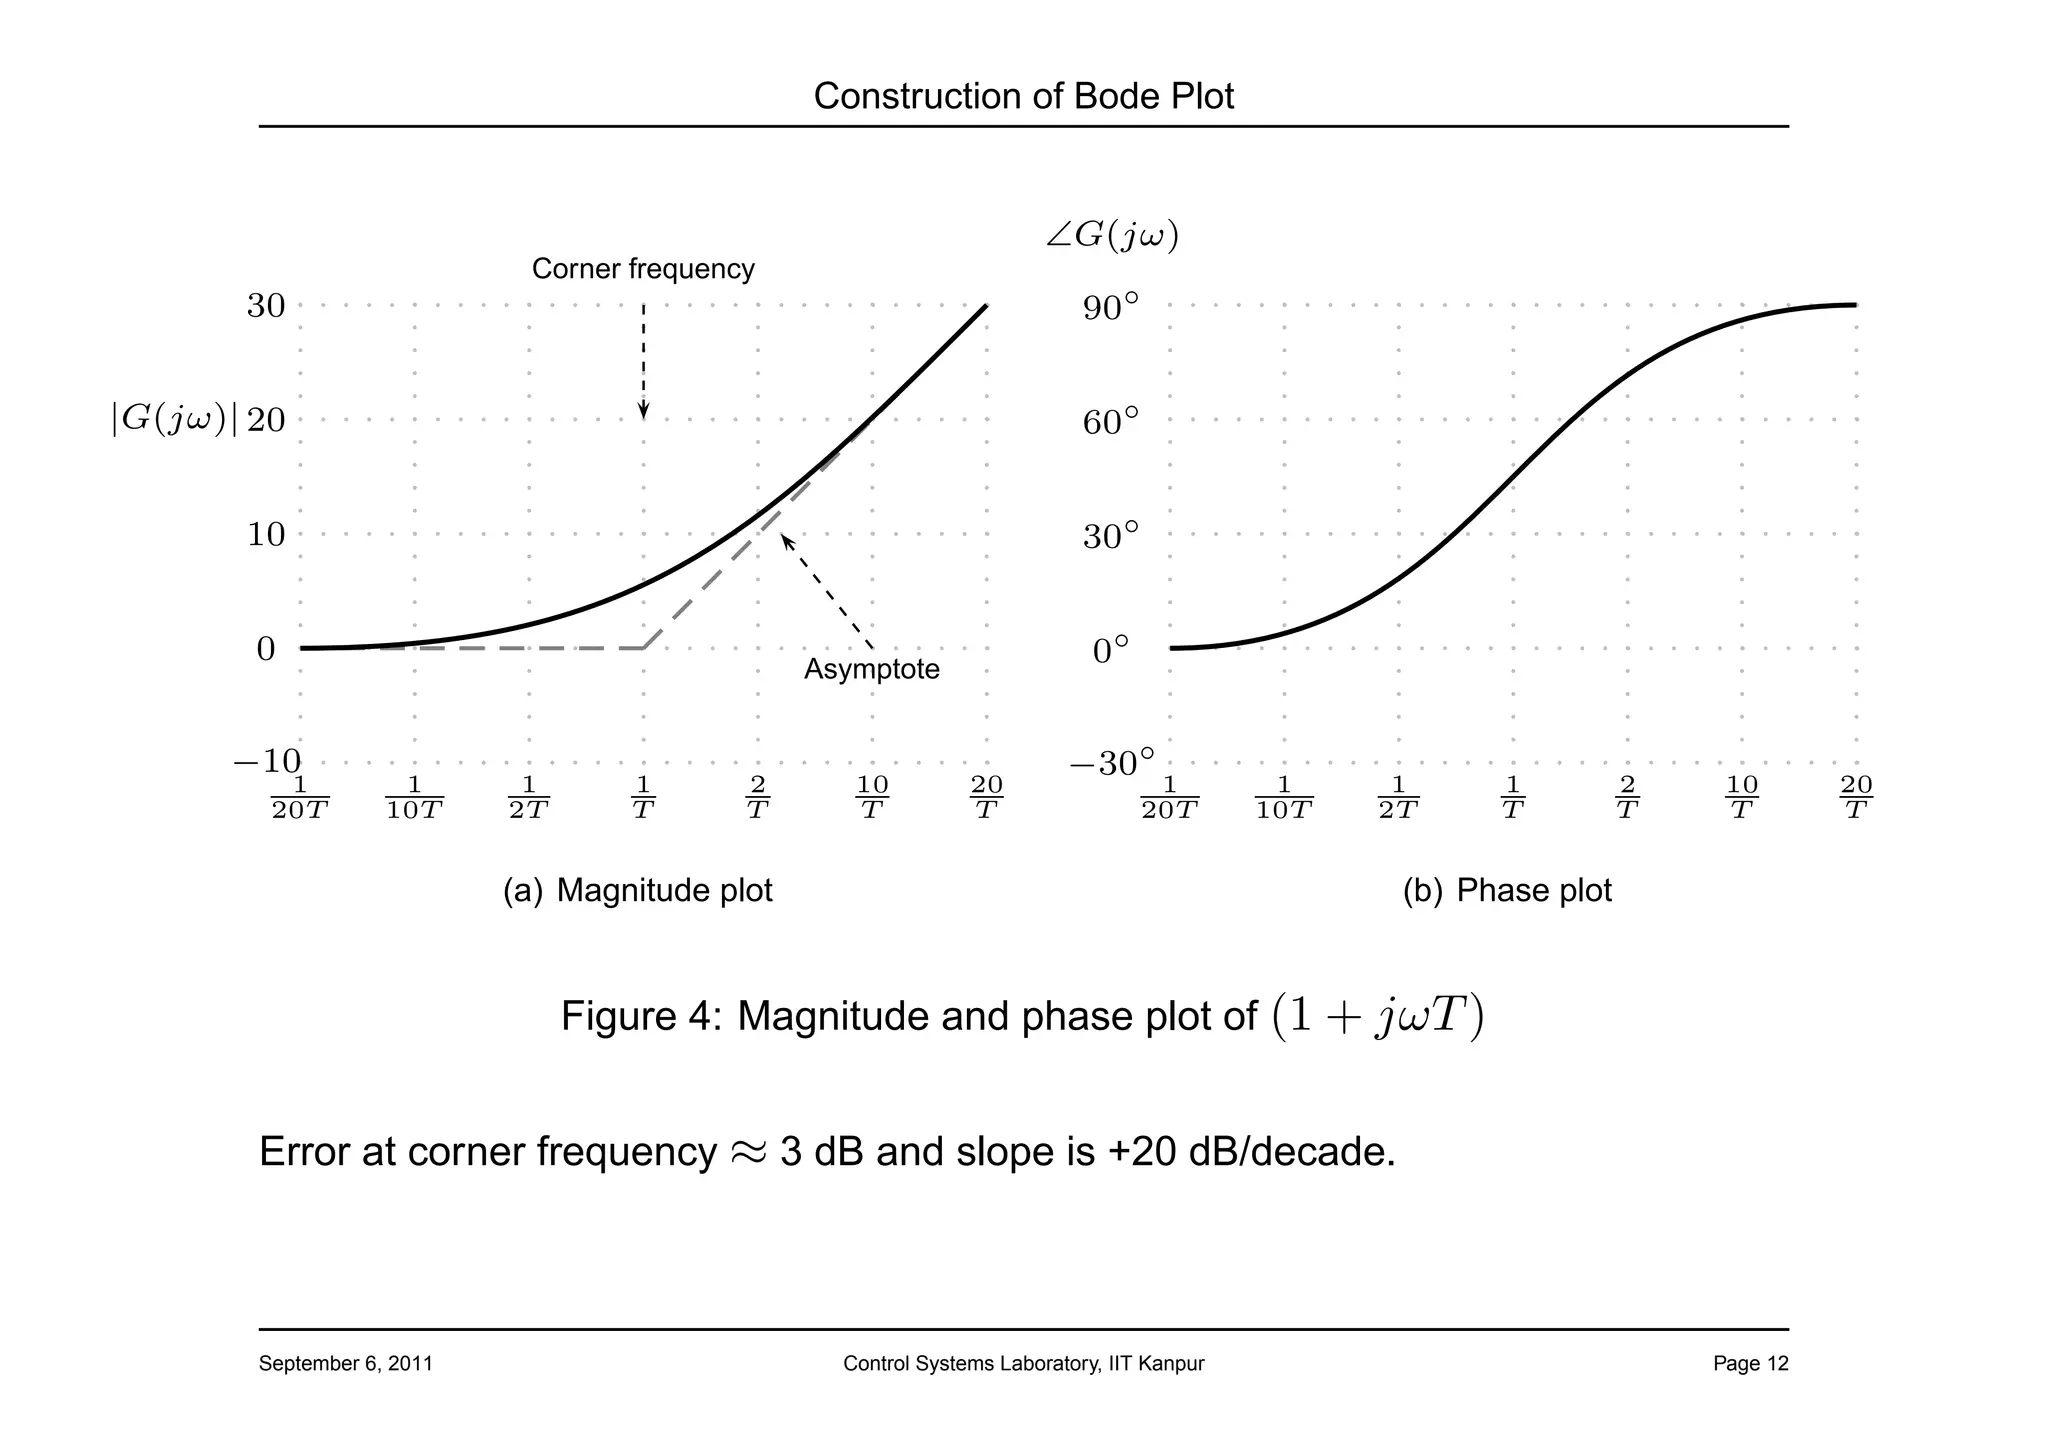
![Construction of Bode Plot
2
ω ω
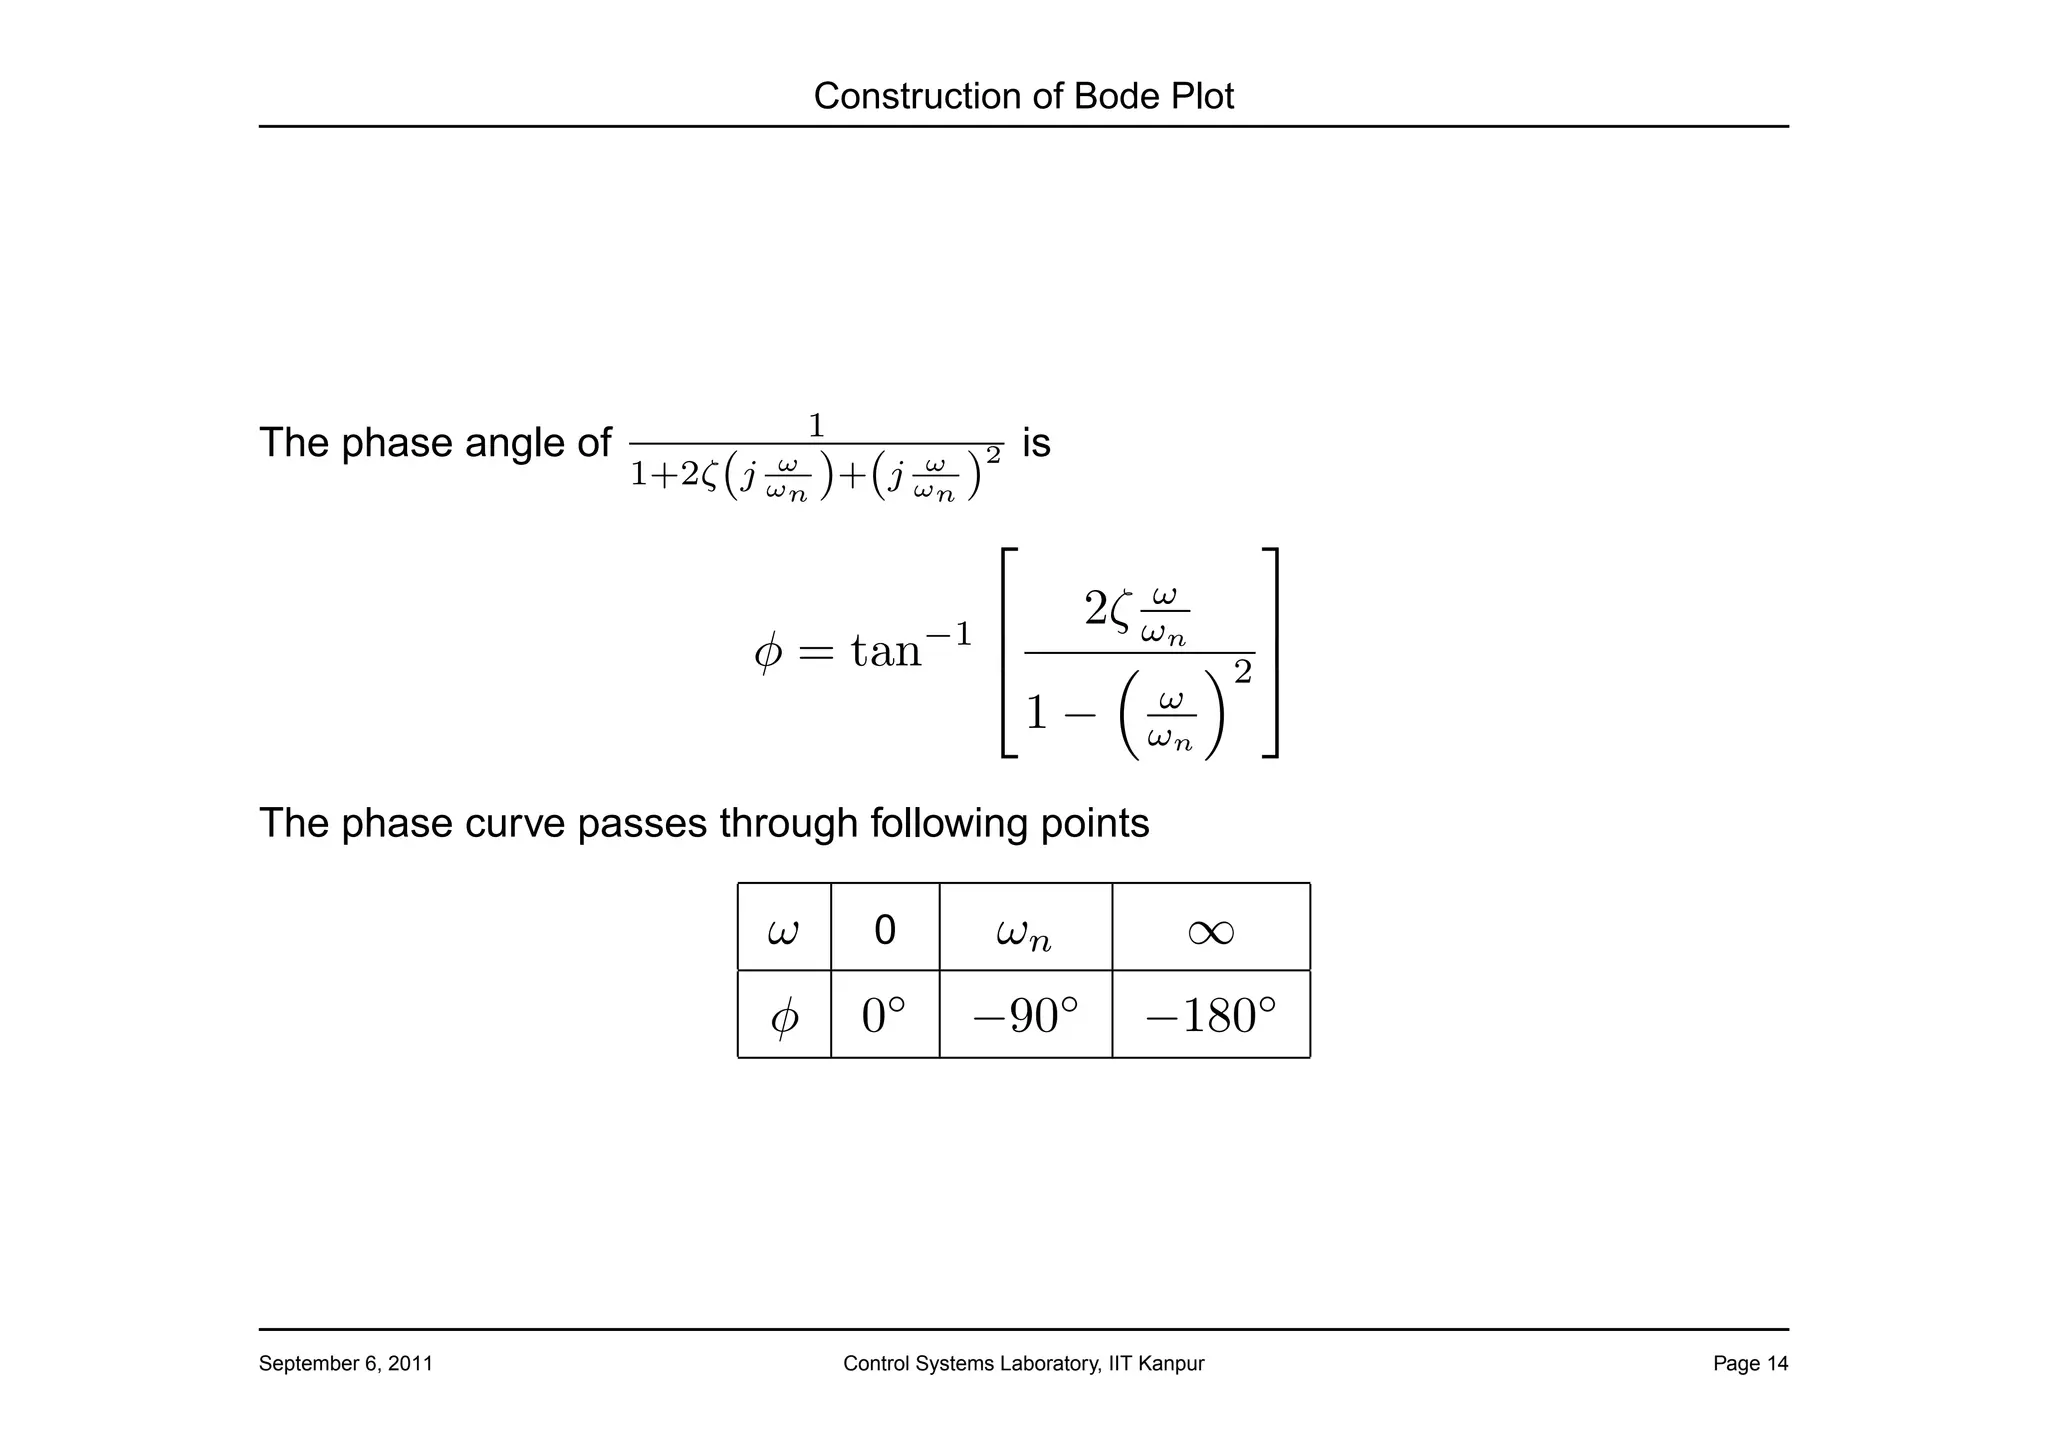
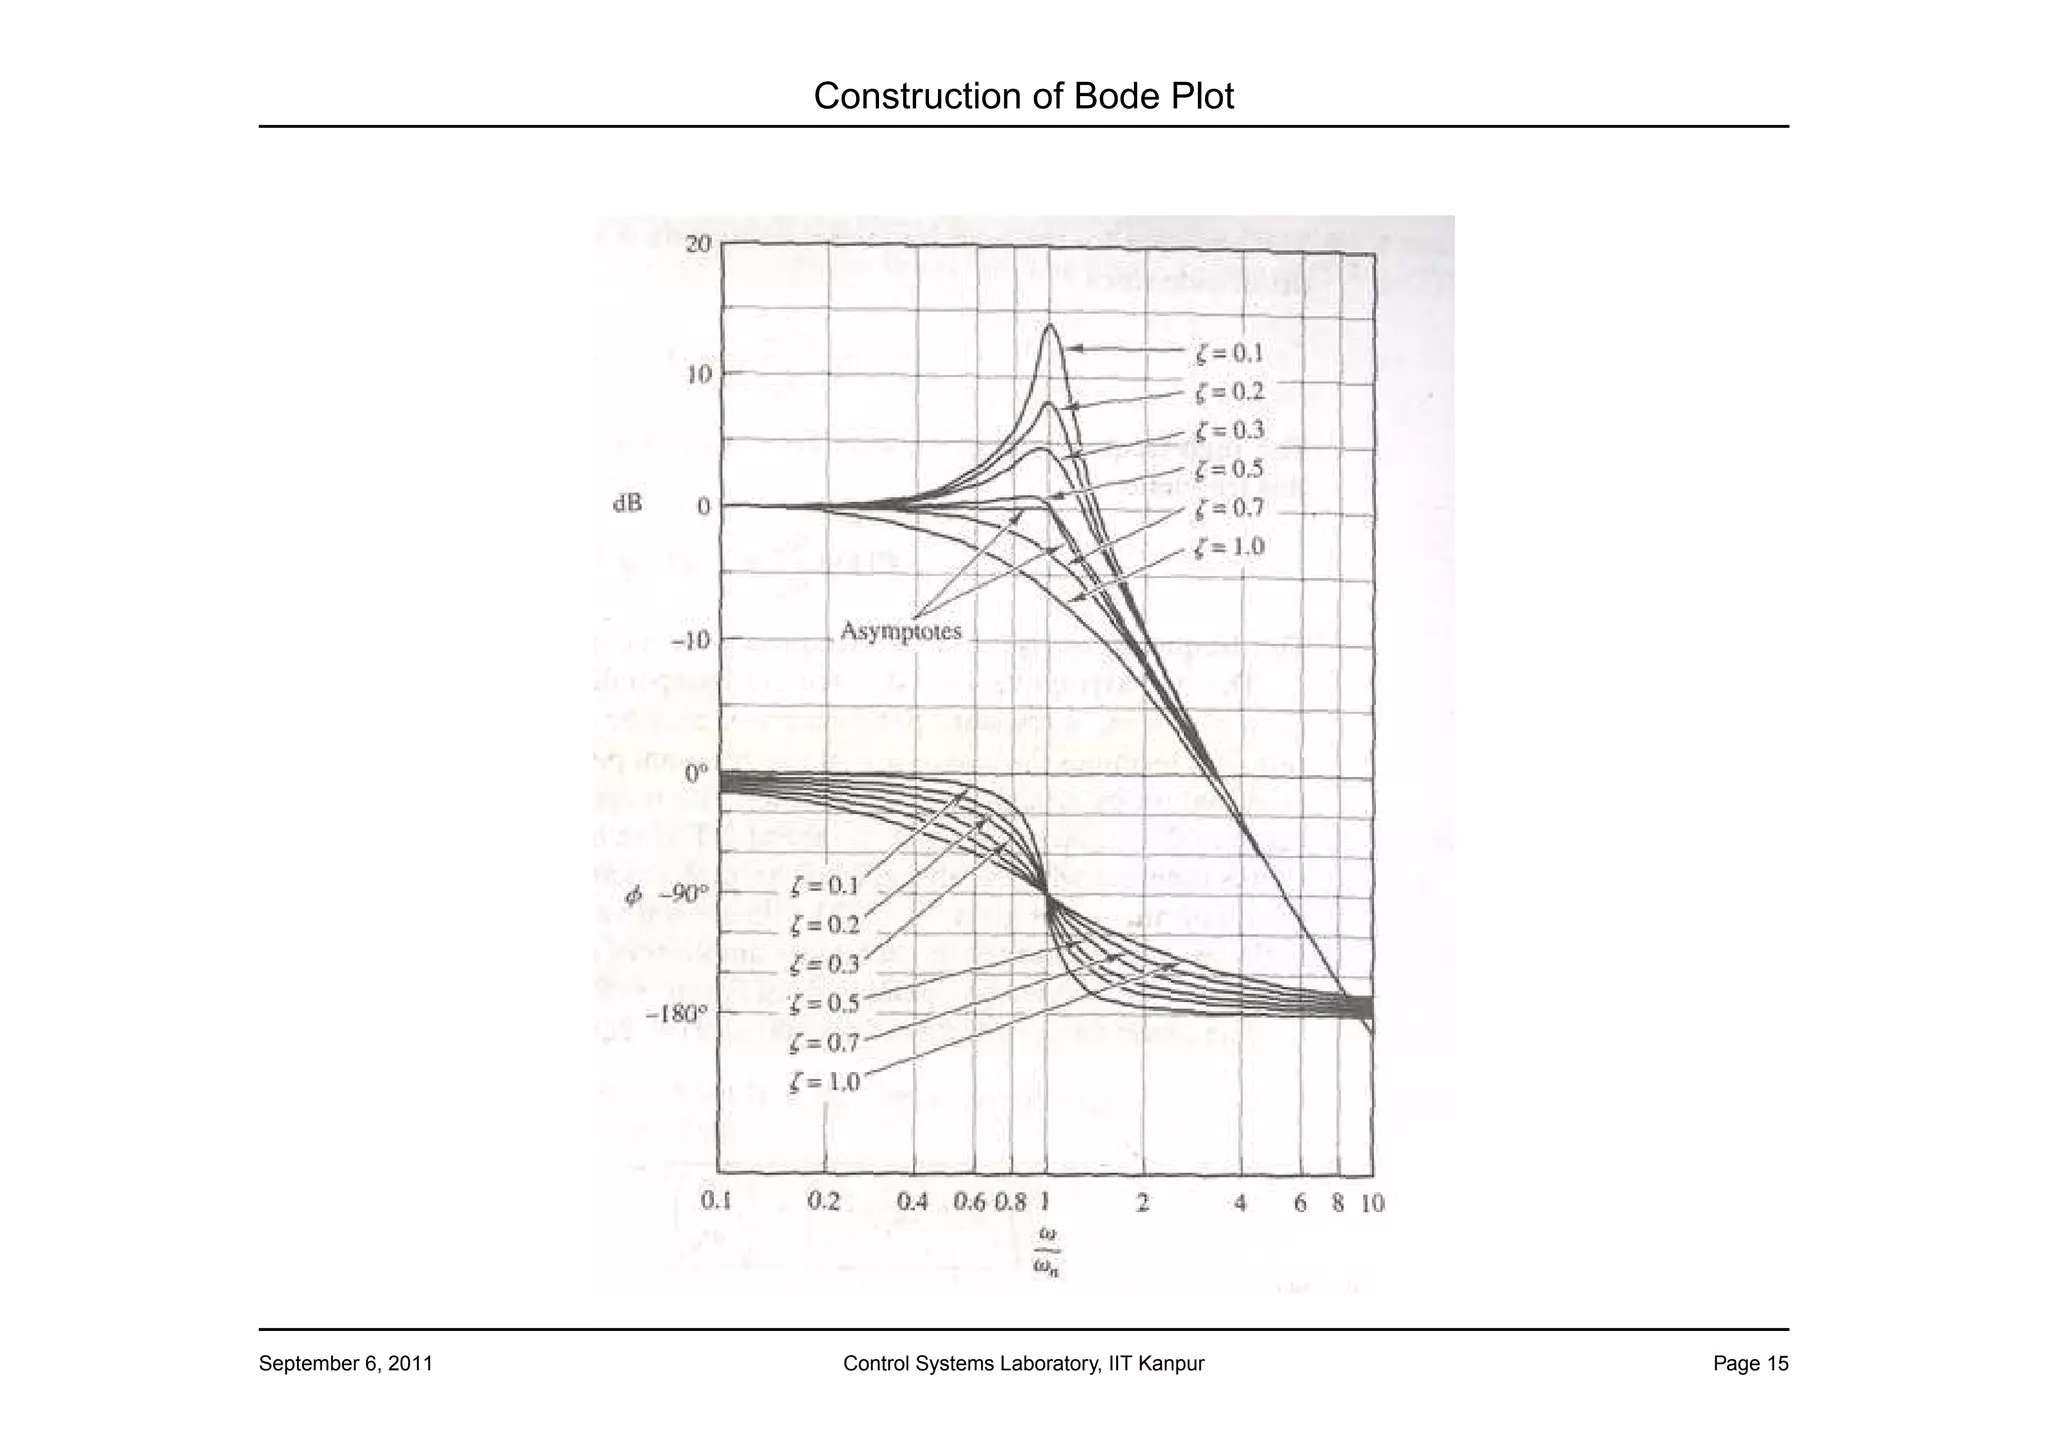
Quadratic factors [1 + 2ζ j ωn + j ωn ]∓1 : The log-magnitude curve for
2
ω ω
1/(1 + 2ζ j ωn + j ωn ) is given by
2 2
1 ω2 ω
20 log 2 = −20 log 1− 2 + 2ζ
ω ω ωn ωn
1 + 2ζ j ωn + j ωn
The asymptotic frequency-response curve may be obtained by making following
approximations:
For ω << ωn , log-magnitude = −20 log 1 = 0 dB
ω2 ω
For ω >> ωn , log-magnitude = −20 log 2
ωn = −40 log ωn dB
At corner frequency ω = ωn , the resonant peak occurs and its magnitude depends
on damping ratio ζ .
September 6, 2011 Control Systems Laboratory, IIT Kanpur Page 13](https://image.slidesharecdn.com/bodelect-130422045432-phpapp01/75/Bode-lect-13-2048.jpg)
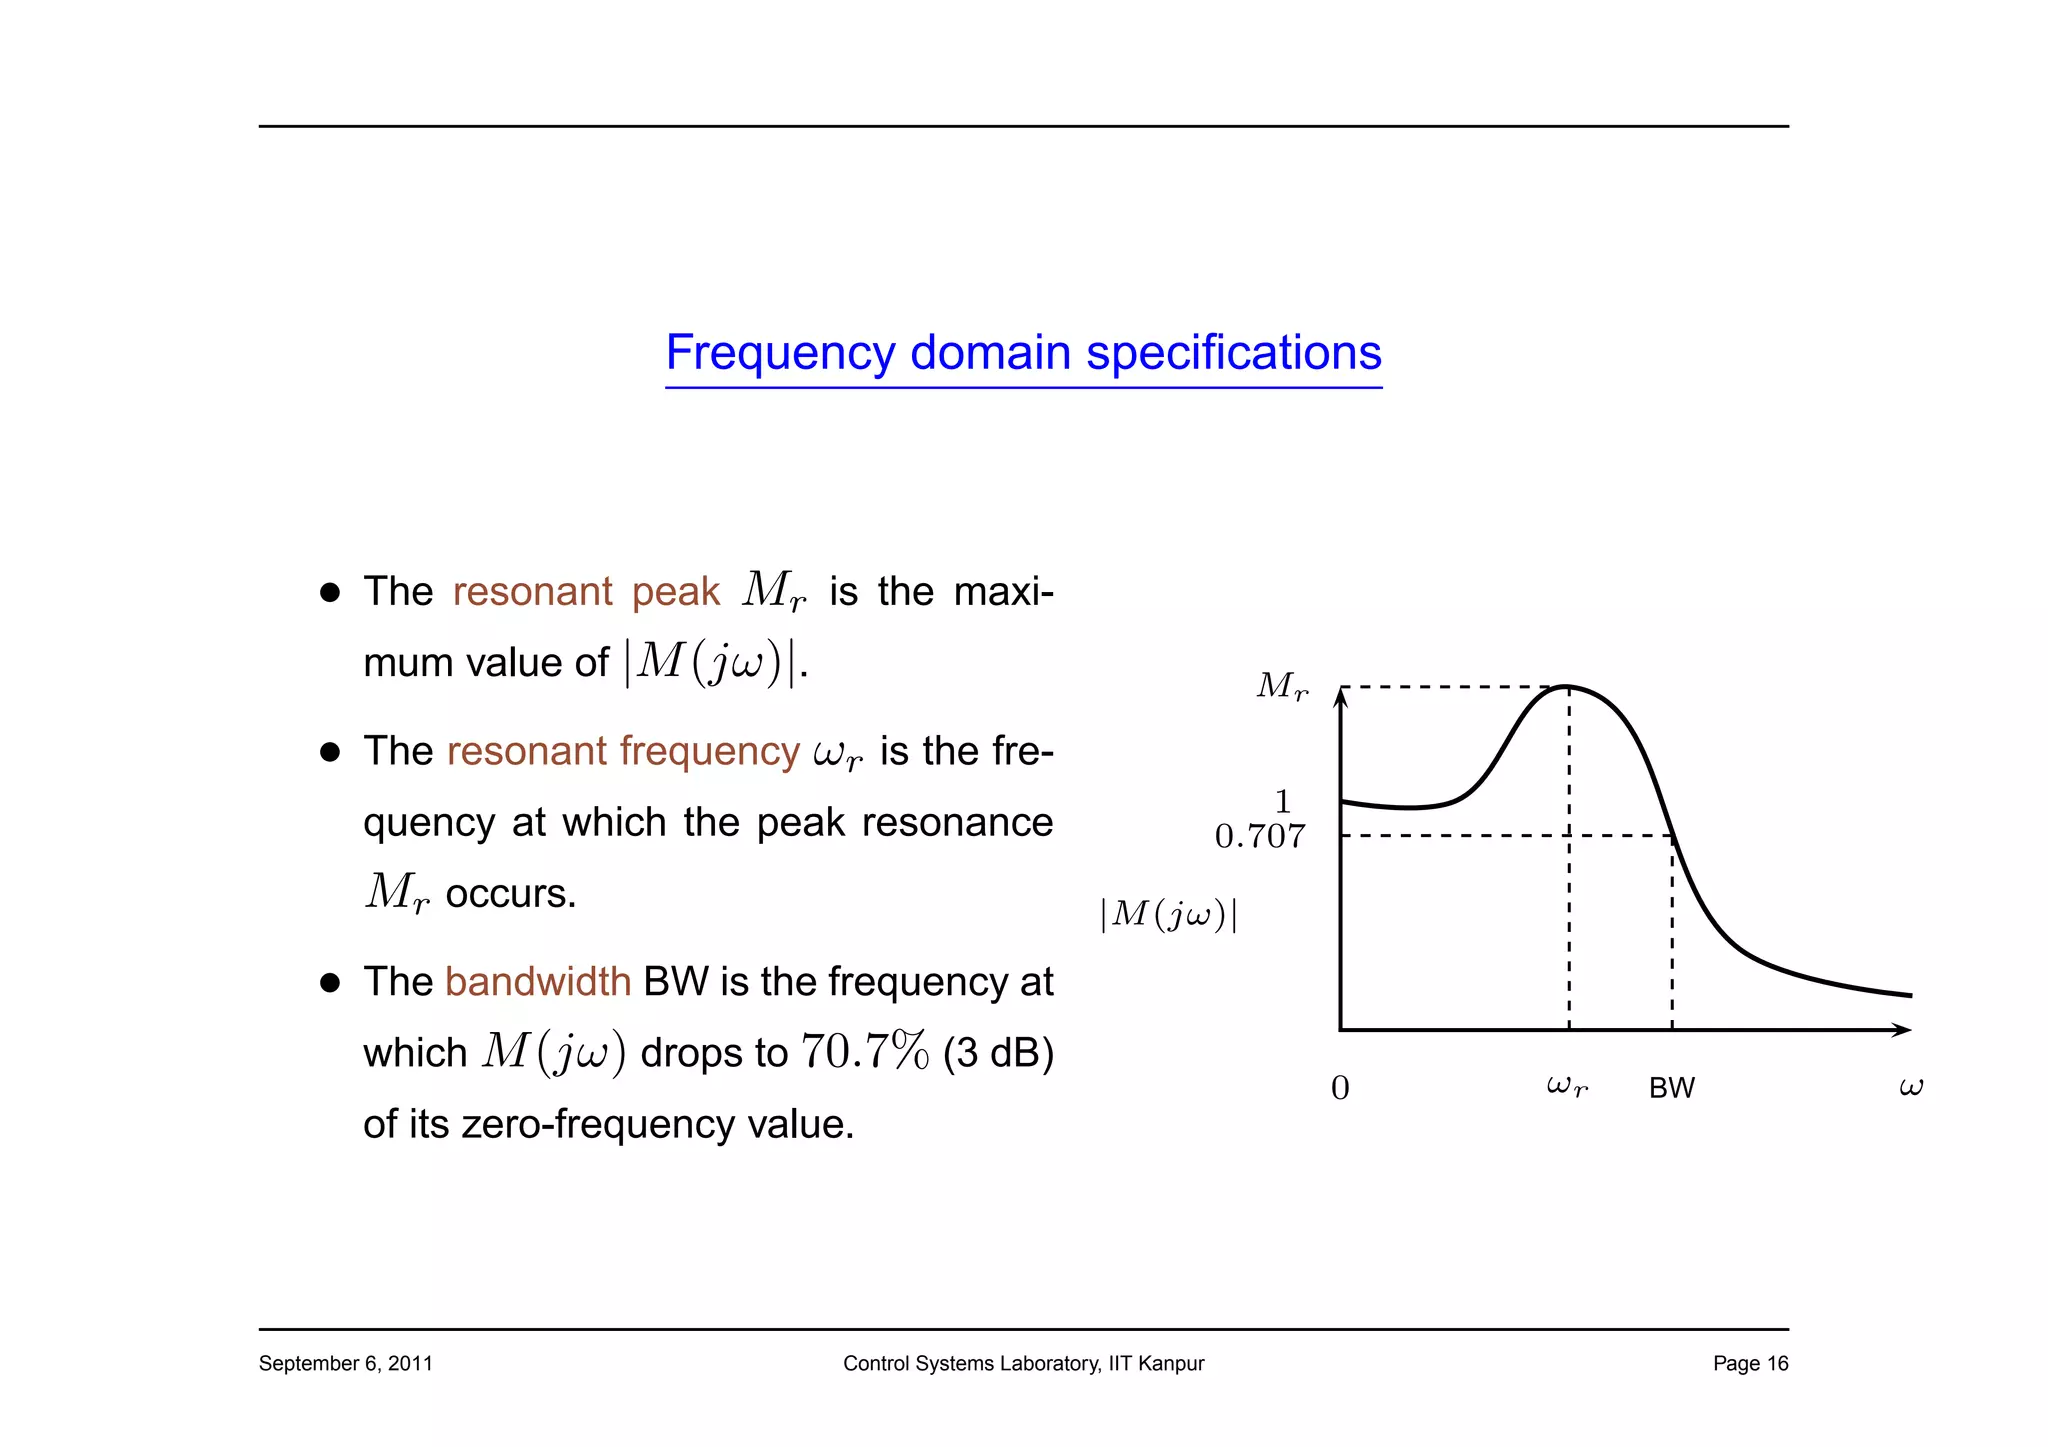
![Frequency domain specification
For a second order system, following relationships between frequency and
time-domain responses can be obtained.
Resonant Frequency: 10
ωr = ωn 1 − 2ζ 2 8
Mr in dB
Resonant Peak: 6
1 0.707
Mr = |G(jω)|max = |G(jωr )| = 4
2ζ 1− ζ2
2
for 0
≤ ζ ≤ 0.707. For ζ > 0.707, ωr = 0 and
Mr = 1
0 0.2 0.4 0.6 0.8 1.0
Bandwith: ζ
BW = ωn [(1 − 2ζ 2 ) + (ζ 4 − 4ζ 2 + 2)]1/2 = [ωr +
2
ωr + ωn ]1/2
4 4
September 6, 2011 Control Systems Laboratory, IIT Kanpur Page 17](https://image.slidesharecdn.com/bodelect-130422045432-phpapp01/75/Bode-lect-17-2048.jpg)
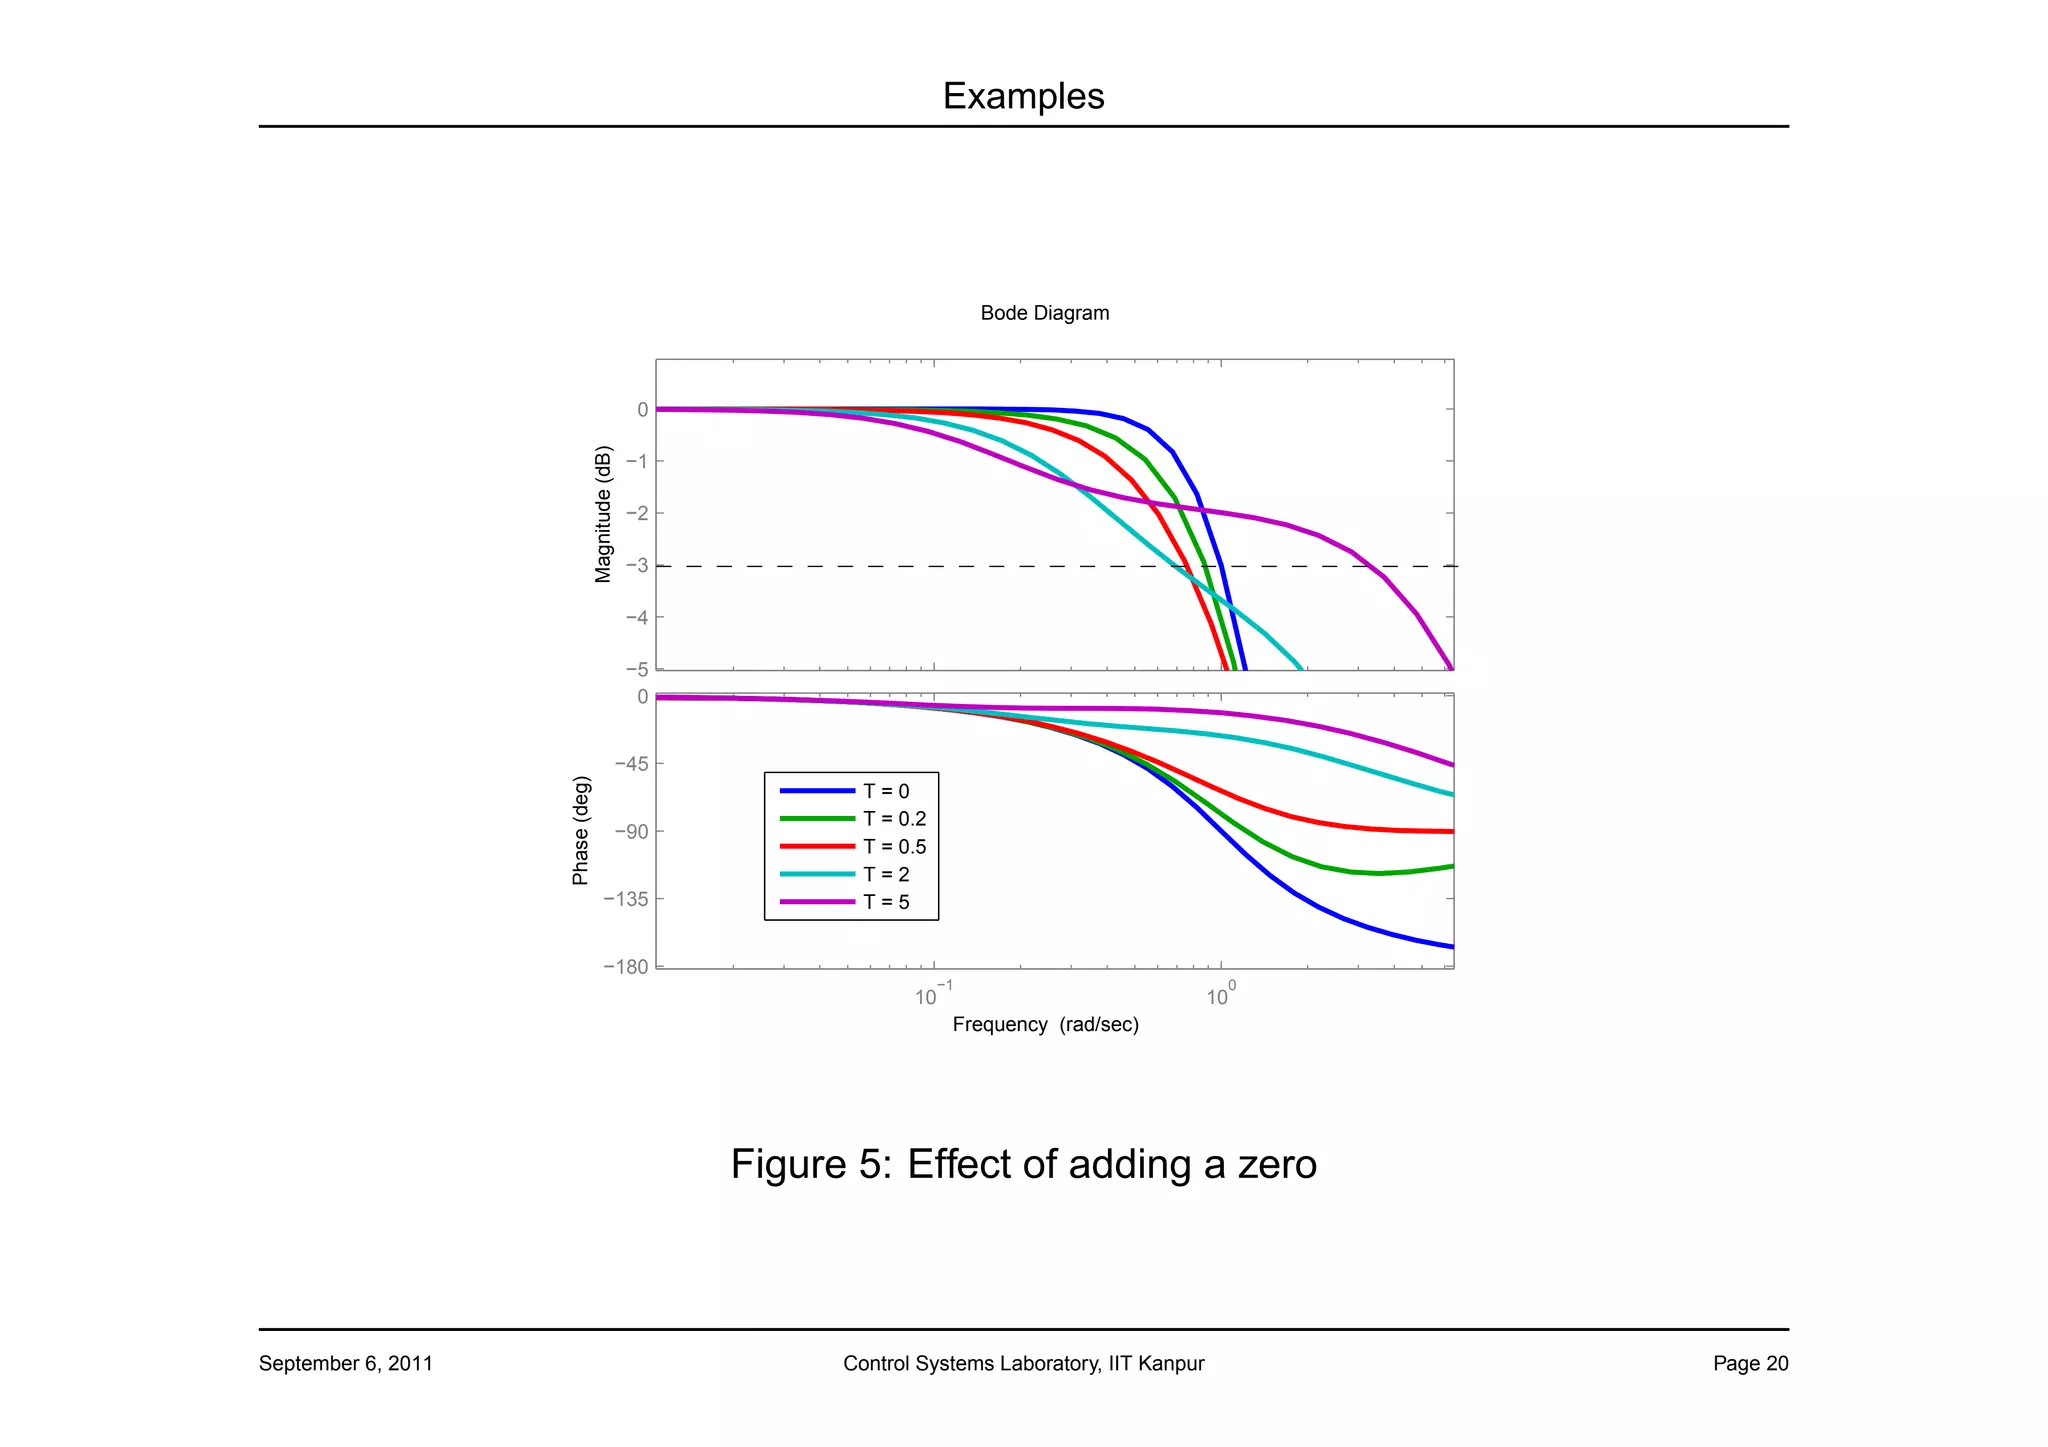


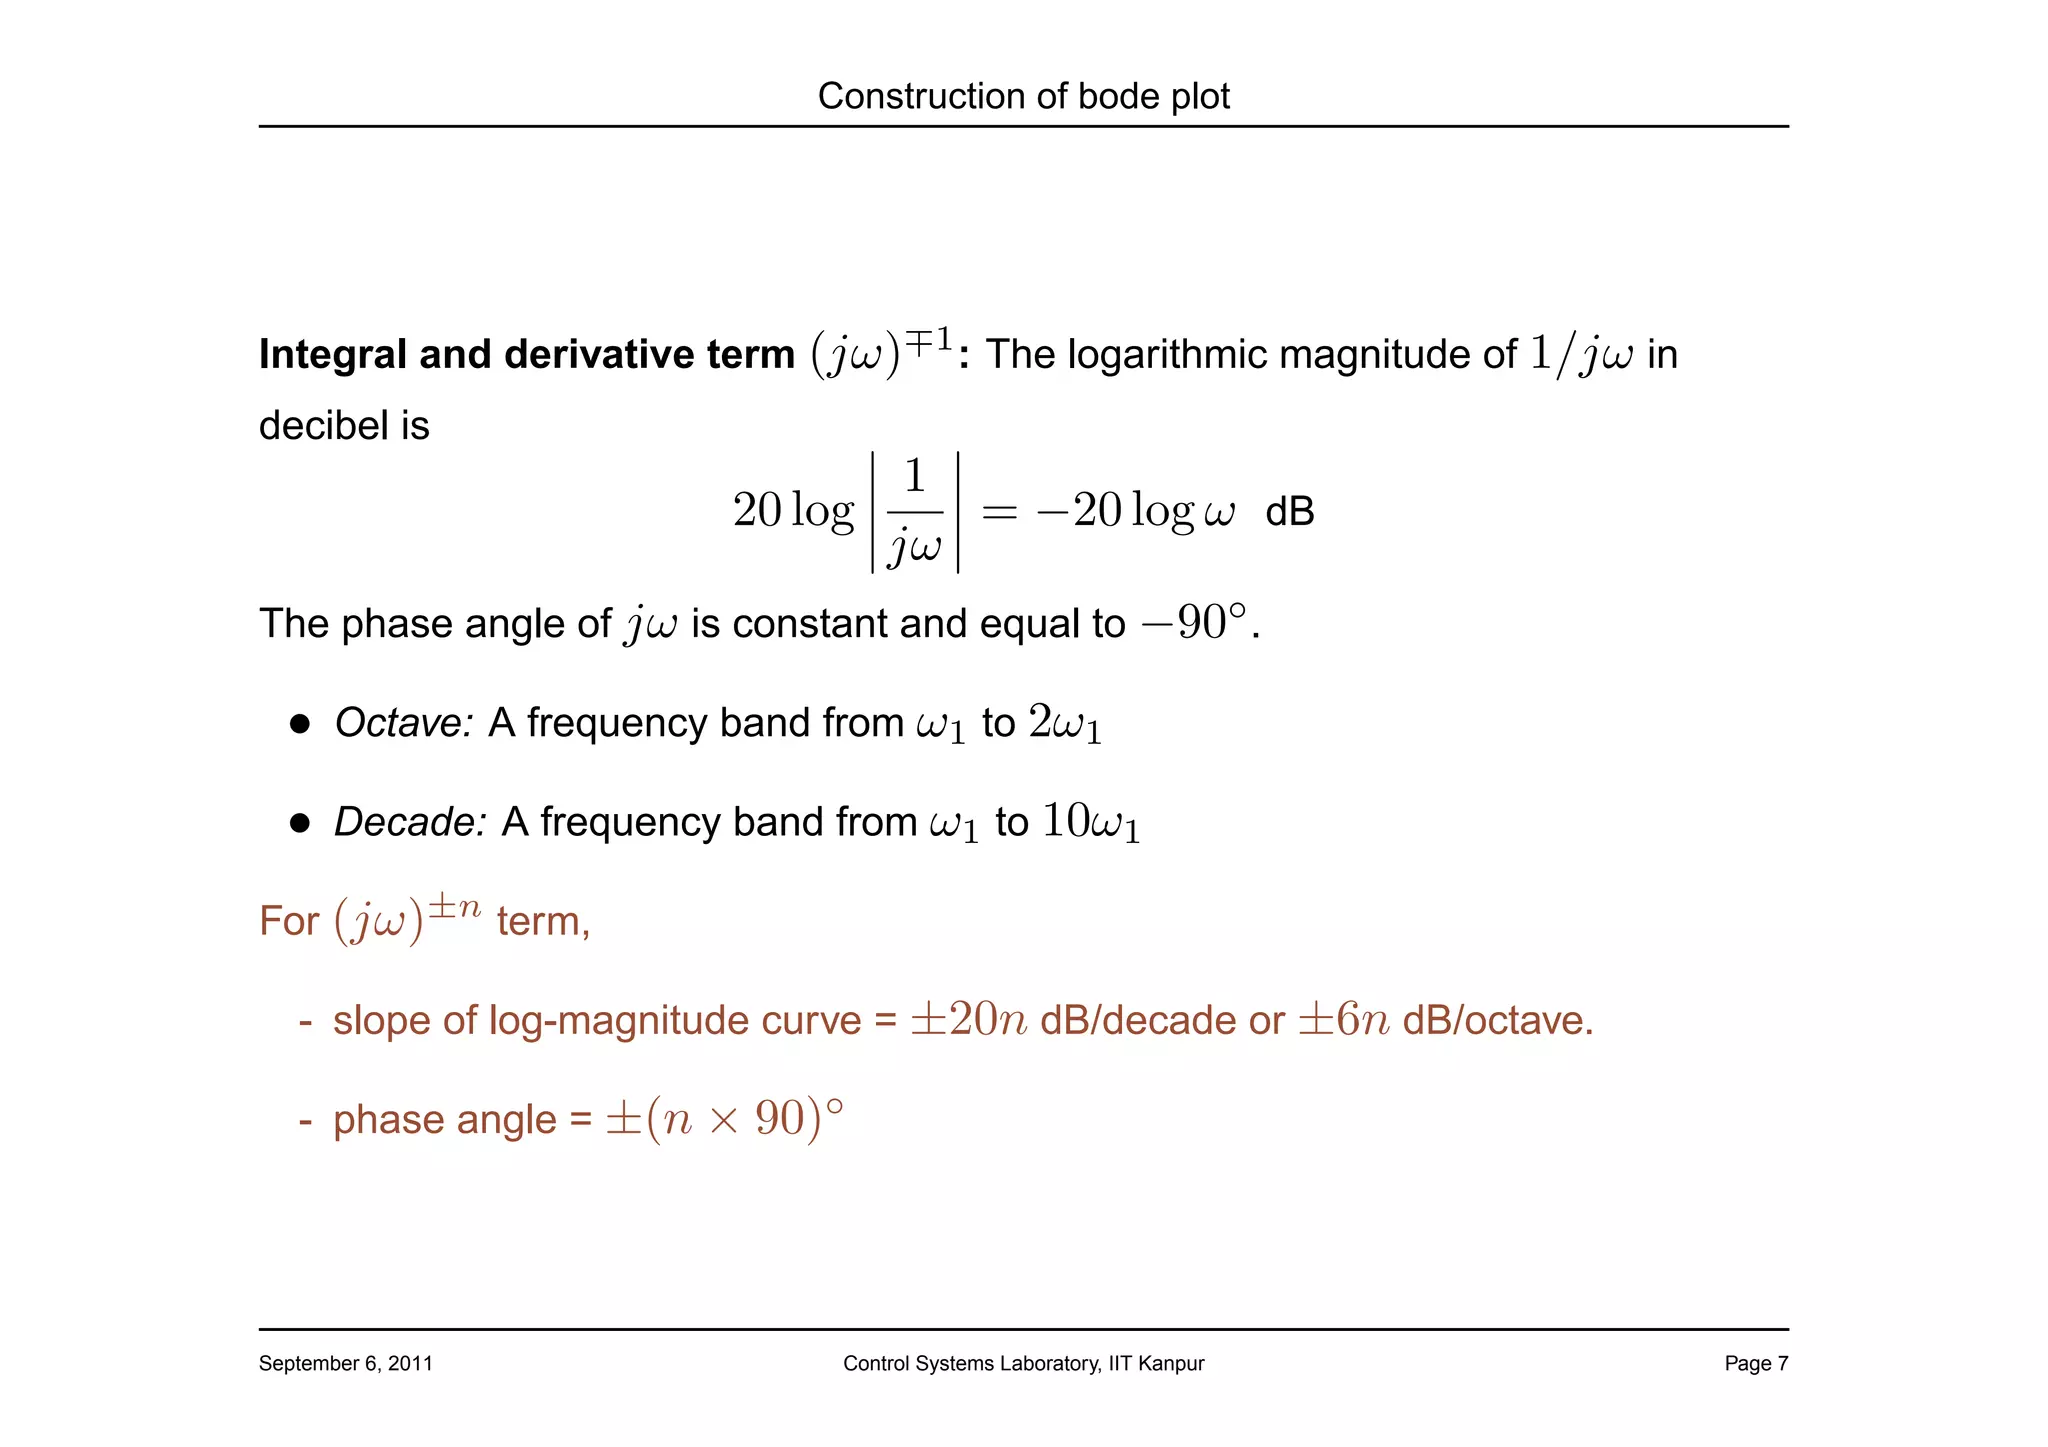
The document discusses frequency domain analysis using Bode plots. It covers topics such as the frequency response of linear systems, construction of Bode plots, and how different system elements like gains, poles, and zeros affect the Bode plot. Specifically, it describes how integral and derivative terms result in slopes of ±20dB/decade on the magnitude plot and ±90° on the phase plot. First-order factors produce asymptotes with corner frequencies and phase shifts from 0° to -90°.


![Circuit Network Analysis - [Chapter5] Transfer function, frequency response, ...](https://cdn.slidesharecdn.com/ss_thumbnails/ch5-150613063859-lva1-app6891-thumbnail.jpg?width=640&height=640&fit=bounds)


![Circuit Network Analysis - [Chapter4] Laplace Transform](https://cdn.slidesharecdn.com/ss_thumbnails/ch4-150613063858-lva1-app6891-thumbnail.jpg?width=640&height=640&fit=bounds)


