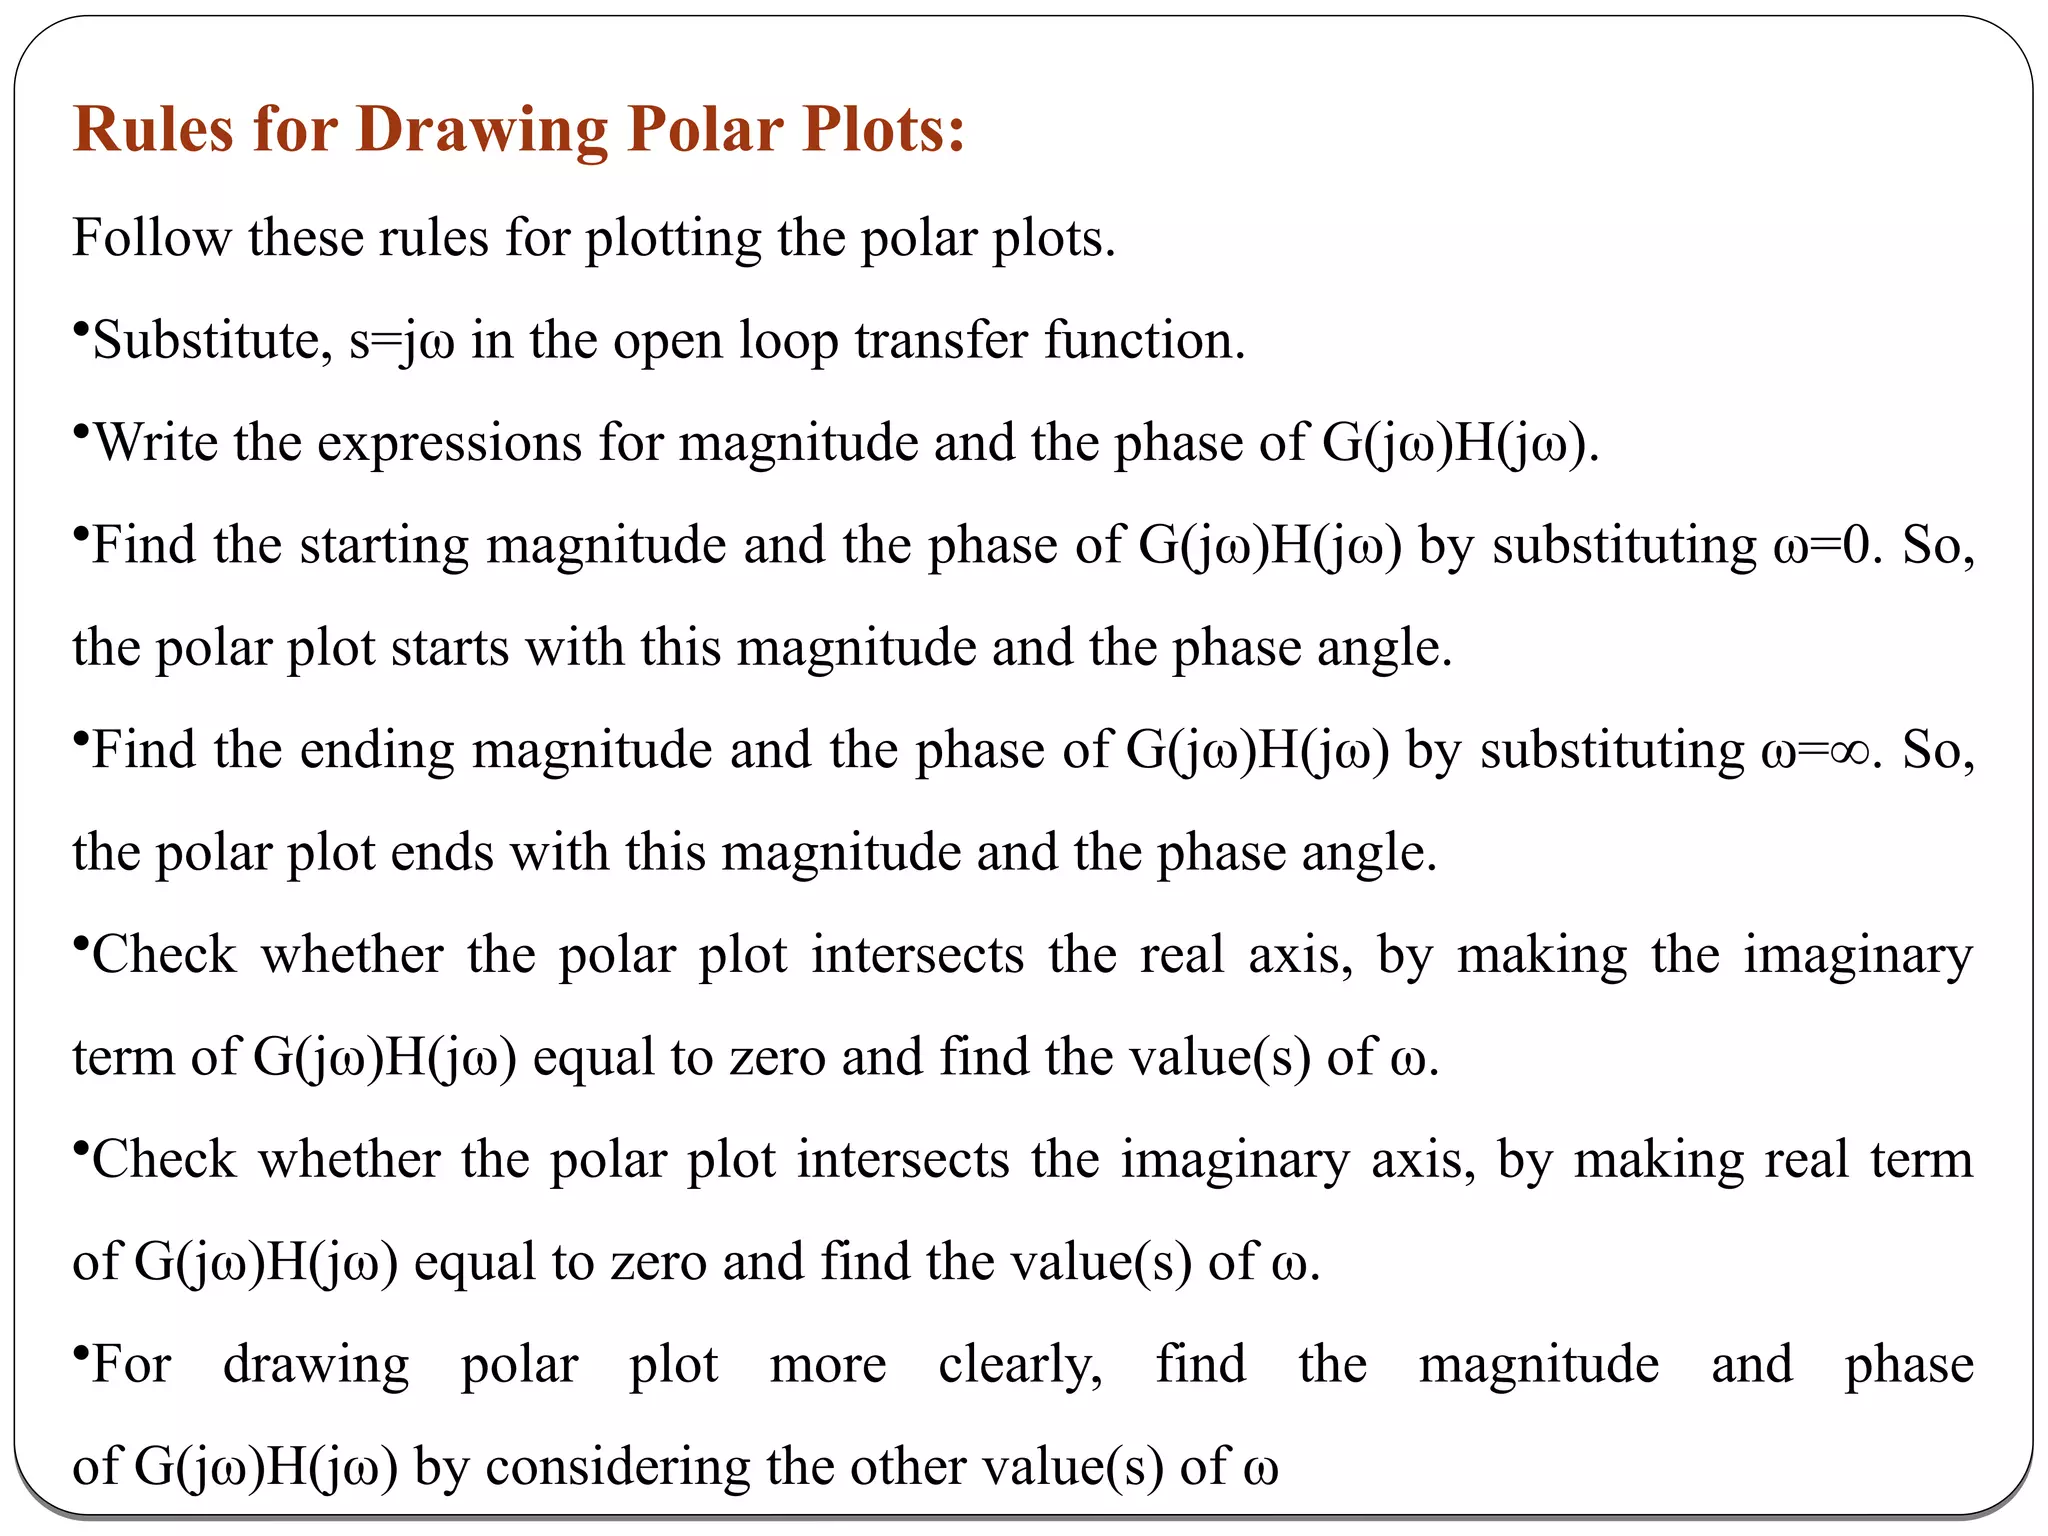
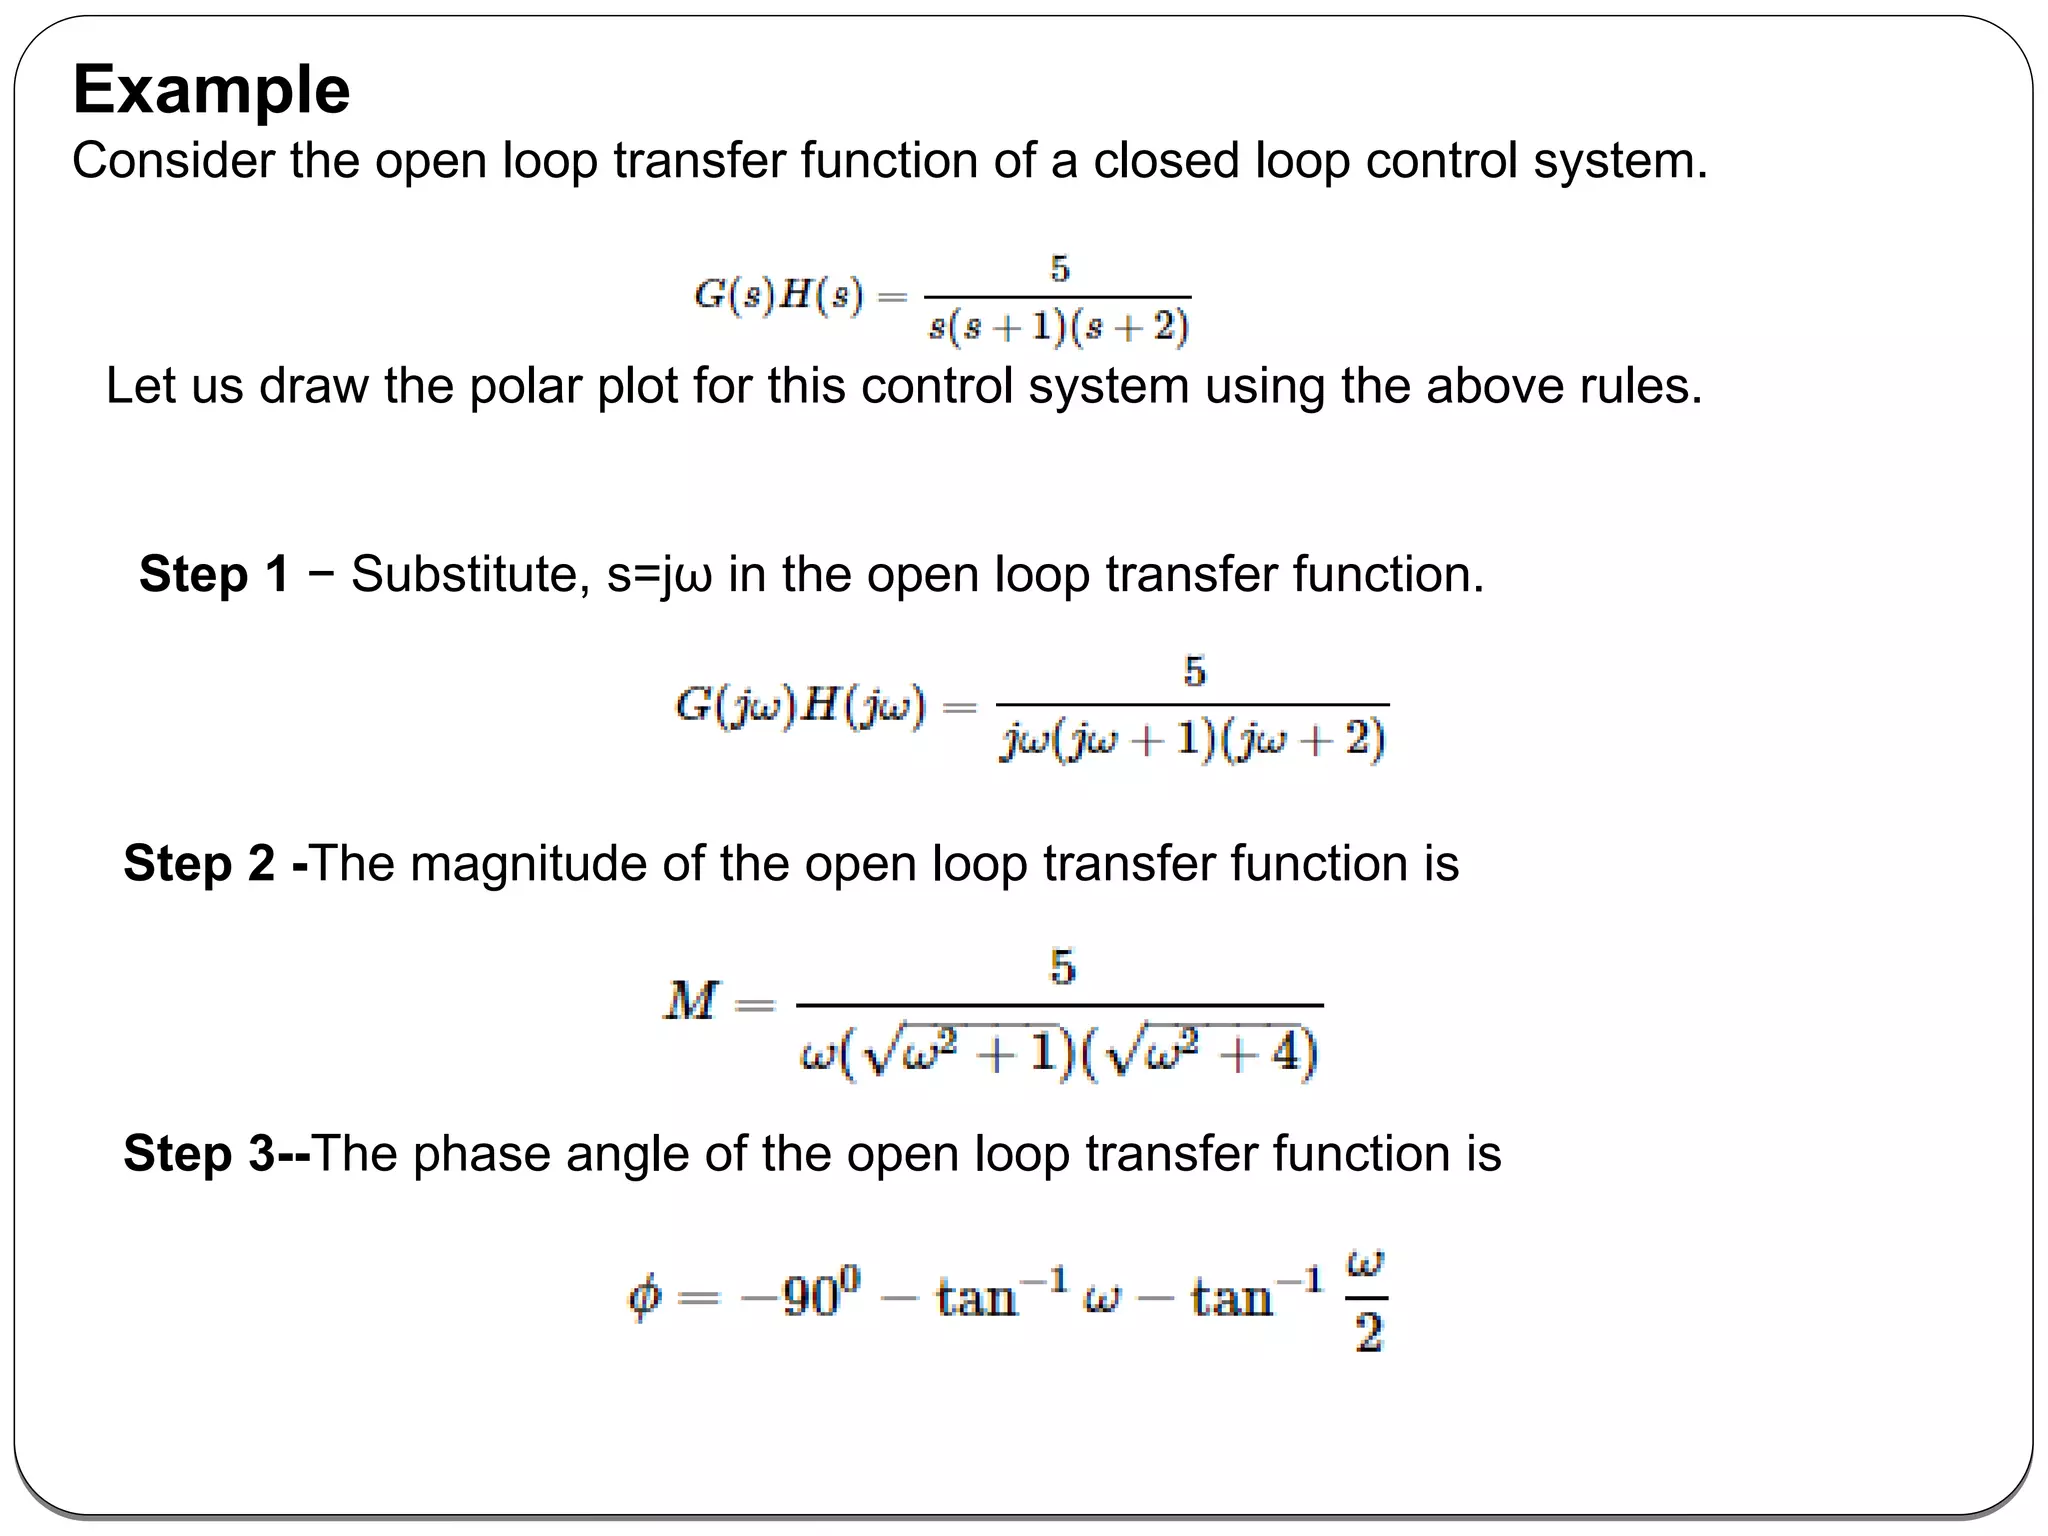
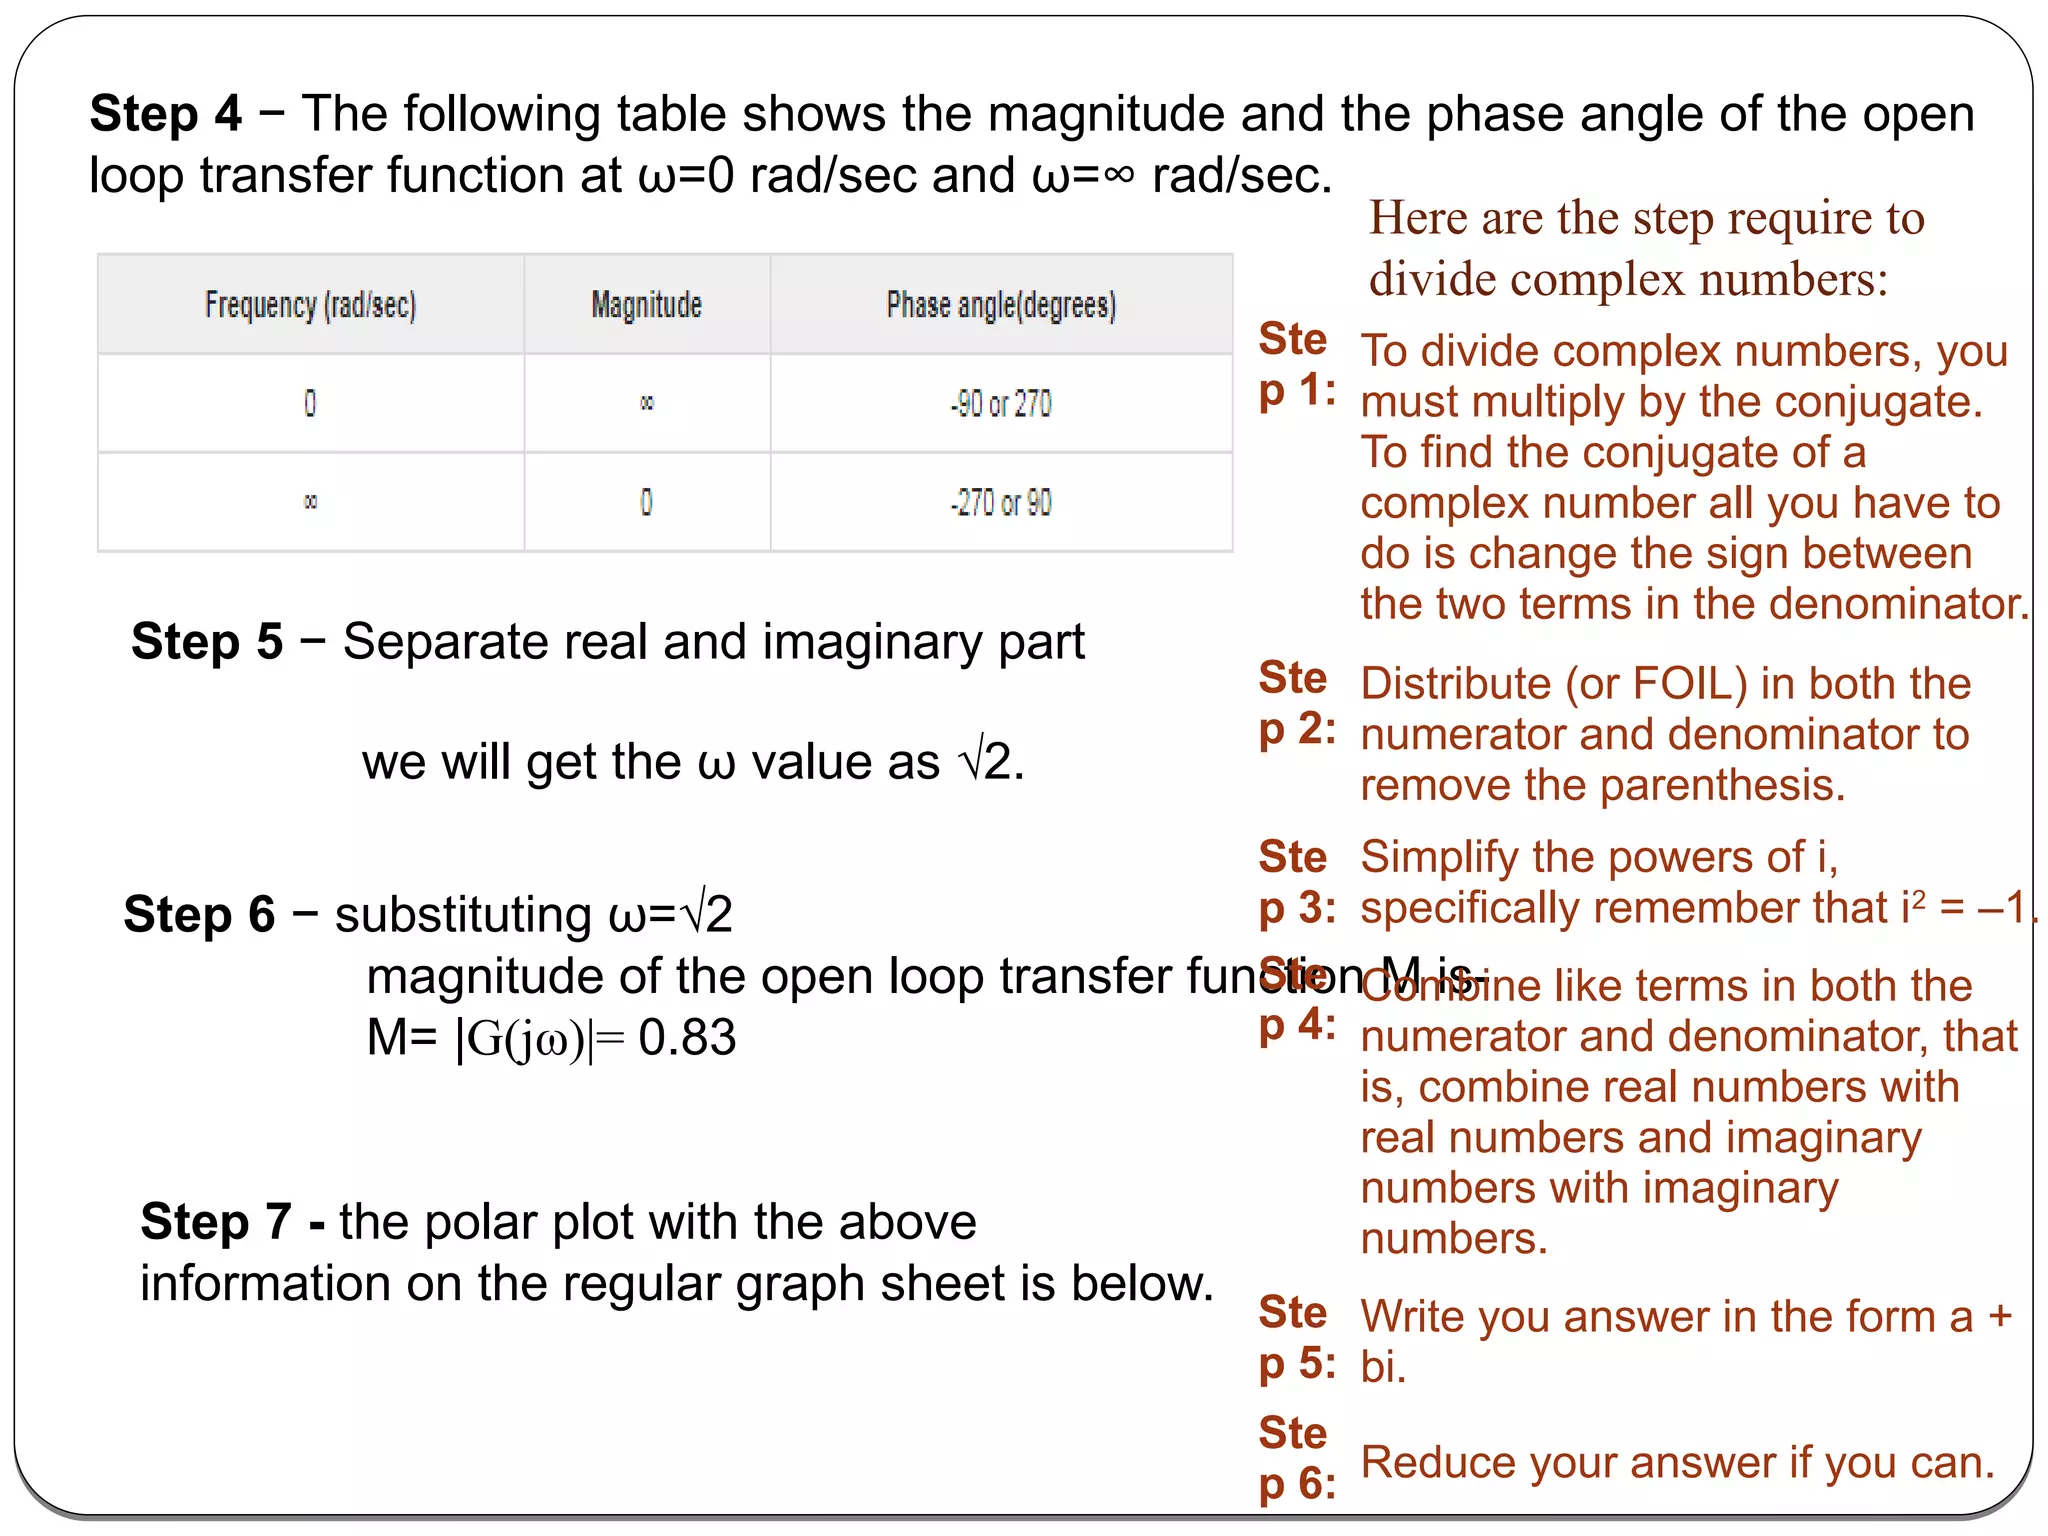
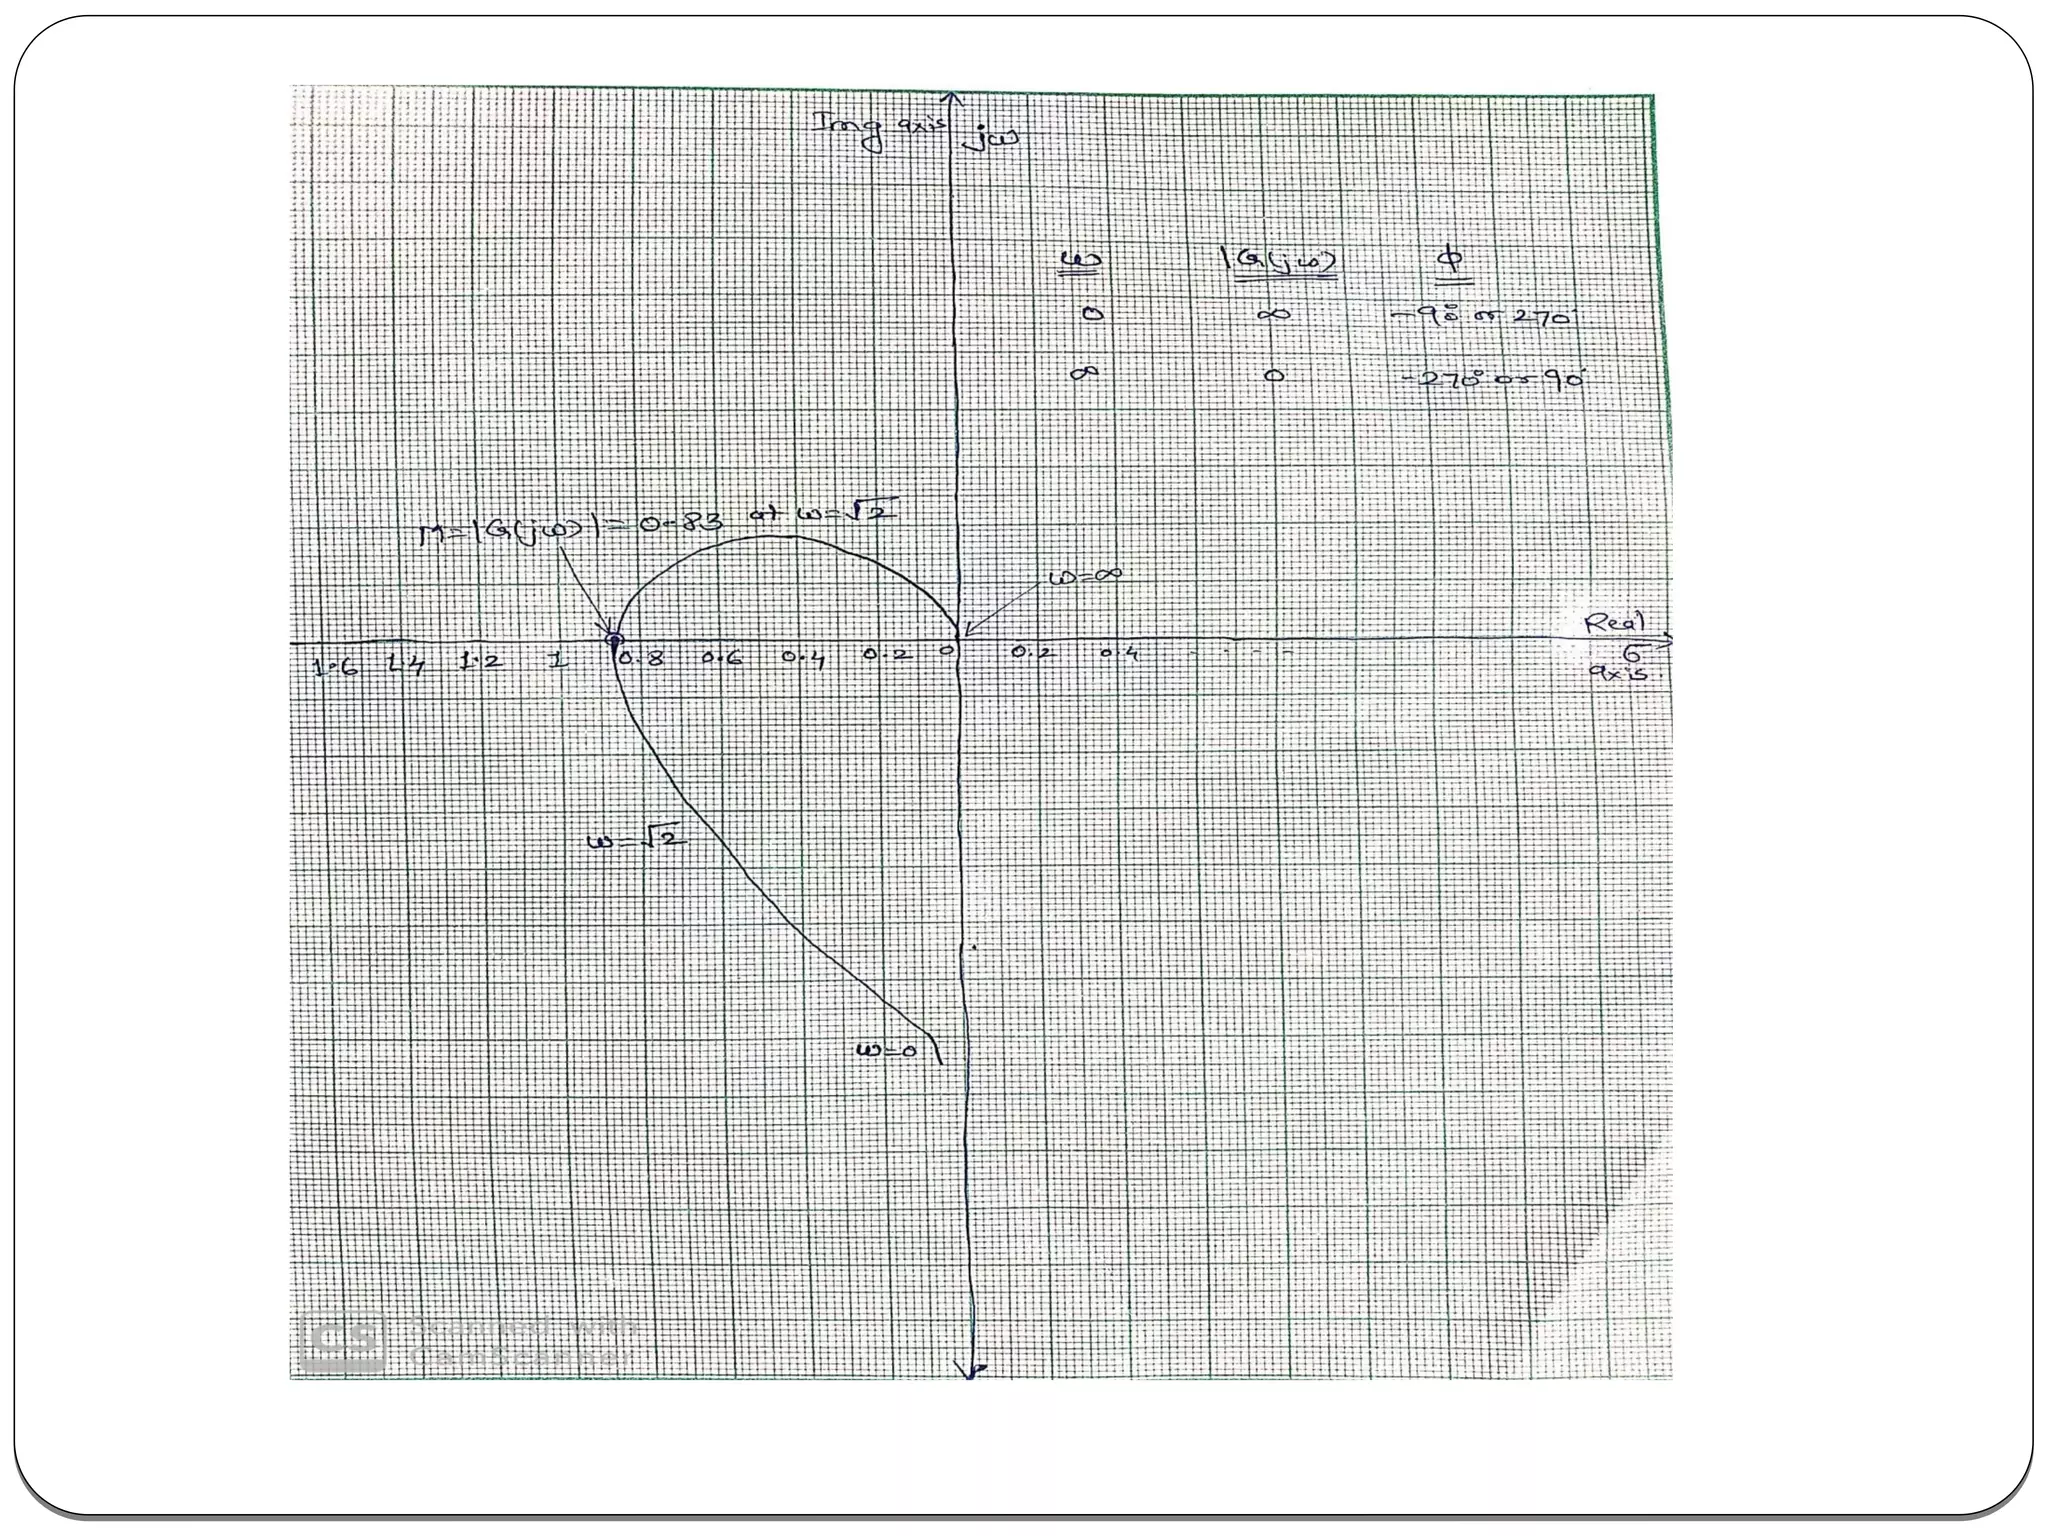
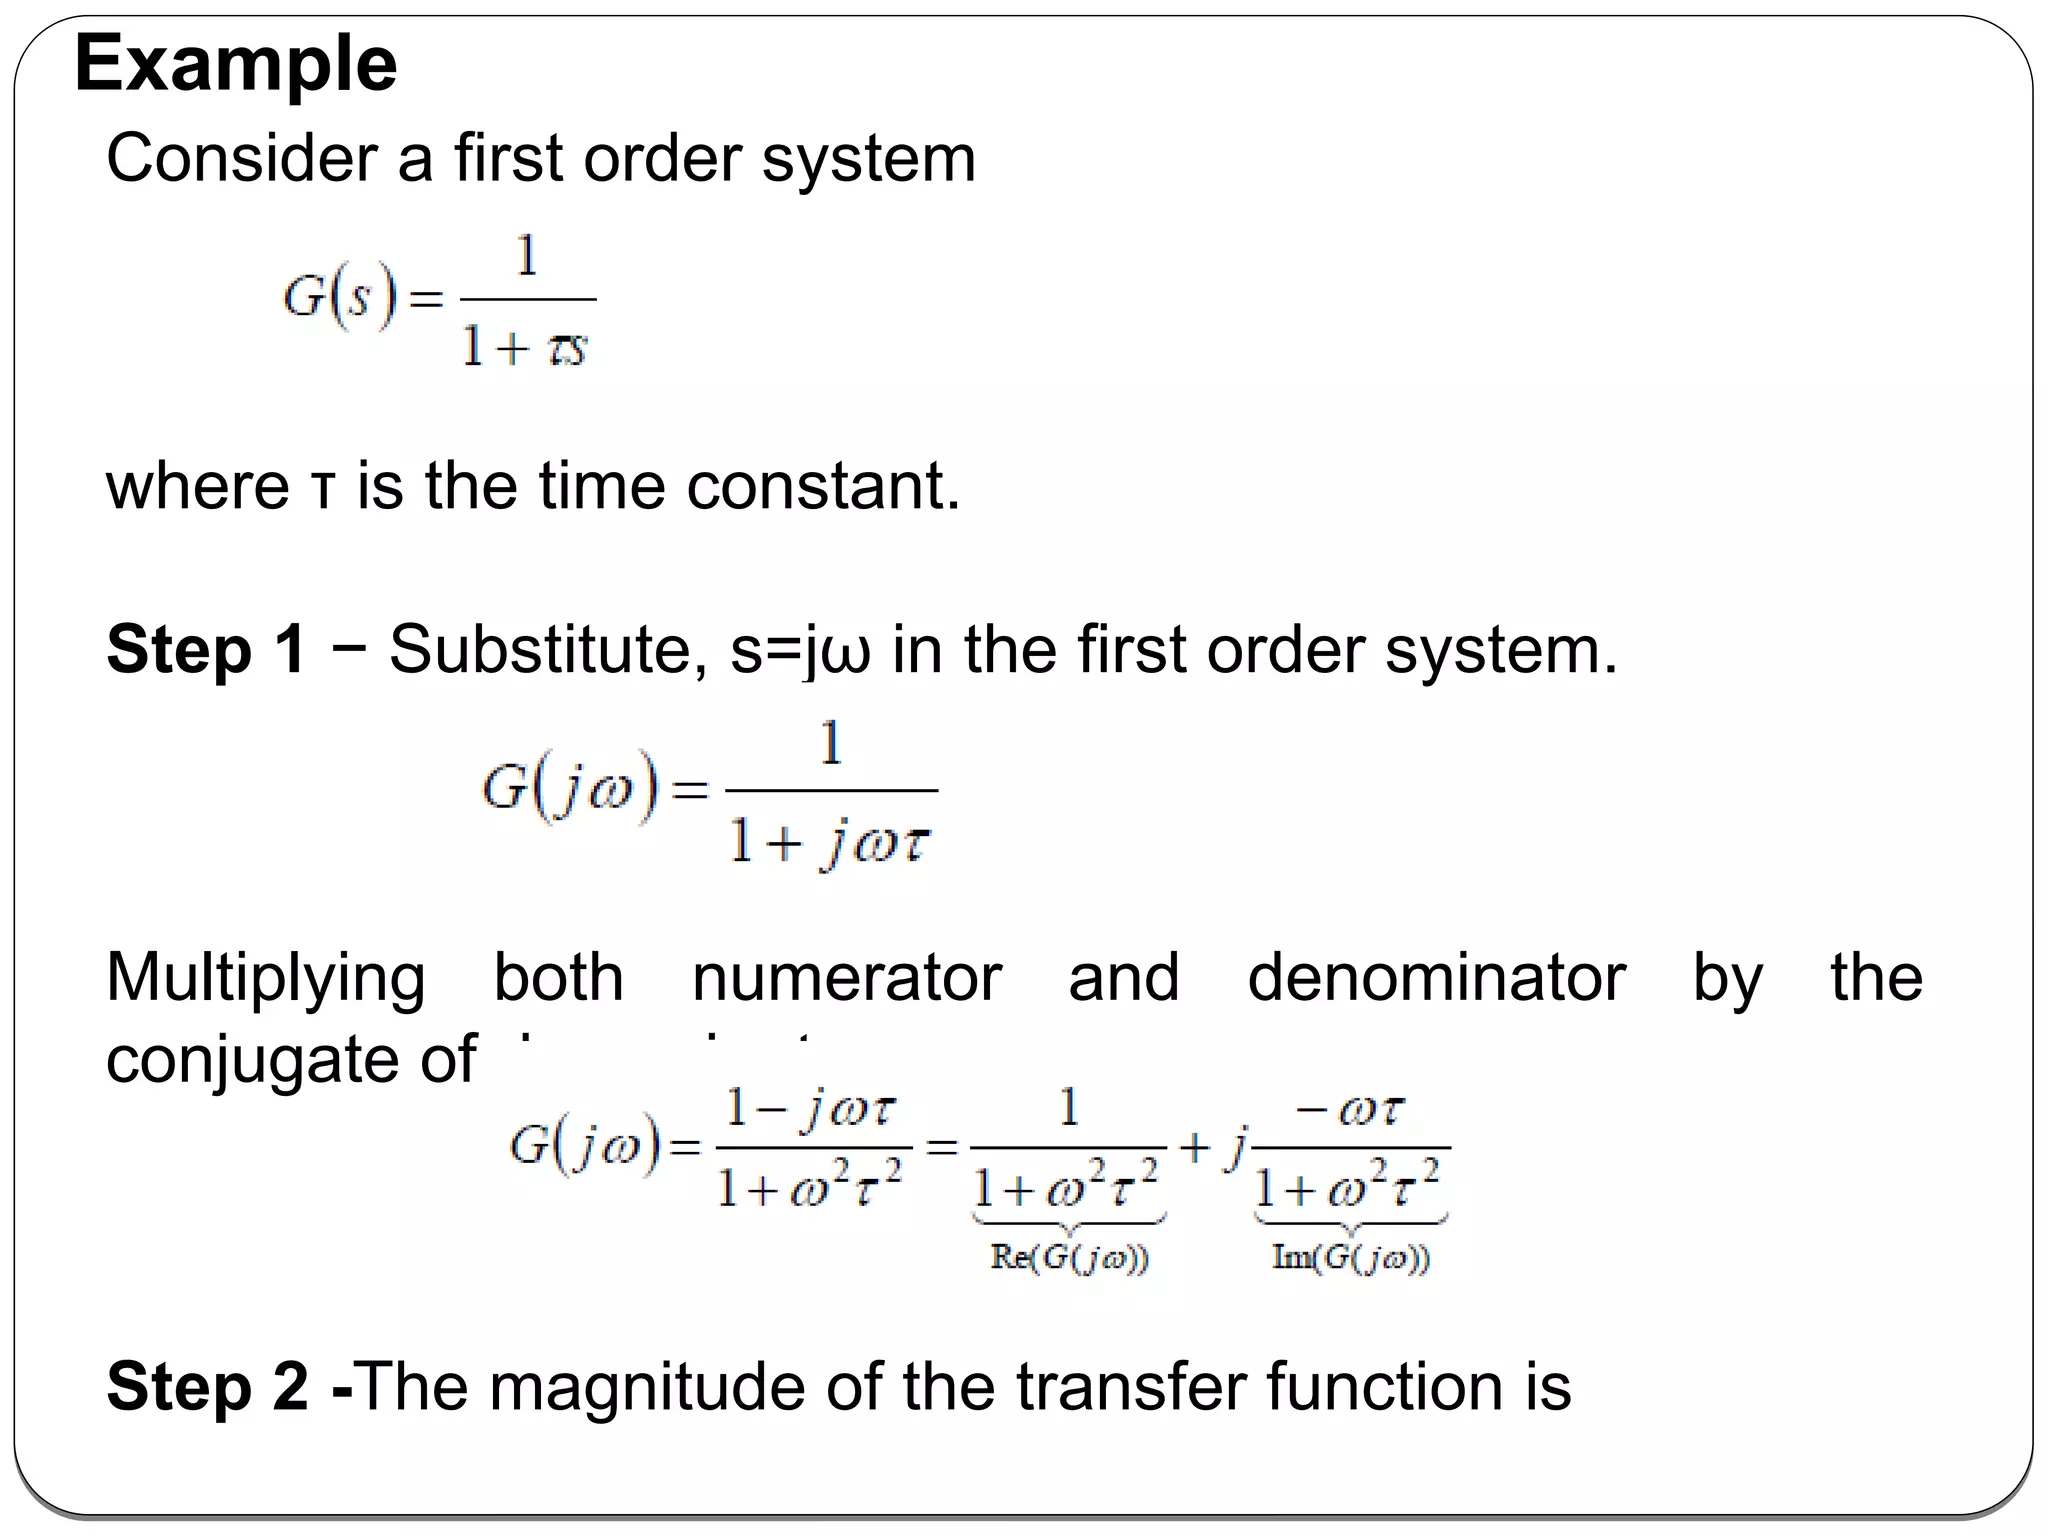
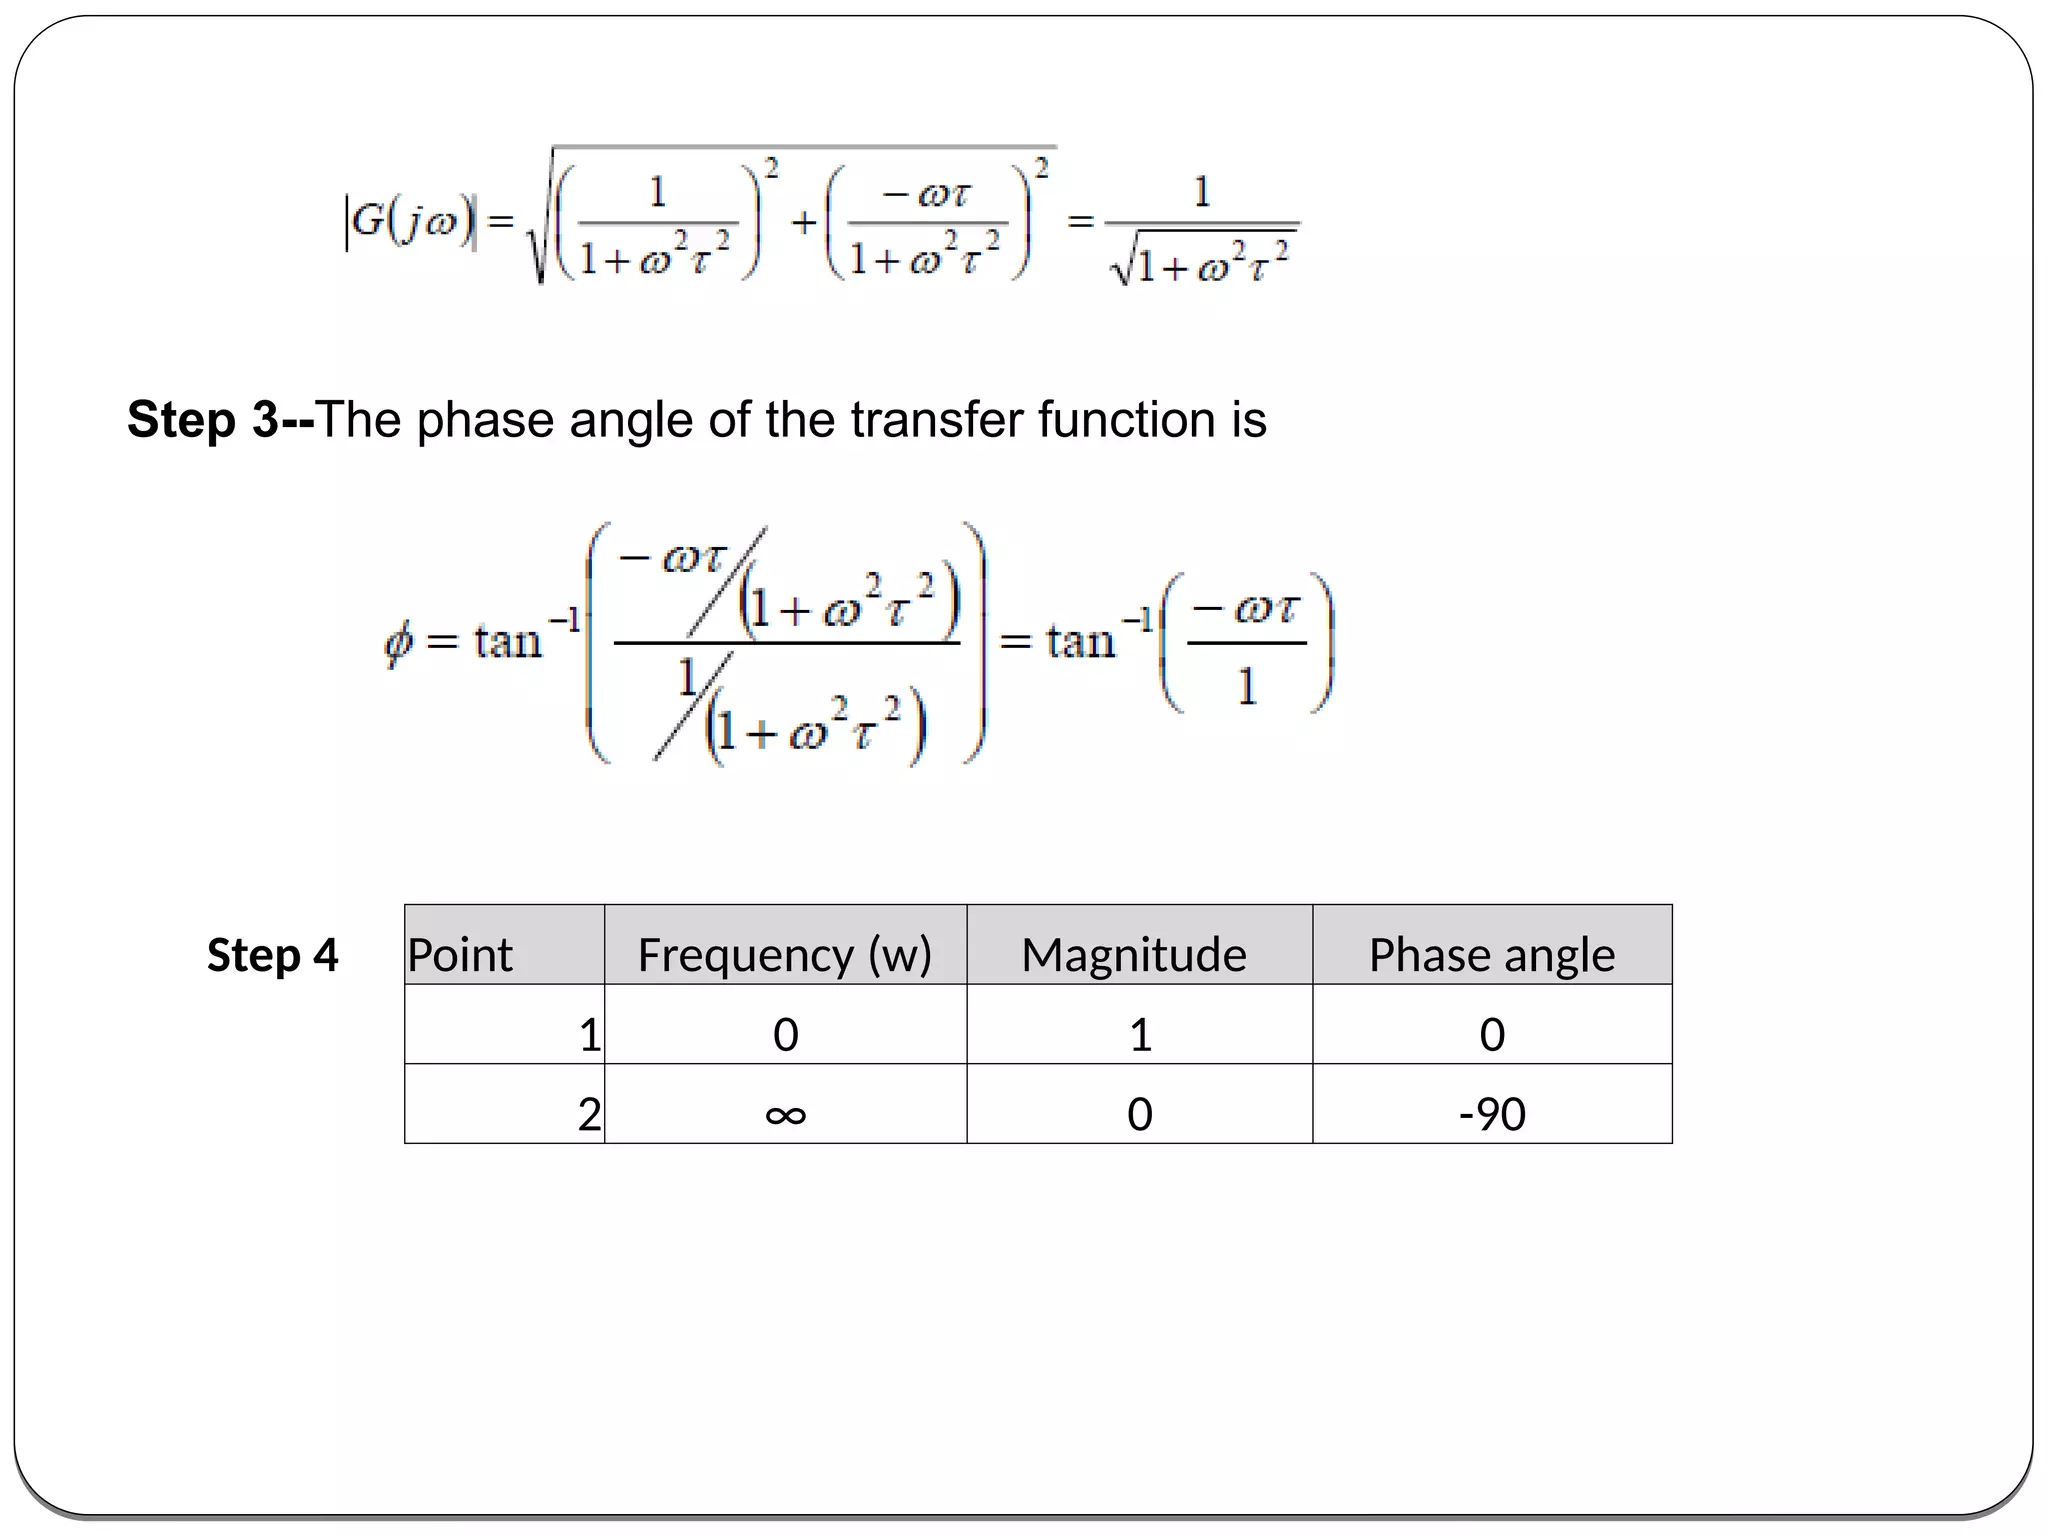
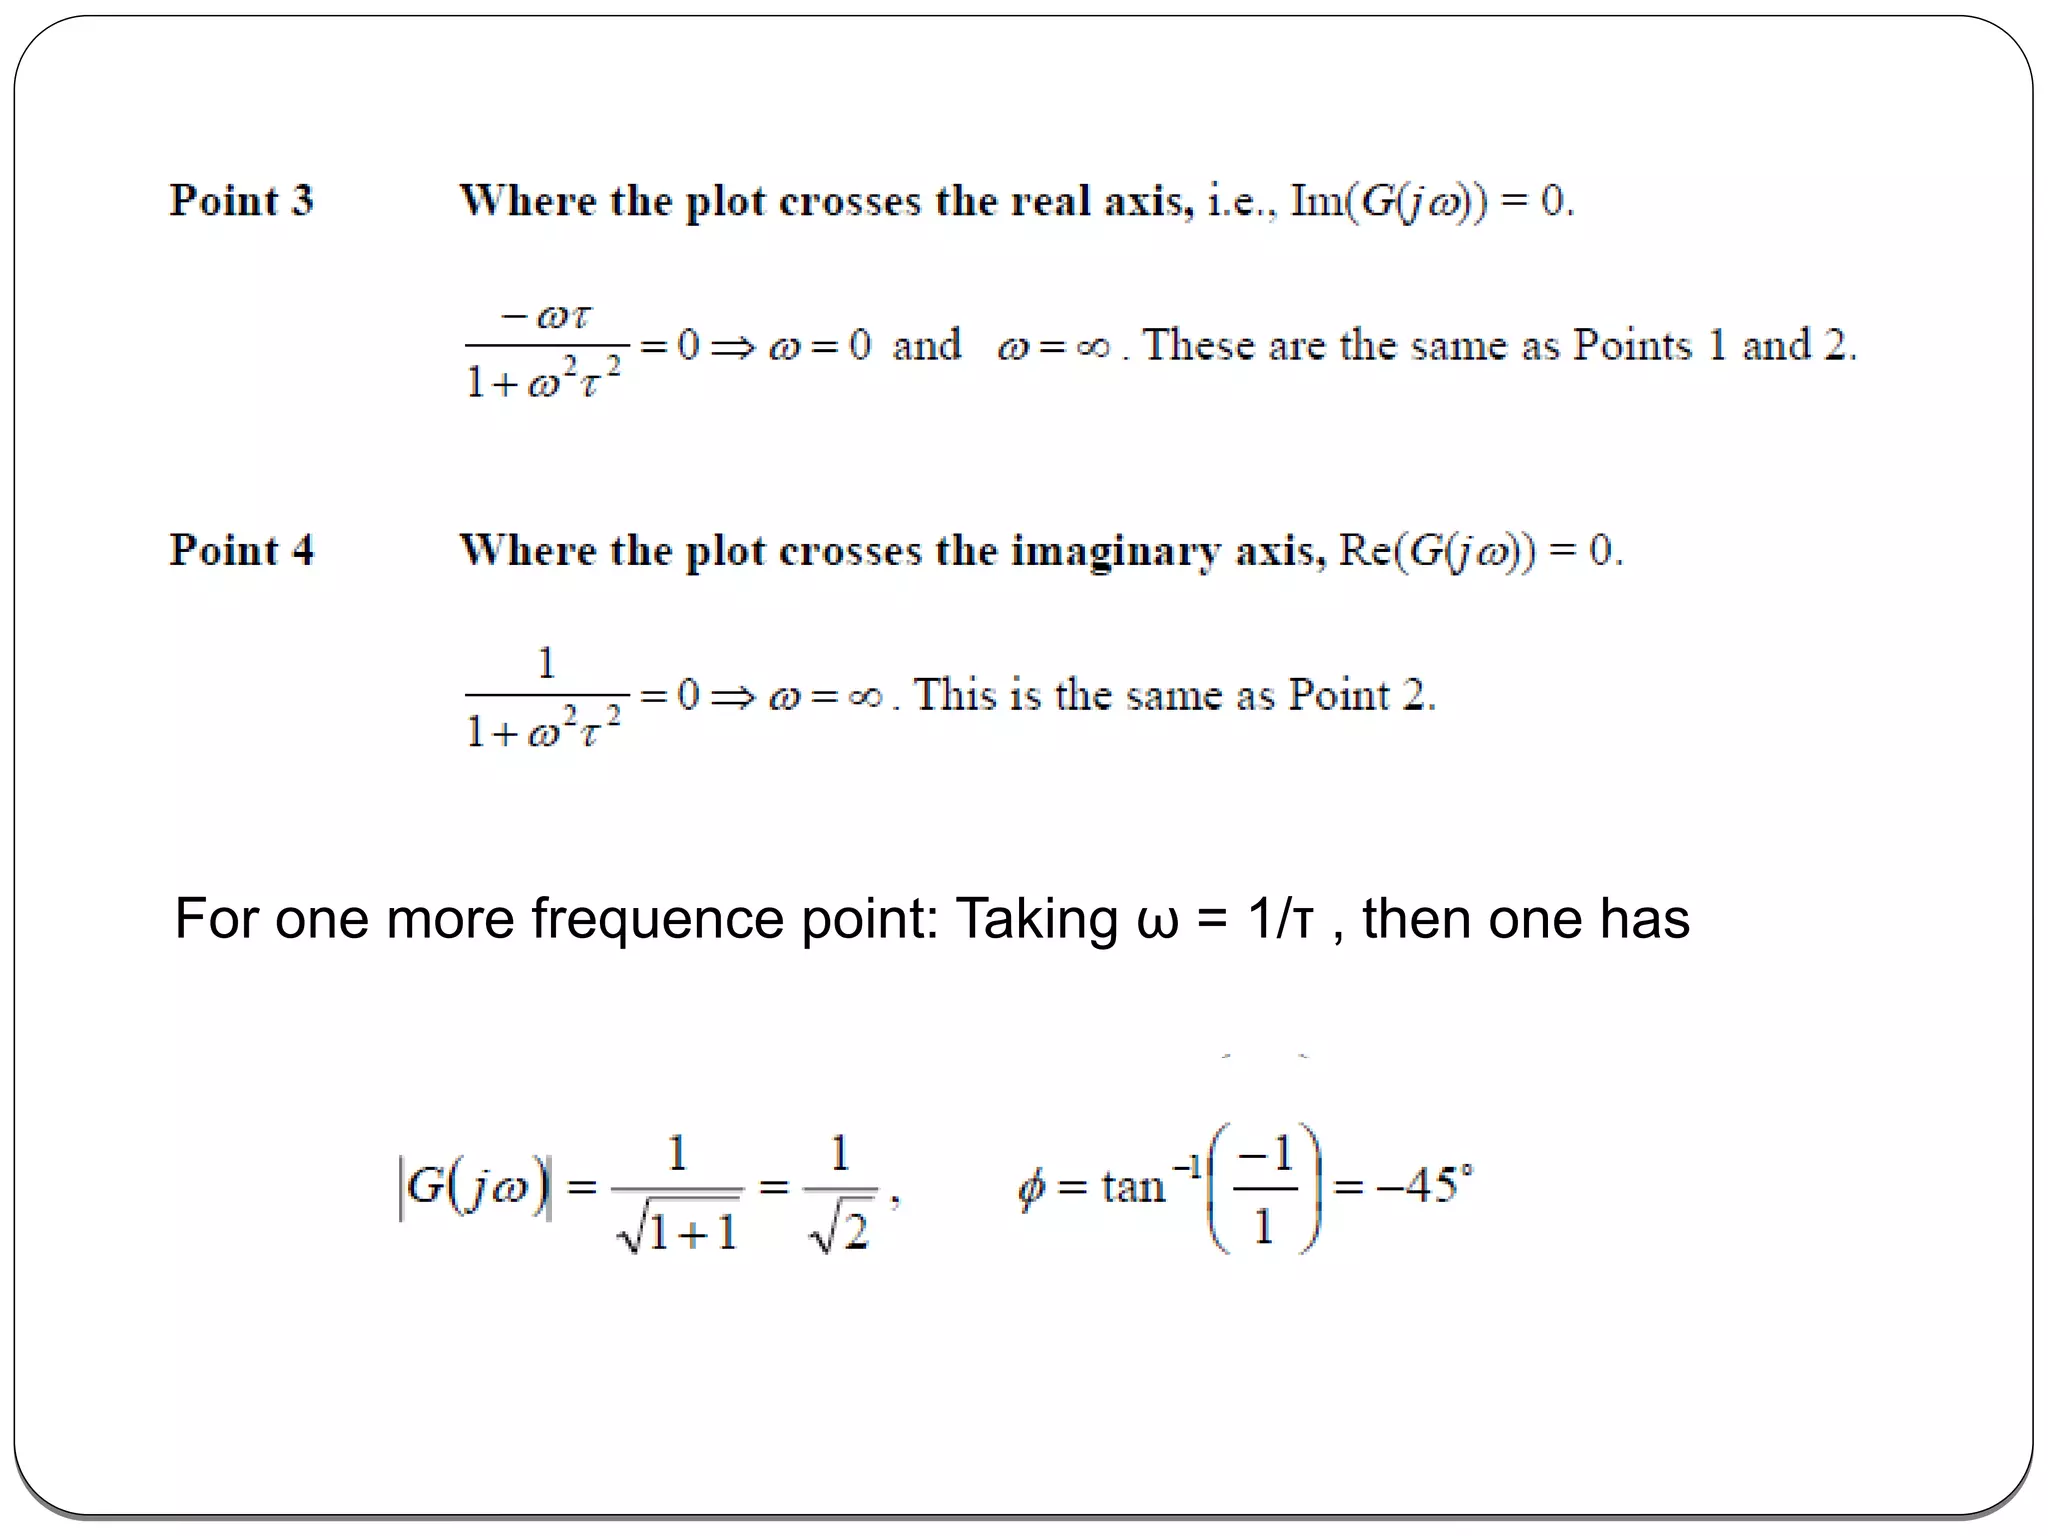
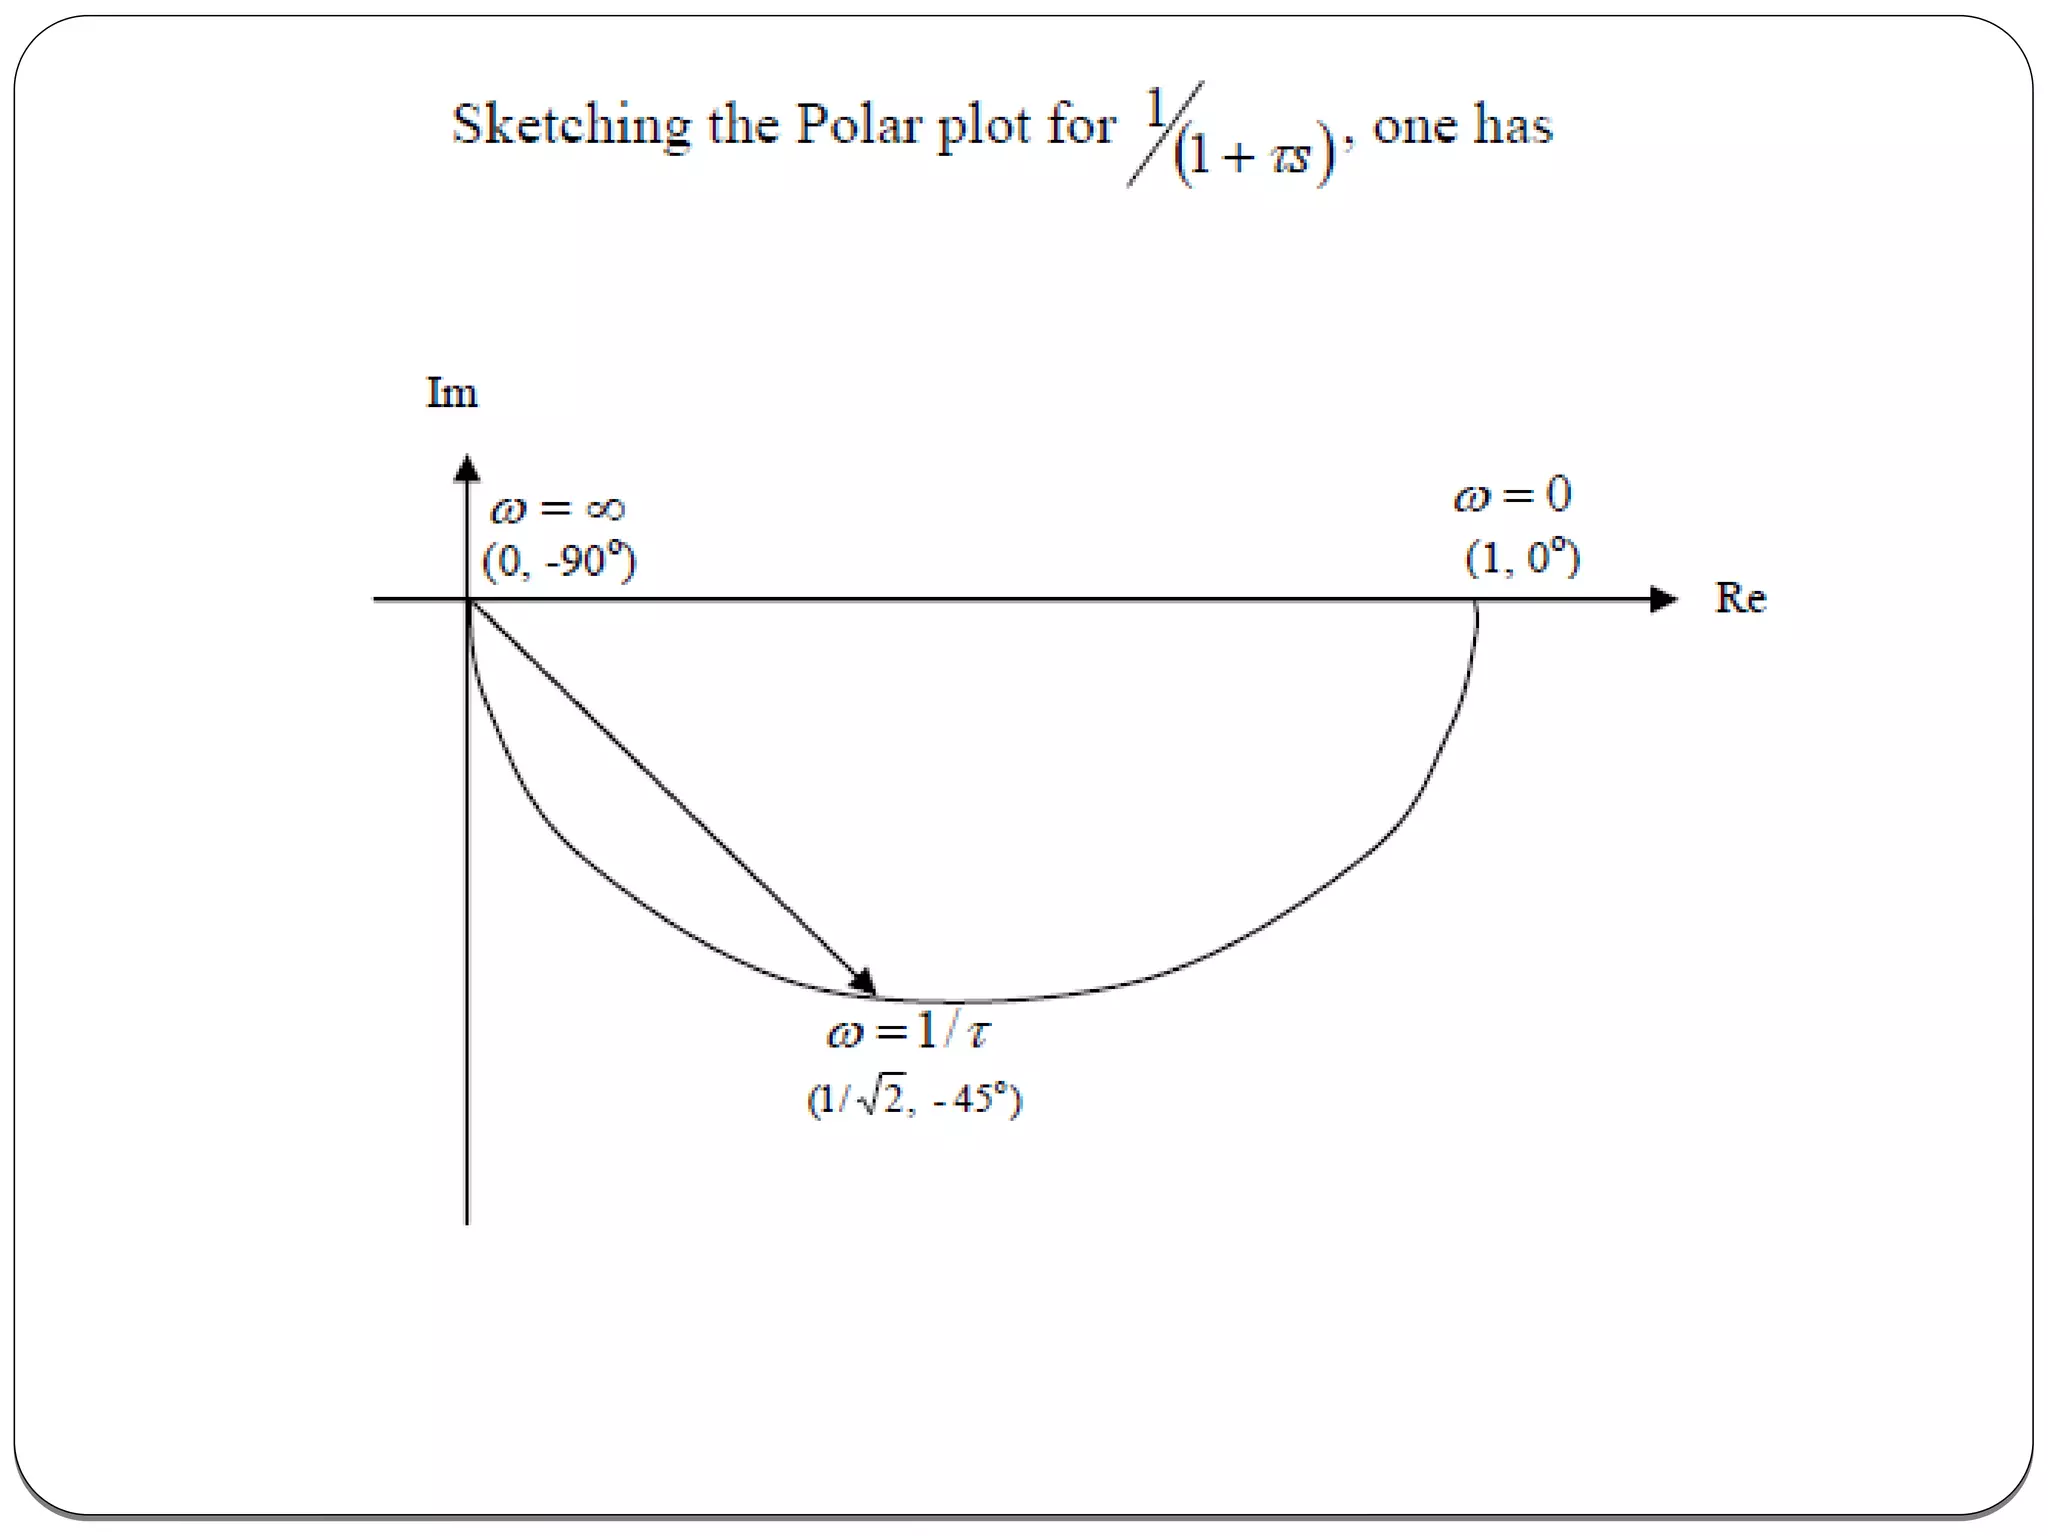
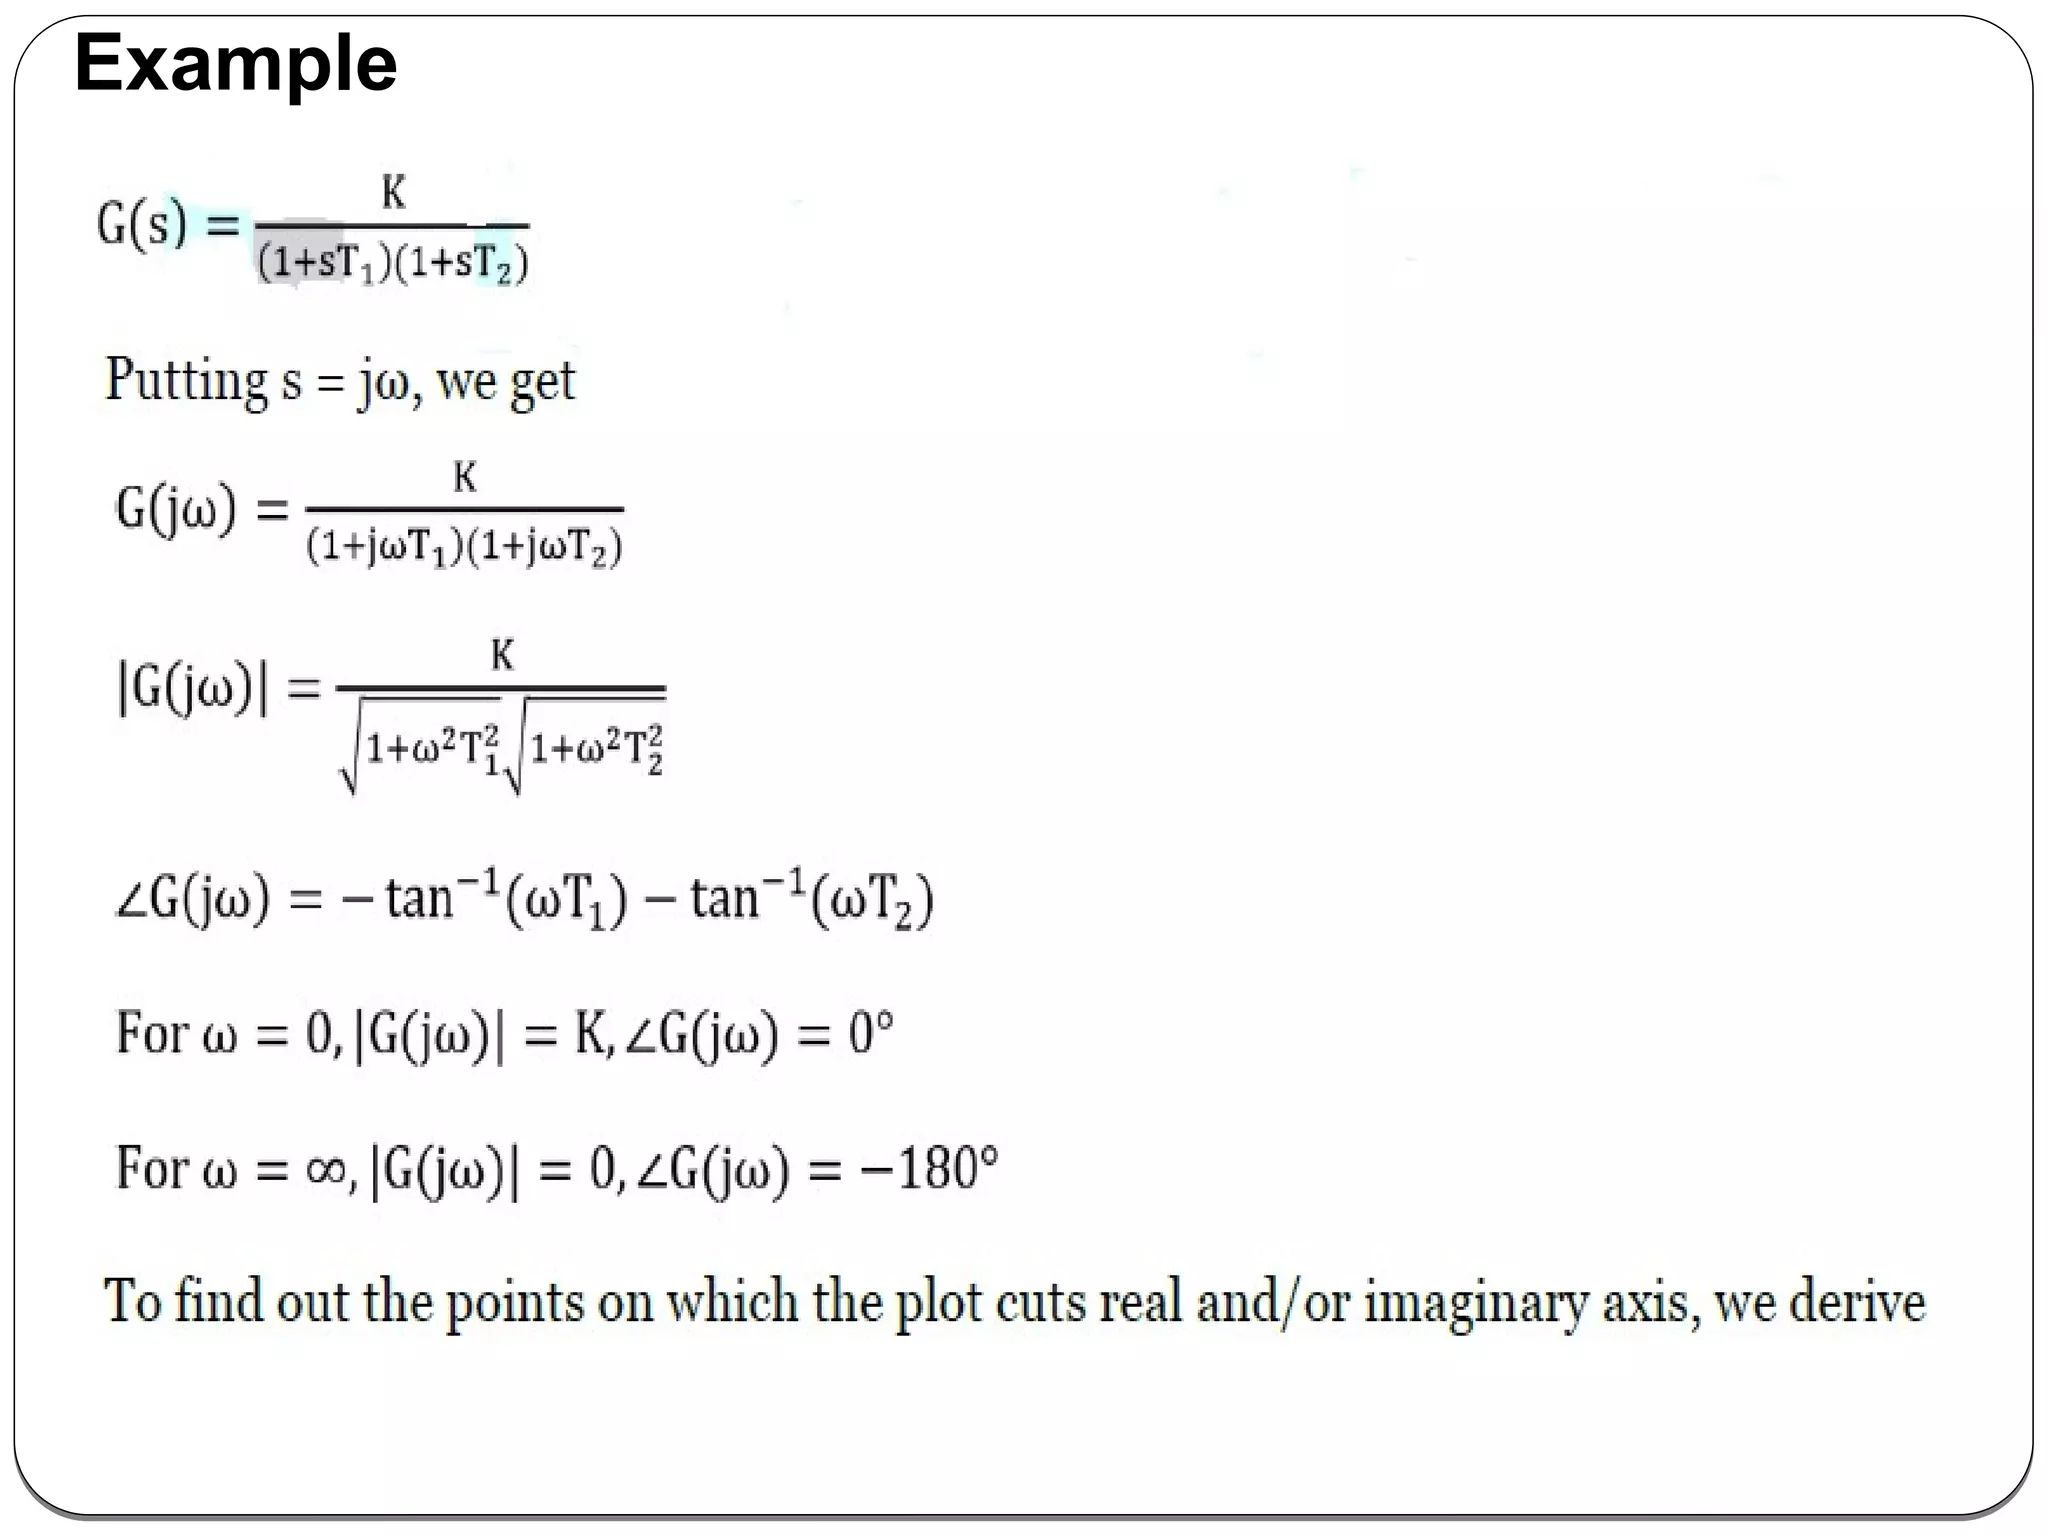
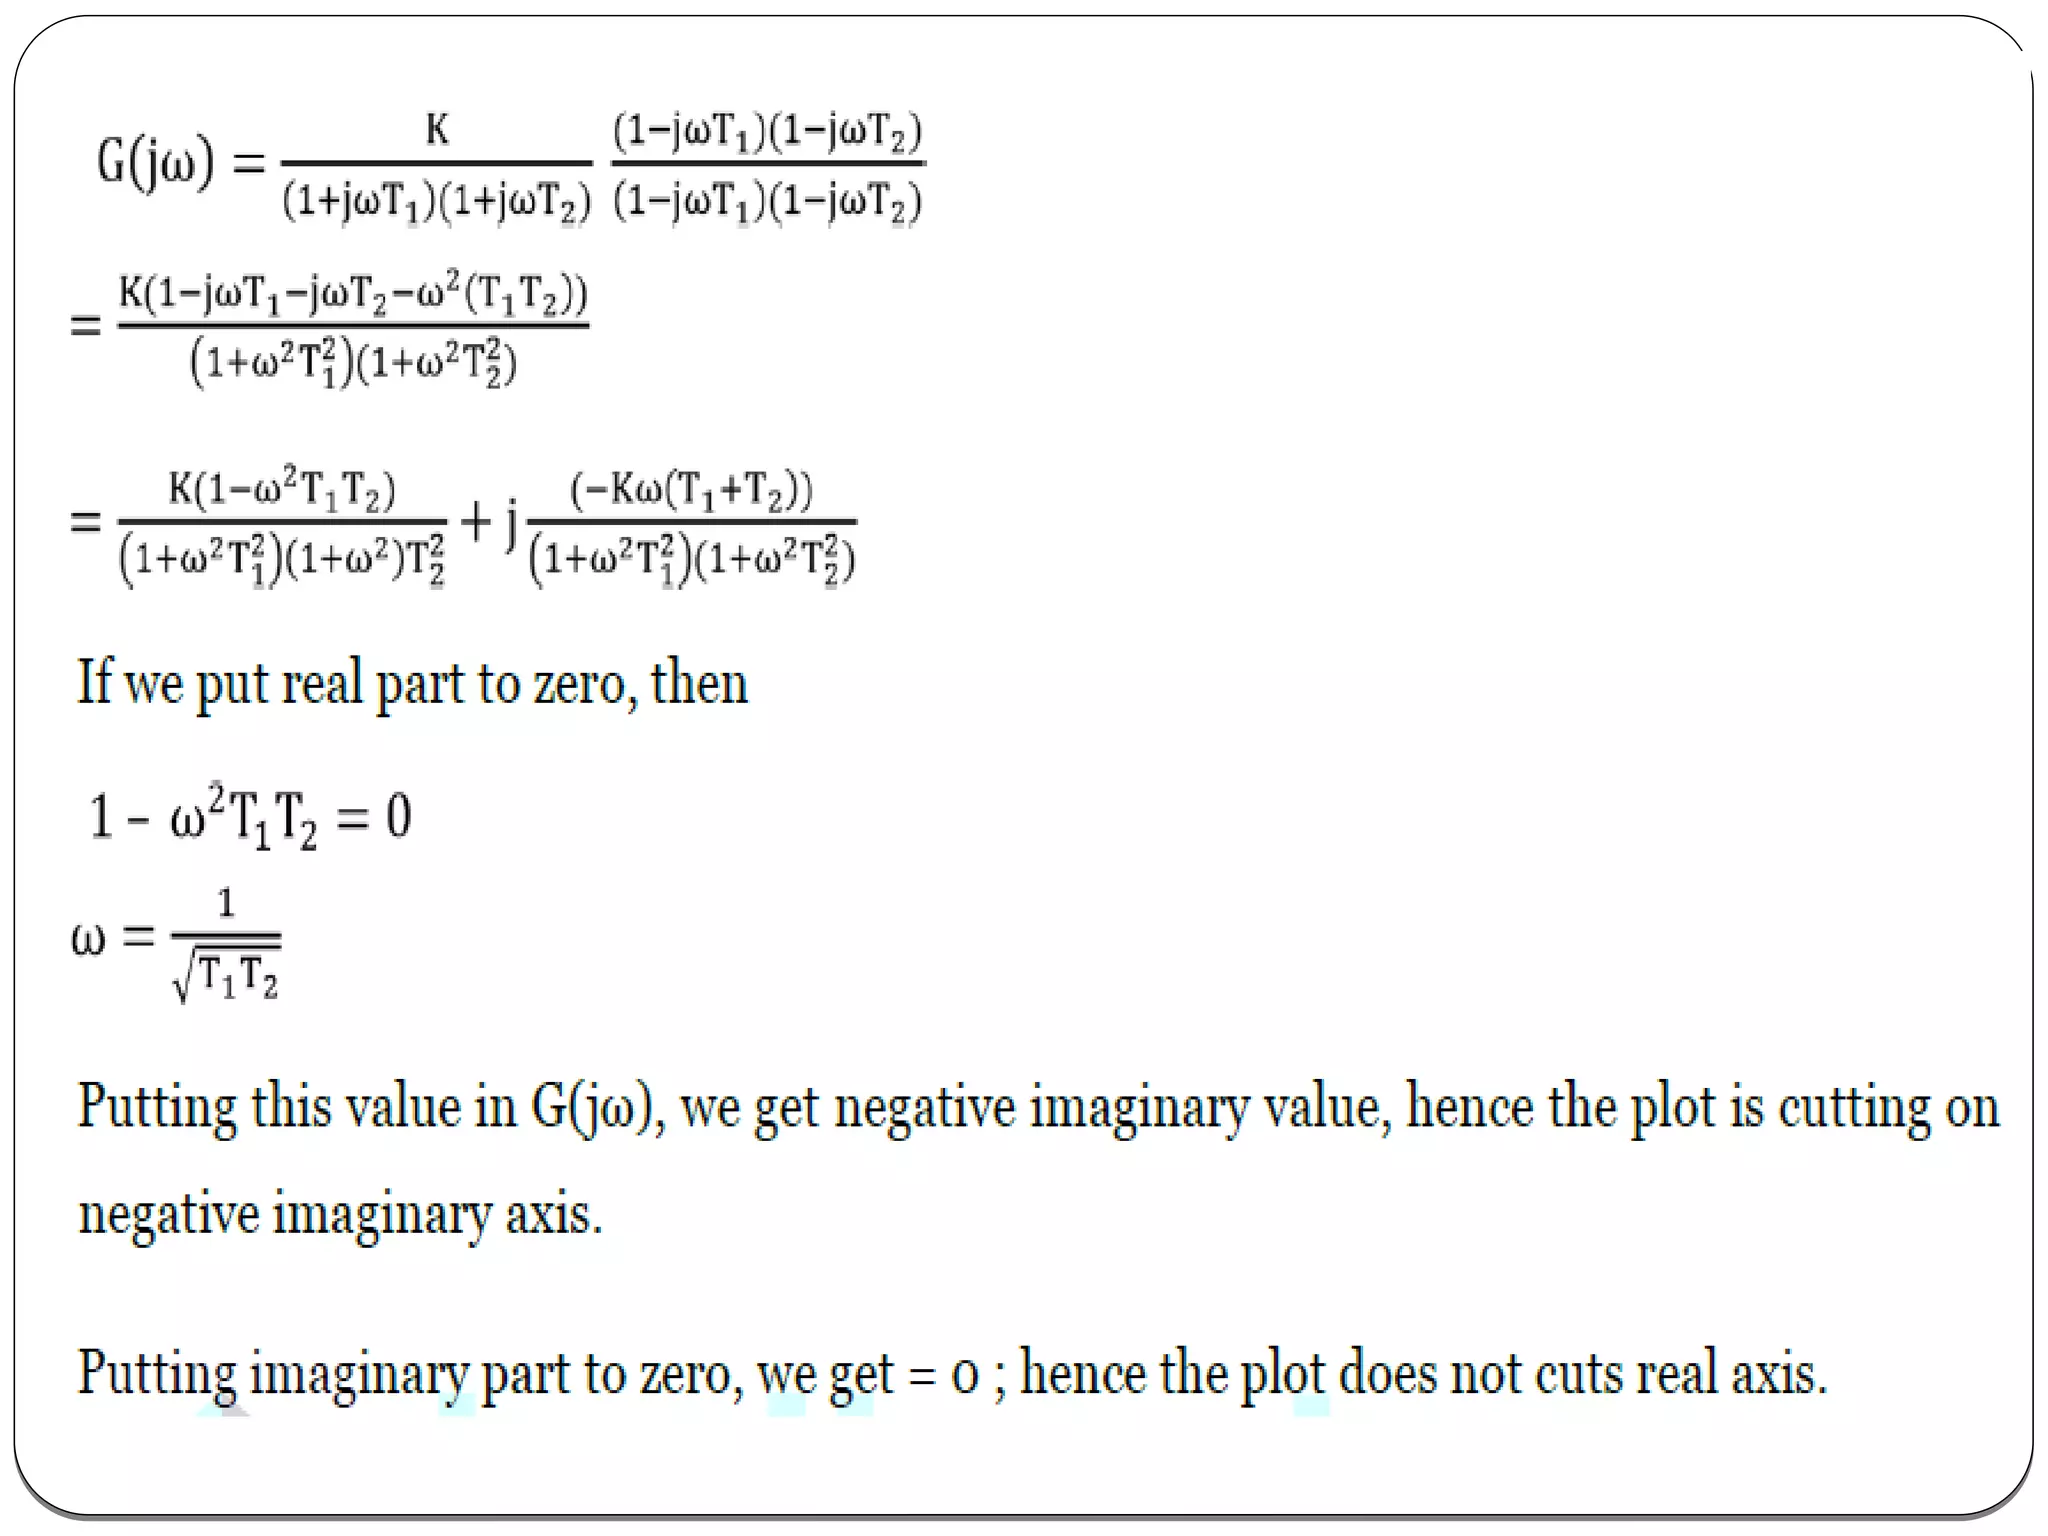
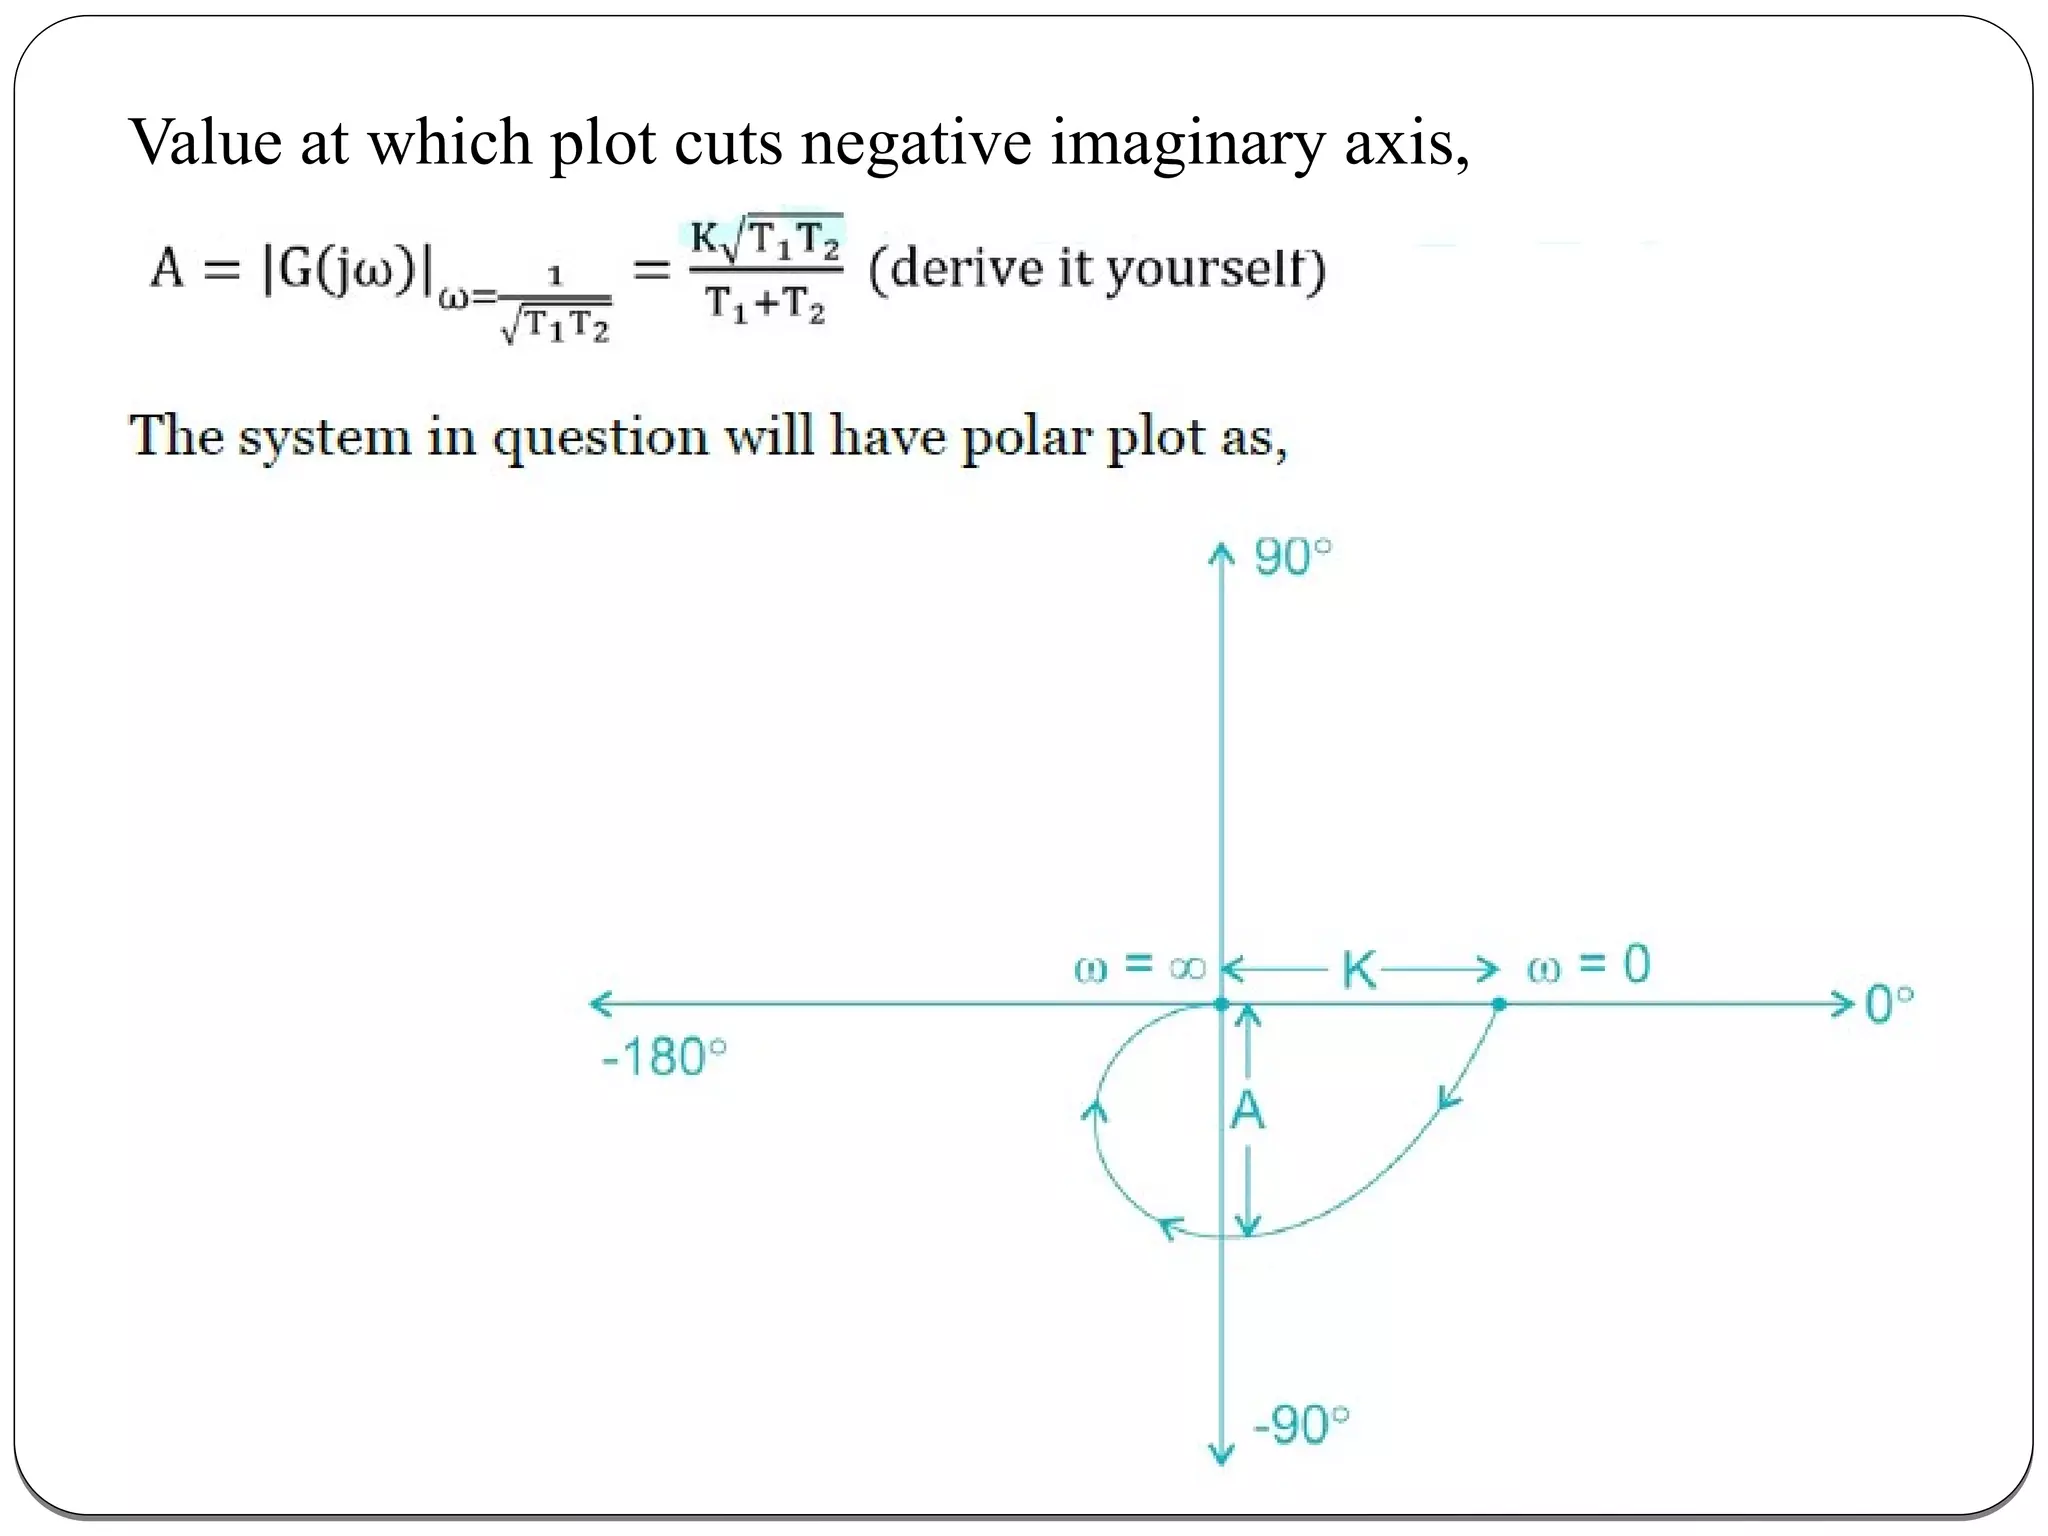
Polar plot
-By Prof. Mrunal
The polar form of G(jω)H(jω)  is-
G(jω)H(jω)=|G(jω)H(jω)| G(jω)H(jω)∠
The Polar plot is a plot, which can be drawn between the magnitude and the
phase angle of G(jω)H(jω) by varying ω from zero to ∞. The polar graph sheet or
in a regular graph sheet is shown in the following figure.
Polar plot
Rules for Drawing Polar Plots:
Follow these rules for plotting the polar plots.
•Substitute, s=jω in the open loop transfer function.
•Write the expressions for magnitude and the phase of G(jω)H(jω).
•Find the starting magnitude and the phase of G(jω)H(jω) by substituting ω=0. So,
the polar plot starts with this magnitude and the phase angle.
•Find the ending magnitude and the phase of G(jω)H(jω) by substituting ω=∞. So,
the polar plot ends with this magnitude and the phase angle.
•Check whether the polar plot intersects the real axis, by making the imaginary
term of G(jω)H(jω) equal to zero and find the value(s) of ω.
•Check whether the polar plot intersects the imaginary axis, by making real term
of G(jω)H(jω) equal to zero and find the value(s) of ω.
•For drawing polar plot more clearly, find the magnitude and phase
of G(jω)H(jω) by considering the other value(s) of ω
Example
Consider the open loop transfer function of a closed loop control system.
Let us draw the polar plot for this control system using the above rules.
Step 1 − Substitute, s=jω in the open loop transfer function.
Step 2 -The magnitude of the open loop transfer function is
Step 3--The phase angle of the open loop transfer function is
Step 4 − The following table shows the magnitude and the phase angle of the open
loop transfer function at ω=0 rad/sec and ω=∞ rad/sec.
Step 5 − Separate real and imaginary part
we will get the ω value as √2.
Step 6 − substituting ω=√2
magnitude of the open loop transfer function M is-
M= |G(jω)|= 0.83
Step 7 - the polar plot with the above
information on the regular graph sheet is below.
Ste
p 1:
To divide complex numbers, you
must multiply by the conjugate.
To find the conjugate of a
complex number all you have to
do is change the sign between
the two terms in the denominator.
Ste
p 2:
Distribute (or FOIL) in both the
numerator and denominator to
remove the parenthesis.
Ste
p 3:
Simplify the powers of i,
specifically remember that i2
 = –1.
Ste
p 4:
Combine like terms in both the
numerator and denominator, that
is, combine real numbers with
real numbers and imaginary
numbers with imaginary
numbers.
Ste
p 5:
Write you answer in the form a +
bi.
Ste
p 6: Reduce your answer if you can.
Here are the step require to
divide complex numbers:
Consider a first order system
where τ is the time constant.
Step 1 − Substitute, s=jω in the first order system.
Multiplying both numerator and denominator by the
conjugate of denominator
Step 2 -The magnitude of the transfer function is
Example
Step 3--The phase angle of the transfer function is
Step 4 Point Frequency (w) Magnitude Phase angle
1 0 1 0
2 ∞ 0 -90
For one more frequence point: Taking ω = 1/τ , then one has
Example
Value at which plot cuts negative imaginary axis,
Thank you

Polar plot

  • 1.
  • 2.
    The polar formof G(jω)H(jω)  is- G(jω)H(jω)=|G(jω)H(jω)| G(jω)H(jω)∠ The Polar plot is a plot, which can be drawn between the magnitude and the phase angle of G(jω)H(jω) by varying ω from zero to ∞. The polar graph sheet or in a regular graph sheet is shown in the following figure. Polar plot
  • 3.
    Rules for DrawingPolar Plots: Follow these rules for plotting the polar plots. •Substitute, s=jω in the open loop transfer function. •Write the expressions for magnitude and the phase of G(jω)H(jω). •Find the starting magnitude and the phase of G(jω)H(jω) by substituting ω=0. So, the polar plot starts with this magnitude and the phase angle. •Find the ending magnitude and the phase of G(jω)H(jω) by substituting ω=∞. So, the polar plot ends with this magnitude and the phase angle. •Check whether the polar plot intersects the real axis, by making the imaginary term of G(jω)H(jω) equal to zero and find the value(s) of ω. •Check whether the polar plot intersects the imaginary axis, by making real term of G(jω)H(jω) equal to zero and find the value(s) of ω. •For drawing polar plot more clearly, find the magnitude and phase of G(jω)H(jω) by considering the other value(s) of ω
  • 4.
    Example Consider the openloop transfer function of a closed loop control system. Let us draw the polar plot for this control system using the above rules. Step 1 − Substitute, s=jω in the open loop transfer function. Step 2 -The magnitude of the open loop transfer function is Step 3--The phase angle of the open loop transfer function is
  • 5.
    Step 4 − Thefollowing table shows the magnitude and the phase angle of the open loop transfer function at ω=0 rad/sec and ω=∞ rad/sec. Step 5 − Separate real and imaginary part we will get the ω value as √2. Step 6 − substituting ω=√2 magnitude of the open loop transfer function M is- M= |G(jω)|= 0.83 Step 7 - the polar plot with the above information on the regular graph sheet is below. Ste p 1: To divide complex numbers, you must multiply by the conjugate. To find the conjugate of a complex number all you have to do is change the sign between the two terms in the denominator. Ste p 2: Distribute (or FOIL) in both the numerator and denominator to remove the parenthesis. Ste p 3: Simplify the powers of i, specifically remember that i2  = –1. Ste p 4: Combine like terms in both the numerator and denominator, that is, combine real numbers with real numbers and imaginary numbers with imaginary numbers. Ste p 5: Write you answer in the form a + bi. Ste p 6: Reduce your answer if you can. Here are the step require to divide complex numbers:
  • 7.
    Consider a firstorder system where τ is the time constant. Step 1 − Substitute, s=jω in the first order system. Multiplying both numerator and denominator by the conjugate of denominator Step 2 -The magnitude of the transfer function is Example
  • 8.
    Step 3--The phaseangle of the transfer function is Step 4 Point Frequency (w) Magnitude Phase angle 1 0 1 0 2 ∞ 0 -90
  • 9.
    For one morefrequence point: Taking ω = 1/τ , then one has
  • 11.
  • 13.
    Value at whichplot cuts negative imaginary axis,
  • 14.