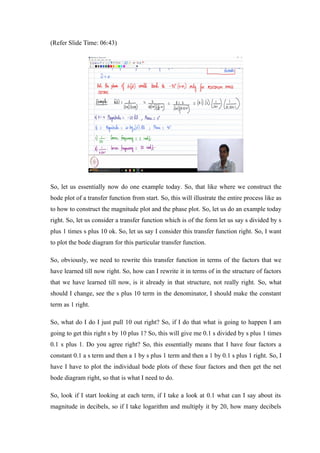
1. The document discusses constructing the Bode plot of a transfer function step-by-step using an example transfer function of s/(s+1)*(s+10).
2. The transfer function is rewritten as a product of four factors: 0.1s, s, 1/(s+1), and 1/(0.1s+1). The Bode plots of the individual factors are constructed and then combined.
3. The Bode plot consists of a line with a slope of +20 dB/decade from the s term, shifted down by -20 dB from the 0.1 term. Below the first corner frequency of 1 rad/s, this represents the combined low-frequency