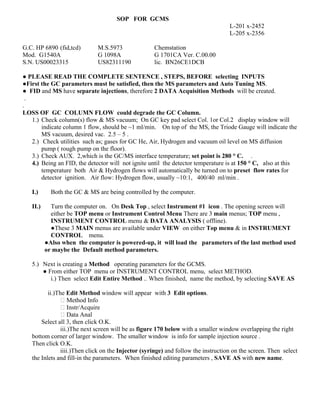
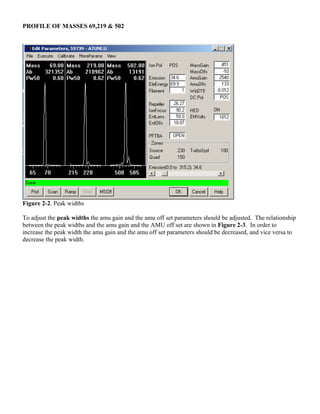
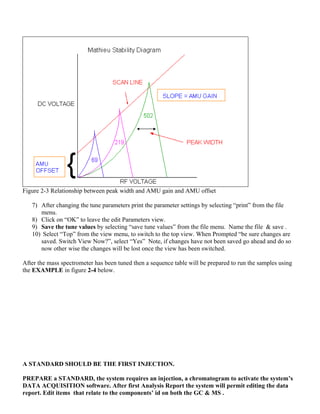
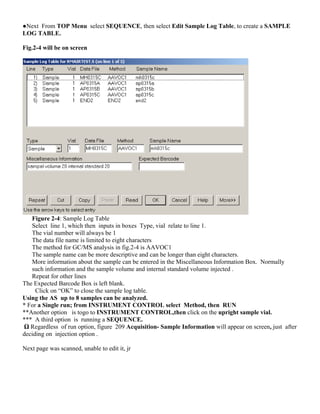
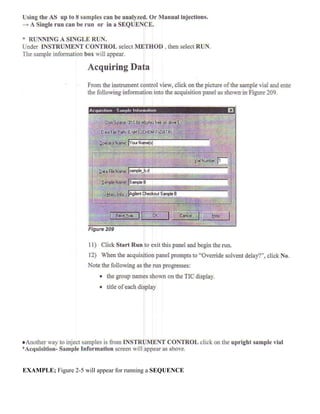
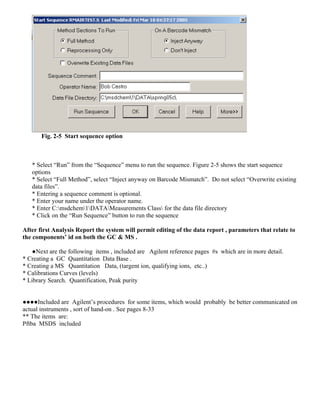
SlideShare a Scribd company logo
SOP FOR GCMS
L-201 x-2452
L-205 x-2356
G.C. HP 6890 (fid,tcd) M.S.5973 Chemstation
Mod. G1540A G 1098A G 1701CA Ver. C.00.00
S.N. US00023315 US82311190 lic. BN26CE1DCB
● PLEASE READ THE COMPLETE SENTENCE , STEPS, BEFORE selecting INPUTS
●First the GC parameters must be satisfied, then the MS parameters and Auto Tuning MS.
● FID and MS have separate injections, therefore 2 DATA Acquisition Methods will be created.
.
.
LOSS OF GC COLUMN FLOW could degrade the GC Column.
1.) Check column(s) flow & MS vacuum; On GC key pad select Col. 1or Col.2 display window will
indicate column 1 flow, should be ~1 ml/min. On top of the MS, the Triode Gauge will indicate the
MS vacuum, desired vac. 2.5 – 5 .
2.) Check utilities such as; gases for GC He, Air, Hydrogen and vacuum oil level on MS diffusion
pump ( rough pump on the floor).
3.) Check AUX. 2,which is the GC/MS interface temperature; set point is 280 ° C. .
4.) Being an FID, the detector will not ignite until the detector temperature is at 150 ° C, also at this
temperature both Air & Hydrogen flows will automatically be turned on to preset flow rates for
detector ignition. Air flow: Hydrogen flow, usually ~10:1, 400/40 ml/min .
I.) Both the GC & MS are being controlled by the computer.
II.) Turn the computer on. On Desk Top , select Instrument #1 icon . The opening screen will
either be TOP menu or Instrument Control Menu There are 3 main menus; TOP menu ,
INSTRUMENT CONTROL menu & DATA ANALYSIS ( offline).
●These 3 MAIN menus are available under VIEW on either Top menu & in INSTRUMENT
CONTROL menu.
●Also when the computer is powered-up, it will load the parameters of the last method used
or maybe the Default method parameters.
5.) Next is creating a Method operating parameters for the GCMS.
● From either TOP menu or INSTRUMENT CONTROL menu, select METHOD.
i.) Then select Edit Entire Method .. When finished, name the method, by selecting SAVE AS
ii.)The Edit Method window will appear with 3 Edit options.
 Method Info
 Instr/Acquire
 Data Anal
Select all 3, then click O.K.
iii.)The next screen will be as figure 170 below with a smaller window overlapping the right
bottom corner of larger window. The smaller window is info for sample injection source .
Then click O.K.
iiii.)Then click on the Injector (syringe) and follow the instruction on the screen. Then select
the Inlets and fill-in the parameters. When finished editing parameters , SAVE AS with new name.
NEXT THE MASS SPECTROMETER MUST BE TUNED
GC/MS Standard Operations Procedure
Before samples can be analyzed using the GC/MS, the mass spectrometer must be tuned.
The MS is tuned by adjusting several parameters while the Perfluorotributylamine (PFTBA,aka FC-43) is
injected into the MS chamber. Options are MANUAL tune or AUTOTUNE.
● AUTO TUNING is preferred. In INSTRUMENT CONTROL ,select Instrument, then select
PERFORM MS AUTOTUNE. After tune is finished name the results and save the results.
Below is the MANUAL procedure for tuning the GC/MS. However.
1) Click on the “Instrument #1” icon to start the Chemstation software.
2) From the “View” menu select “Manual Tune”.
3) When prompted “be sure changes are saved. Switch View Now?”, select “Yes”
4) In the “Manual Tune” view select the “AdjParam” menu to adjust the tune parameters.
5) From The “AdjParam” menu select “Edit MS Params” menu
6) From the ”edit MS Params” menu select “Scan” and you should see a similar PTFBA spectra a s
shown in Figure 2-1. Wait 30 seconds for the PFTBA levels to stabilize before changing any tune
parameters.
Figure 2-1. - Tuning with the PTFBA spectra
The scan from 10-700 amu should have less than 200 peaks. If there are more than 200 peaks then some
sort of contamination is entering the MS chamber and further trouble shooting should be done.
The mass spectrum of PFTBA has a base peak of 69 amu.
The relative abundance of the mass peak of 219 to the base peak in the PTFBA spectra should be between
40 and 85%.
The relative abundance of the mass peak of 502 to the base peak in the PTFBA spectra should be between
2.5 and 5%.
In the “mass” column in Figure 2-1, if the masses of 69, 219, and 502 are off by more than 0.2amu then the
mass axis should be adjusted. This is done by selecting “Mass Axis” from the calibrate menu. By doing this
the mass axis is automatically adjusted by the software.
The “Rel Abund” column shows the relative abundance of the 69, 219, and 502 masses. To adjust the
relative abundance, the EN lens and the EntLens offset parameters should be adjusted. The Entrance lens
parameters are inversely proportional to the relative abundance, which means that if you wish to increase the
relative abundance you should lower the entrance lens setting and vise versa.
The abundance of mass 69 should be between 200,000 and 400,000. To adjust the abundance the EM volts
parameter should be adjusted. The EM volts are directly proportional to the abundance. An increase in the
EM volts parameter will increase the abundance.
Click on the “Prof” button to get a profile of the 69, 219, and 502 peaks. The profiles are shown in Figure
2-2. The peak with at 50% of the peak height (Pw50) should be between 0.57- 0.63
→ Desired TARGETS
Peak #, should be < than 200
Adjust  effect
 
Em volts  Base 69 , Abundance should between 200,000  400,000
Entr lens  Mass values should be  0.2 amu
Mass  % (ratio to base peak )
69 = 100
219 = 40  85
502 = 2.5  5
after targets are satisfied then select PROFILE
A chromatogram of 3 Masses will be on screen
amu  Peaks widths ( pw ) should be between 0.57  0.63
PROFILE OF MASSES 69,219 & 502
Figure 2-2. Peak widths
To adjust the peak widths the amu gain and the amu off set parameters should be adjusted. The relationship
between the peak widths and the amu gain and the AMU off set are shown in Figure 2-3. In order to
increase the peak width the amu gain and the amu off set parameters should be decreased, and vice versa to
decrease the peak width.
Figure 2-3 Relationship between peak width and AMU gain and AMU offset
7) After changing the tune parameters print the parameter settings by selecting “print” from the file
menu.
8) Click on “OK” to leave the edit Parameters view.
9) Save the tune values by selecting “save tune values” from the file menu. Name the file & save .
10) Select “Top” from the view menu, to switch to the top view. When Prompted “be sure changes are
saved. Switch View Now?”, select “Yes” Note, if changes have not been saved go ahead and do so
now other wise the changes will be lost once the view has been switched.
After the mass spectrometer has been tuned then a sequence table will be prepared to run the samples using
the EXAMPLE in figure 2-4 below.
A STANDARD SHOULD BE THE FIRST INJECTION.
PREPARE a STANDARD, the system requires an injection, a chromatogram to activate the system’s
DATA ACQUISITION software. After first Analysis Report the system will permit editing the data
report. Edit items that relate to the components’ id on both the GC & MS .
●Next From TOP Menu select SEQUENCE, then select Edit Sample Log Table, to create a SAMPLE
LOG TABLE.
Fig.2-4 will be on screen
Figure 2-4: Sample Log Table
Select line 1, which then inputs in boxes Type, vial relate to line 1.
The vial number will always be 1
The data file name is limited to eight characters
The method for GC/MS analysis in fig.2-4 is AAVOC1
The sample name can be more descriptive and can be longer than eight characters.
More information about the sample can be entered in the Miscellaneous Information Box. Normally
such information and the sample volume and internal standard volume injected .
Repeat for other lines
The Expected Barcode Box is left blank.
Click on “OK” to close the sample log table.
Using the AS up to 8 samples can be analyzed.
* For a Single run; from INSTRUMENT CONTROL select Method, then RUN
**Another option is togo to INSTRUMENT CONTROL,then click on the upright sample vial.
*** A third option is running a SEQUENCE.
Ω Regardless of run option, figure 209 Acquisition- Sample Information will appear on screen, just after
deciding on injection option .
Next page was scanned, unable to edit it, jr
EXAMPLE; Figure 2-5 will appear for running a SEQUENCE
Fig. 2-5 Start sequence option
* Select “Run” from the “Sequence” menu to run the sequence. Figure 2-5 shows the start sequence
options
* Select “Full Method”, select “Inject anyway on Barcode Mismatch”. Do not select “Overwrite existing
data files”.
* Entering a sequence comment is optional.
* Enter your name under the operator name.
* Enter C:msdchem1DATAMeasurements Class for the data file directory
* Click on the “Run Sequence” button to run the sequence
After first Analysis Report the system will permit editing of the data report , parameters that relate to
the components’ id on both the GC & MS .
●Next are the following items , included are Agilent reference pages #s which are in more detail.
* Creating a GC Quantitation Data Base .
* Creating a MS Quantitation Data, (targent ion, qualifying ions, etc..)
* Calibrations Curves (levels)
* Library Search. Quantification, Peak purity
●●●●Included are Agilent’s procedures for some items, which would probably be better communicated on
actual instruments , sort of hand-on . See pages 8-33
** The items are:
Pftba MSDS included
 CREATING A QUANTITATION DATABASE
Procedure is below is for the MS data.For the GC there will only be the chromatogram, no ion spectrum.
Note; “ The order of compounds in the data base is VERY important. Internal standards must precede all
compounds that will be quantitated relative to it. Retention times order is NOT very important.”
“Any compound that will be treated as external standards must be entered before the first internal standard.”
●From the Desk Top select DATA ANALYSIS
 From Data Analysis, select CALIBRATE. Under Calibrate select SET-UP QUANTITATION.
●Opening screen is named, Quantitation DatabaseGlobals
1.)Enter a name (id) for title, in measure select %, in Curve Fit select Avg,.Response Factors, then click
O.K.
2.)The next screen is Edit Compound, which is empty. Click on Insert Above.
3.)The next screen will have the first injection’s chromatogram on top, and a smaller window on the
bottom right corner, labeled Quant Setup.
4.)To get the retention times. On the chromatogram move the mouse curser to the apex (top) of first
component,then double right click and the retention time will be appear Quant Setup window. Also
the spectrum of the compound will appear below the chromatogram.
Name the Compound.
5.)Next the targent ion and qualifying ions must be selected from the spectrum.
“ A target ion - - is an ion characteristic of the target compound, preferably one that distinguishes this
compound from any others with similar retention times. The extracted ion chromatogram for this ion will
be used for the quantitation. “
“ Qualifier ions—are selected from the mass spectrum of the target compound . The presence of these
ions in the correct amounts relative to the target ion gives evidence of correct target compound
identification. Depending on your choice of peak selection parameters, the qualifiers may influence how
the software chooses between multiple hits. “
For example isomers.
Selecting the taget ion.. On the compound spectrum place the curser which now is shaped like
cross-hair, over the selected target ion then click both mouse button at the same time. This will place that
ion in the quant setup box and will also calculation the relative ratio.
REPEAT this step for the rest of the qualifying ions.
***Then click the SAVE button
6.) Repeat all of step 4 above for the rest of the compounds.
7.) When finished click SAVE, then exit, then exit again.
Next is Calibration Curves
CREATING A CALIBRATION CURVE FOR A COMPOUND
* The procedure is bit similar to the SET-UP QUANTITATION from previous page
● Load the file that was just saved above on SET-QUANTITATION
●From DATA Analysis, select Generate Report, Save & name report.
●From DATA ANALYSIS , select Calibrate, then select Update,update level one, then click O.K.
i.)Move Mouse curser to desired component. The edit compound screen will appear . Select insert Above
and a screen will appear to add the concentration of the standard. SAVE.
ii.) Repeat this for each component, Saving each time.
iii.) It will ask if there are more levels (Std % concentrations).
●To add another level ( Std concentration) Repeat steps i,ii,iii. When finished name id and save
Calibrations Curves.
PFTBA MSDS will be included in Desk Copy.

More Related Content

What's hot

HPTLC Naveen Balaji
HPTLC Naveen BalajiHPTLC Naveen Balaji
HPTLC Naveen Balaji
Naveen Balaji
 
Atomic absorption spectrophotometry
Atomic absorption spectrophotometryAtomic absorption spectrophotometry
Atomic absorption spectrophotometry
Basil "Lexi" Bruno
 
To perform Analytical method validation of Paracetamol and Ibuprofen in pure ...
To perform Analytical method validation of Paracetamol and Ibuprofen in pure ...To perform Analytical method validation of Paracetamol and Ibuprofen in pure ...
To perform Analytical method validation of Paracetamol and Ibuprofen in pure ...
Aakashdeep Raval
 
Hptlc vs tlc
Hptlc vs tlcHptlc vs tlc
Hptlc vs tlc
ceutics1315
 
Brookfield SOP and Validation
Brookfield SOP and ValidationBrookfield SOP and Validation
Brookfield SOP and Validation
Sagar Patel
 
Qualification of Gas Chromatography
Qualification of Gas Chromatography Qualification of Gas Chromatography
Gas Chromatography-Mass Spectrometry
Gas Chromatography-Mass SpectrometryGas Chromatography-Mass Spectrometry
Gas Chromatography-Mass Spectrometry
Ayesha Ghafoor
 
Gas chromatography
Gas chromatographyGas chromatography
Gas chromatography
bhavya mitta
 
HPLC - Peak integration for chromatography
HPLC - Peak integration for chromatographyHPLC - Peak integration for chromatography
HPLC - Peak integration for chromatography
Sathish Vemula
 
Theory of high performance liquid chromatography ppt
Theory of high performance liquid chromatography pptTheory of high performance liquid chromatography ppt
Theory of high performance liquid chromatography ppt
shweta more
 
POTENTIAL SOURCES OF ELEMENTAL IMPURITIES
POTENTIAL SOURCES OF ELEMENTAL IMPURITIESPOTENTIAL SOURCES OF ELEMENTAL IMPURITIES
POTENTIAL SOURCES OF ELEMENTAL IMPURITIES
MehulJain143
 
Instrumentation and application of LC-MS/MS in bioanalysis
Instrumentation and application of LC-MS/MS in bioanalysisInstrumentation and application of LC-MS/MS in bioanalysis
Instrumentation and application of LC-MS/MS in bioanalysis
Dr. Amit Patel
 
GC-MS
GC-MSGC-MS
GC Agilent .pptx
GC Agilent .pptxGC Agilent .pptx
GC Agilent .pptx
Mohamad Mukharir
 
Calibration of analytical balance
Calibration of analytical balanceCalibration of analytical balance
Calibration of analytical balance
Subrat Acharya
 
Analytical method validation
Analytical method validationAnalytical method validation
Analytical method validation
Arti Thakkar
 
Column in gas chromatography
Column in gas chromatographyColumn in gas chromatography
Column in gas chromatography
KomalShambharakar
 
Herbal drugs and fingerprints
Herbal drugs and fingerprintsHerbal drugs and fingerprints
Herbal drugs and fingerprints
Springer
 
Quadrupole mass spectrometer
Quadrupole mass spectrometerQuadrupole mass spectrometer
Quadrupole mass spectrometer
Reshmi Rao
 
Atomic absorption spectroscopy.pptx
Atomic absorption spectroscopy.pptxAtomic absorption spectroscopy.pptx
Atomic absorption spectroscopy.pptx
Vandana Devesh Sharma
 

What's hot (20)

HPTLC Naveen Balaji
HPTLC Naveen BalajiHPTLC Naveen Balaji
HPTLC Naveen Balaji
 
Atomic absorption spectrophotometry
Atomic absorption spectrophotometryAtomic absorption spectrophotometry
Atomic absorption spectrophotometry
 
To perform Analytical method validation of Paracetamol and Ibuprofen in pure ...
To perform Analytical method validation of Paracetamol and Ibuprofen in pure ...To perform Analytical method validation of Paracetamol and Ibuprofen in pure ...
To perform Analytical method validation of Paracetamol and Ibuprofen in pure ...
 
Hptlc vs tlc
Hptlc vs tlcHptlc vs tlc
Hptlc vs tlc
 
Brookfield SOP and Validation
Brookfield SOP and ValidationBrookfield SOP and Validation
Brookfield SOP and Validation
 
Qualification of Gas Chromatography
Qualification of Gas Chromatography Qualification of Gas Chromatography
Qualification of Gas Chromatography
 
Gas Chromatography-Mass Spectrometry
Gas Chromatography-Mass SpectrometryGas Chromatography-Mass Spectrometry
Gas Chromatography-Mass Spectrometry
 
Gas chromatography
Gas chromatographyGas chromatography
Gas chromatography
 
HPLC - Peak integration for chromatography
HPLC - Peak integration for chromatographyHPLC - Peak integration for chromatography
HPLC - Peak integration for chromatography
 
Theory of high performance liquid chromatography ppt
Theory of high performance liquid chromatography pptTheory of high performance liquid chromatography ppt
Theory of high performance liquid chromatography ppt
 
POTENTIAL SOURCES OF ELEMENTAL IMPURITIES
POTENTIAL SOURCES OF ELEMENTAL IMPURITIESPOTENTIAL SOURCES OF ELEMENTAL IMPURITIES
POTENTIAL SOURCES OF ELEMENTAL IMPURITIES
 
Instrumentation and application of LC-MS/MS in bioanalysis
Instrumentation and application of LC-MS/MS in bioanalysisInstrumentation and application of LC-MS/MS in bioanalysis
Instrumentation and application of LC-MS/MS in bioanalysis
 
GC-MS
GC-MSGC-MS
GC-MS
 
GC Agilent .pptx
GC Agilent .pptxGC Agilent .pptx
GC Agilent .pptx
 
Calibration of analytical balance
Calibration of analytical balanceCalibration of analytical balance
Calibration of analytical balance
 
Analytical method validation
Analytical method validationAnalytical method validation
Analytical method validation
 
Column in gas chromatography
Column in gas chromatographyColumn in gas chromatography
Column in gas chromatography
 
Herbal drugs and fingerprints
Herbal drugs and fingerprintsHerbal drugs and fingerprints
Herbal drugs and fingerprints
 
Quadrupole mass spectrometer
Quadrupole mass spectrometerQuadrupole mass spectrometer
Quadrupole mass spectrometer
 
Atomic absorption spectroscopy.pptx
Atomic absorption spectroscopy.pptxAtomic absorption spectroscopy.pptx
Atomic absorption spectroscopy.pptx
 

Viewers also liked

Write a treatment
Write a treatmentWrite a treatment
Write a treatment
copelandadam
 
ВОЗМОЖНОСТИ ОЦЕНКИ, КЛАССИФИКАЦИЯ И ХАРАКТЕРНЫЕ ПРИЗНАКИ МЕДИЦИНСКОЙ ЛЖЕНАУКИ
ВОЗМОЖНОСТИ ОЦЕНКИ, КЛАССИФИКАЦИЯ  И ХАРАКТЕРНЫЕ ПРИЗНАКИ  МЕДИЦИНСКОЙ ЛЖЕНАУКИВОЗМОЖНОСТИ ОЦЕНКИ, КЛАССИФИКАЦИЯ  И ХАРАКТЕРНЫЕ ПРИЗНАКИ  МЕДИЦИНСКОЙ ЛЖЕНАУКИ
ВОЗМОЖНОСТИ ОЦЕНКИ, КЛАССИФИКАЦИЯ И ХАРАКТЕРНЫЕ ПРИЗНАКИ МЕДИЦИНСКОЙ ЛЖЕНАУКИ
Sergey Soshnikov
 
Carboidratos
CarboidratosCarboidratos
Carboidratos
Lana Delly Nascimento
 
Reporting Results in Your Community: Annual Reports to Communicate WTC Missio...
Reporting Results in Your Community: Annual Reports to Communicate WTC Missio...Reporting Results in Your Community: Annual Reports to Communicate WTC Missio...
Reporting Results in Your Community: Annual Reports to Communicate WTC Missio...
mcollen
 
Thinks - Monday
Thinks - MondayThinks - Monday
Thinks - Monday
jwickberg
 
PROGRAM SALES 1516 ANNUAL REPORT
PROGRAM SALES 1516 ANNUAL REPORTPROGRAM SALES 1516 ANNUAL REPORT
PROGRAM SALES 1516 ANNUAL REPORT
Muhammad Luqman Zakariya
 
Untitled Presentation
Untitled PresentationUntitled Presentation
Untitled Presentation
Kirsten Law
 
3 min Pitch Deck - Learnize
3 min Pitch Deck - Learnize3 min Pitch Deck - Learnize
3 min Pitch Deck - Learnize
Dhiraj Singh
 
Presentación Libro 2 de Rocío Chirinos Unidad 1
Presentación Libro 2 de Rocío Chirinos Unidad 1Presentación Libro 2 de Rocío Chirinos Unidad 1
Presentación Libro 2 de Rocío Chirinos Unidad 1
JaimeTrelles
 
Conflicto armado en colombia
Conflicto armado en colombiaConflicto armado en colombia
Conflicto armado en colombia
Adriana Marcela Veloza Gonzalez
 
IDCC 17 26 Annexe 1 critères classants etam et cadres
IDCC 17 26 Annexe 1 critères classants etam et cadresIDCC 17 26 Annexe 1 critères classants etam et cadres
IDCC 17 26 Annexe 1 critères classants etam et cadres
Société Tripalio
 
L économie collaborative à l'ère de la société fluide
L économie collaborative à l'ère de la société fluideL économie collaborative à l'ère de la société fluide
L économie collaborative à l'ère de la société fluide
Célya Gruson-Daniel
 
Vik Muniz
Vik MunizVik Muniz
Vik Muniz
Bruna Batista
 
Concurso Guerra del Pacífico
Concurso Guerra del PacíficoConcurso Guerra del Pacífico
Concurso Guerra del Pacífico
JaimeTrelles
 
Precios de Paquetes Fotograficos
Precios de Paquetes FotograficosPrecios de Paquetes Fotograficos
Precios de Paquetes Fotograficos
Karla Otz
 
Harriet Kivumbi-CV-May 2015- Consultant
Harriet Kivumbi-CV-May 2015- ConsultantHarriet Kivumbi-CV-May 2015- Consultant
Harriet Kivumbi-CV-May 2015- Consultant
Dr. Harriet Kivumbi
 
Pausas activas
 Pausas activas Pausas activas
Pausas activas
Hamilton Polo Salas
 
2011 ILIAS Conference Berne ILIAS mobile
2011 ILIAS Conference Berne ILIAS mobile2011 ILIAS Conference Berne ILIAS mobile
2011 ILIAS Conference Berne ILIAS mobileFabian Schmid
 

Viewers also liked (18)

Write a treatment
Write a treatmentWrite a treatment
Write a treatment
 
ВОЗМОЖНОСТИ ОЦЕНКИ, КЛАССИФИКАЦИЯ И ХАРАКТЕРНЫЕ ПРИЗНАКИ МЕДИЦИНСКОЙ ЛЖЕНАУКИ
ВОЗМОЖНОСТИ ОЦЕНКИ, КЛАССИФИКАЦИЯ  И ХАРАКТЕРНЫЕ ПРИЗНАКИ  МЕДИЦИНСКОЙ ЛЖЕНАУКИВОЗМОЖНОСТИ ОЦЕНКИ, КЛАССИФИКАЦИЯ  И ХАРАКТЕРНЫЕ ПРИЗНАКИ  МЕДИЦИНСКОЙ ЛЖЕНАУКИ
ВОЗМОЖНОСТИ ОЦЕНКИ, КЛАССИФИКАЦИЯ И ХАРАКТЕРНЫЕ ПРИЗНАКИ МЕДИЦИНСКОЙ ЛЖЕНАУКИ
 
Carboidratos
CarboidratosCarboidratos
Carboidratos
 
Reporting Results in Your Community: Annual Reports to Communicate WTC Missio...
Reporting Results in Your Community: Annual Reports to Communicate WTC Missio...Reporting Results in Your Community: Annual Reports to Communicate WTC Missio...
Reporting Results in Your Community: Annual Reports to Communicate WTC Missio...
 
Thinks - Monday
Thinks - MondayThinks - Monday
Thinks - Monday
 
PROGRAM SALES 1516 ANNUAL REPORT
PROGRAM SALES 1516 ANNUAL REPORTPROGRAM SALES 1516 ANNUAL REPORT
PROGRAM SALES 1516 ANNUAL REPORT
 
Untitled Presentation
Untitled PresentationUntitled Presentation
Untitled Presentation
 
3 min Pitch Deck - Learnize
3 min Pitch Deck - Learnize3 min Pitch Deck - Learnize
3 min Pitch Deck - Learnize
 
Presentación Libro 2 de Rocío Chirinos Unidad 1
Presentación Libro 2 de Rocío Chirinos Unidad 1Presentación Libro 2 de Rocío Chirinos Unidad 1
Presentación Libro 2 de Rocío Chirinos Unidad 1
 
Conflicto armado en colombia
Conflicto armado en colombiaConflicto armado en colombia
Conflicto armado en colombia
 
IDCC 17 26 Annexe 1 critères classants etam et cadres
IDCC 17 26 Annexe 1 critères classants etam et cadresIDCC 17 26 Annexe 1 critères classants etam et cadres
IDCC 17 26 Annexe 1 critères classants etam et cadres
 
L économie collaborative à l'ère de la société fluide
L économie collaborative à l'ère de la société fluideL économie collaborative à l'ère de la société fluide
L économie collaborative à l'ère de la société fluide
 
Vik Muniz
Vik MunizVik Muniz
Vik Muniz
 
Concurso Guerra del Pacífico
Concurso Guerra del PacíficoConcurso Guerra del Pacífico
Concurso Guerra del Pacífico
 
Precios de Paquetes Fotograficos
Precios de Paquetes FotograficosPrecios de Paquetes Fotograficos
Precios de Paquetes Fotograficos
 
Harriet Kivumbi-CV-May 2015- Consultant
Harriet Kivumbi-CV-May 2015- ConsultantHarriet Kivumbi-CV-May 2015- Consultant
Harriet Kivumbi-CV-May 2015- Consultant
 
Pausas activas
 Pausas activas Pausas activas
Pausas activas
 
2011 ILIAS Conference Berne ILIAS mobile
2011 ILIAS Conference Berne ILIAS mobile2011 ILIAS Conference Berne ILIAS mobile
2011 ILIAS Conference Berne ILIAS mobile
 

Similar to Basic SOP for Agilent 6890/5973 system

SHORT CIRCUIT analysis
SHORT CIRCUIT analysisSHORT CIRCUIT analysis
SHORT CIRCUIT analysis
Arvind Akkanna
 
Medidor digital de presion 680 UserManual.pdf
Medidor digital de presion 680 UserManual.pdfMedidor digital de presion 680 UserManual.pdf
Medidor digital de presion 680 UserManual.pdf
JuanRios958368
 
Pf700 energy savings_lab
Pf700 energy savings_labPf700 energy savings_lab
Pf700 energy savings_lab
confidencial
 
Discussion on modern trend in measurement, Combustion control,optimization.pptx
Discussion on modern trend in measurement, Combustion control,optimization.pptxDiscussion on modern trend in measurement, Combustion control,optimization.pptx
Discussion on modern trend in measurement, Combustion control,optimization.pptx
kazi galib
 
Rheological properties using model 900 viscometer
Rheological properties using model 900 viscometerRheological properties using model 900 viscometer
Rheological properties using model 900 viscometer
Kamal Abdurahman
 
Rotary vortex flow meters
Rotary vortex flow metersRotary vortex flow meters
Panoura 18S Pan-Only Calibration and Alignment Quick Guide
Panoura 18S Pan-Only Calibration and Alignment Quick GuidePanoura 18S Pan-Only Calibration and Alignment Quick Guide
Panoura 18S Pan-Only Calibration and Alignment Quick Guide
Don Vibbert
 
References1. HCS 2010 online manuals.2. Data Data provi.docx
References1. HCS 2010 online manuals.2. Data  Data provi.docxReferences1. HCS 2010 online manuals.2. Data  Data provi.docx
References1. HCS 2010 online manuals.2. Data Data provi.docx
debishakespeare
 
Abi7900 ht2.1e
Abi7900 ht2.1eAbi7900 ht2.1e
Abi7900 ht2.1e
Elsa von Licy
 
Albion Devices, Inc Micro Computer Gaging System
Albion Devices, Inc  Micro  Computer Gaging System Albion Devices, Inc  Micro  Computer Gaging System
Albion Devices, Inc Micro Computer Gaging System
Albion Devices, Inc.
 
Fadal Command Menus: User Manual
Fadal Command Menus: User ManualFadal Command Menus: User Manual
Fadal Command Menus: User Manual
Independent Technology Service Inc
 
Abi7900 ht2.3e
Abi7900 ht2.3eAbi7900 ht2.3e
Abi7900 ht2.3e
Elsa von Licy
 
Abi75001.3.0 e
Abi75001.3.0 eAbi75001.3.0 e
Abi75001.3.0 e
Elsa von Licy
 
Hy jk02-m 5-axis interface board manual
Hy jk02-m 5-axis interface board manualHy jk02-m 5-axis interface board manual
Hy jk02-m 5-axis interface board manual
Khunut Thi-ai
 
63610-80-20 CalibrationTC
63610-80-20 CalibrationTC63610-80-20 CalibrationTC
63610-80-20 CalibrationTC
Traian Cojocneanu
 
Panoura 18S with Ceph Calibration and Alignment Quick Guide
Panoura 18S with Ceph Calibration and Alignment Quick GuidePanoura 18S with Ceph Calibration and Alignment Quick Guide
Panoura 18S with Ceph Calibration and Alignment Quick Guide
Don Vibbert
 
Prosper part 1.pdf
Prosper part 1.pdfProsper part 1.pdf
Prosper part 1.pdf
HazemKolieb
 
Cn mx3000 p_20120808e
Cn mx3000 p_20120808eCn mx3000 p_20120808e
Cn mx3000 p_20120808e
Elsa von Licy
 
OFFPIPE Assistant User Manual 2.0.3
OFFPIPE Assistant User Manual 2.0.3OFFPIPE Assistant User Manual 2.0.3
OFFPIPE Assistant User Manual 2.0.3
OFFPIPE Assistant
 
Snb 3 viscometer manual
Snb 3  viscometer manualSnb 3  viscometer manual
Snb 3 viscometer manual
BugusuNyamweru1
 

Similar to Basic SOP for Agilent 6890/5973 system (20)

SHORT CIRCUIT analysis
SHORT CIRCUIT analysisSHORT CIRCUIT analysis
SHORT CIRCUIT analysis
 
Medidor digital de presion 680 UserManual.pdf
Medidor digital de presion 680 UserManual.pdfMedidor digital de presion 680 UserManual.pdf
Medidor digital de presion 680 UserManual.pdf
 
Pf700 energy savings_lab
Pf700 energy savings_labPf700 energy savings_lab
Pf700 energy savings_lab
 
Discussion on modern trend in measurement, Combustion control,optimization.pptx
Discussion on modern trend in measurement, Combustion control,optimization.pptxDiscussion on modern trend in measurement, Combustion control,optimization.pptx
Discussion on modern trend in measurement, Combustion control,optimization.pptx
 
Rheological properties using model 900 viscometer
Rheological properties using model 900 viscometerRheological properties using model 900 viscometer
Rheological properties using model 900 viscometer
 
Rotary vortex flow meters
Rotary vortex flow metersRotary vortex flow meters
Rotary vortex flow meters
 
Panoura 18S Pan-Only Calibration and Alignment Quick Guide
Panoura 18S Pan-Only Calibration and Alignment Quick GuidePanoura 18S Pan-Only Calibration and Alignment Quick Guide
Panoura 18S Pan-Only Calibration and Alignment Quick Guide
 
References1. HCS 2010 online manuals.2. Data Data provi.docx
References1. HCS 2010 online manuals.2. Data  Data provi.docxReferences1. HCS 2010 online manuals.2. Data  Data provi.docx
References1. HCS 2010 online manuals.2. Data Data provi.docx
 
Abi7900 ht2.1e
Abi7900 ht2.1eAbi7900 ht2.1e
Abi7900 ht2.1e
 
Albion Devices, Inc Micro Computer Gaging System
Albion Devices, Inc  Micro  Computer Gaging System Albion Devices, Inc  Micro  Computer Gaging System
Albion Devices, Inc Micro Computer Gaging System
 
Fadal Command Menus: User Manual
Fadal Command Menus: User ManualFadal Command Menus: User Manual
Fadal Command Menus: User Manual
 
Abi7900 ht2.3e
Abi7900 ht2.3eAbi7900 ht2.3e
Abi7900 ht2.3e
 
Abi75001.3.0 e
Abi75001.3.0 eAbi75001.3.0 e
Abi75001.3.0 e
 
Hy jk02-m 5-axis interface board manual
Hy jk02-m 5-axis interface board manualHy jk02-m 5-axis interface board manual
Hy jk02-m 5-axis interface board manual
 
63610-80-20 CalibrationTC
63610-80-20 CalibrationTC63610-80-20 CalibrationTC
63610-80-20 CalibrationTC
 
Panoura 18S with Ceph Calibration and Alignment Quick Guide
Panoura 18S with Ceph Calibration and Alignment Quick GuidePanoura 18S with Ceph Calibration and Alignment Quick Guide
Panoura 18S with Ceph Calibration and Alignment Quick Guide
 
Prosper part 1.pdf
Prosper part 1.pdfProsper part 1.pdf
Prosper part 1.pdf
 
Cn mx3000 p_20120808e
Cn mx3000 p_20120808eCn mx3000 p_20120808e
Cn mx3000 p_20120808e
 
OFFPIPE Assistant User Manual 2.0.3
OFFPIPE Assistant User Manual 2.0.3OFFPIPE Assistant User Manual 2.0.3
OFFPIPE Assistant User Manual 2.0.3
 
Snb 3 viscometer manual
Snb 3  viscometer manualSnb 3  viscometer manual
Snb 3 viscometer manual
 

More from TAMUK

Quartus_19.1_stand_ed_installingonPC.pdf
Quartus_19.1_stand_ed_installingonPC.pdfQuartus_19.1_stand_ed_installingonPC.pdf
Quartus_19.1_stand_ed_installingonPC.pdf
TAMUK
 
Dasibi 1008 Ozone Monitor Manual
Dasibi 1008 Ozone Monitor Manual Dasibi 1008 Ozone Monitor Manual
Dasibi 1008 Ozone Monitor Manual
TAMUK
 
Voltage Drop Calculator for Street Lighting
Voltage Drop Calculator for Street LightingVoltage Drop Calculator for Street Lighting
Voltage Drop Calculator for Street Lighting
TAMUK
 
Using an Agilent 6890 GCMS with Entech Canister Sampler
Using an Agilent 6890 GCMS with Entech Canister SamplerUsing an Agilent 6890 GCMS with Entech Canister Sampler
Using an Agilent 6890 GCMS with Entech Canister Sampler
TAMUK
 
Use electsftylab-dwm
Use electsftylab-dwmUse electsftylab-dwm
Use electsftylab-dwm
TAMUK
 
Use lab safety-dwm
Use lab safety-dwm Use lab safety-dwm
Use lab safety-dwm
TAMUK
 
Lab colloid chemistry & turbidity
Lab colloid chemistry & turbidityLab colloid chemistry & turbidity
Lab colloid chemistry & turbidity
TAMUK
 
Lab Batch Reactors
Lab Batch ReactorsLab Batch Reactors
Lab Batch Reactors
TAMUK
 
Site Operation Manual for a Typical Air Monitoring Site
Site Operation Manual for a Typical Air Monitoring SiteSite Operation Manual for a Typical Air Monitoring Site
Site Operation Manual for a Typical Air Monitoring Site
TAMUK
 
Wiring a pH and Conductivity Probe to a Zeno3200
Wiring a pH and Conductivity Probe to a Zeno3200Wiring a pH and Conductivity Probe to a Zeno3200
Wiring a pH and Conductivity Probe to a Zeno3200
TAMUK
 
Using a Zeno 3200
Using a Zeno 3200Using a Zeno 3200
Using a Zeno 3200
TAMUK
 
Settingupgsm1208modem
Settingupgsm1208modemSettingupgsm1208modem
Settingupgsm1208modem
TAMUK
 
Kpsi User Guide Model 500
Kpsi User Guide Model 500Kpsi User Guide Model 500
Kpsi User Guide Model 500
TAMUK
 
2014 environmental engineeringlabmanual
2014 environmental engineeringlabmanual2014 environmental engineeringlabmanual
2014 environmental engineeringlabmanual
TAMUK
 
X-Series ICPMS User Guide
X-Series ICPMS User GuideX-Series ICPMS User Guide
X-Series ICPMS User Guide
TAMUK
 
Performance checks dasibi ozone-v2
Performance checks dasibi ozone-v2Performance checks dasibi ozone-v2
Performance checks dasibi ozone-v2
TAMUK
 
Calibration dasibi-ozone
Calibration dasibi-ozoneCalibration dasibi-ozone
Calibration dasibi-ozone
TAMUK
 
Method to expose rats to ozone-updated2014
Method to expose rats to ozone-updated2014Method to expose rats to ozone-updated2014
Method to expose rats to ozone-updated2014
TAMUK
 
Criteria Air Pollutants and Ambient Air Monitoring
Criteria Air Pollutants and Ambient Air MonitoringCriteria Air Pollutants and Ambient Air Monitoring
Criteria Air Pollutants and Ambient Air Monitoring
TAMUK
 
4 lab-tss-tds-vss
4 lab-tss-tds-vss4 lab-tss-tds-vss
4 lab-tss-tds-vss
TAMUK
 

More from TAMUK (20)

Quartus_19.1_stand_ed_installingonPC.pdf
Quartus_19.1_stand_ed_installingonPC.pdfQuartus_19.1_stand_ed_installingonPC.pdf
Quartus_19.1_stand_ed_installingonPC.pdf
 
Dasibi 1008 Ozone Monitor Manual
Dasibi 1008 Ozone Monitor Manual Dasibi 1008 Ozone Monitor Manual
Dasibi 1008 Ozone Monitor Manual
 
Voltage Drop Calculator for Street Lighting
Voltage Drop Calculator for Street LightingVoltage Drop Calculator for Street Lighting
Voltage Drop Calculator for Street Lighting
 
Using an Agilent 6890 GCMS with Entech Canister Sampler
Using an Agilent 6890 GCMS with Entech Canister SamplerUsing an Agilent 6890 GCMS with Entech Canister Sampler
Using an Agilent 6890 GCMS with Entech Canister Sampler
 
Use electsftylab-dwm
Use electsftylab-dwmUse electsftylab-dwm
Use electsftylab-dwm
 
Use lab safety-dwm
Use lab safety-dwm Use lab safety-dwm
Use lab safety-dwm
 
Lab colloid chemistry & turbidity
Lab colloid chemistry & turbidityLab colloid chemistry & turbidity
Lab colloid chemistry & turbidity
 
Lab Batch Reactors
Lab Batch ReactorsLab Batch Reactors
Lab Batch Reactors
 
Site Operation Manual for a Typical Air Monitoring Site
Site Operation Manual for a Typical Air Monitoring SiteSite Operation Manual for a Typical Air Monitoring Site
Site Operation Manual for a Typical Air Monitoring Site
 
Wiring a pH and Conductivity Probe to a Zeno3200
Wiring a pH and Conductivity Probe to a Zeno3200Wiring a pH and Conductivity Probe to a Zeno3200
Wiring a pH and Conductivity Probe to a Zeno3200
 
Using a Zeno 3200
Using a Zeno 3200Using a Zeno 3200
Using a Zeno 3200
 
Settingupgsm1208modem
Settingupgsm1208modemSettingupgsm1208modem
Settingupgsm1208modem
 
Kpsi User Guide Model 500
Kpsi User Guide Model 500Kpsi User Guide Model 500
Kpsi User Guide Model 500
 
2014 environmental engineeringlabmanual
2014 environmental engineeringlabmanual2014 environmental engineeringlabmanual
2014 environmental engineeringlabmanual
 
X-Series ICPMS User Guide
X-Series ICPMS User GuideX-Series ICPMS User Guide
X-Series ICPMS User Guide
 
Performance checks dasibi ozone-v2
Performance checks dasibi ozone-v2Performance checks dasibi ozone-v2
Performance checks dasibi ozone-v2
 
Calibration dasibi-ozone
Calibration dasibi-ozoneCalibration dasibi-ozone
Calibration dasibi-ozone
 
Method to expose rats to ozone-updated2014
Method to expose rats to ozone-updated2014Method to expose rats to ozone-updated2014
Method to expose rats to ozone-updated2014
 
Criteria Air Pollutants and Ambient Air Monitoring
Criteria Air Pollutants and Ambient Air MonitoringCriteria Air Pollutants and Ambient Air Monitoring
Criteria Air Pollutants and Ambient Air Monitoring
 
4 lab-tss-tds-vss
4 lab-tss-tds-vss4 lab-tss-tds-vss
4 lab-tss-tds-vss
 

Recently uploaded

Improving the Management of Peatlands and the Capacities of Stakeholders in I...
Improving the Management of Peatlands and the Capacities of Stakeholders in I...Improving the Management of Peatlands and the Capacities of Stakeholders in I...
Improving the Management of Peatlands and the Capacities of Stakeholders in I...
Global Landscapes Forum (GLF)
 
Enhanced action and stakeholder engagement for sustainable peatland management
Enhanced action and stakeholder engagement for sustainable peatland managementEnhanced action and stakeholder engagement for sustainable peatland management
Enhanced action and stakeholder engagement for sustainable peatland management
Global Landscapes Forum (GLF)
 
ENVIRONMENT~ Renewable Energy Sources and their future prospects.
ENVIRONMENT~ Renewable Energy Sources and their future prospects.ENVIRONMENT~ Renewable Energy Sources and their future prospects.
ENVIRONMENT~ Renewable Energy Sources and their future prospects.
tiwarimanvi3129
 
原版制作(Newcastle毕业证书)纽卡斯尔大学毕业证在读证明一模一样
原版制作(Newcastle毕业证书)纽卡斯尔大学毕业证在读证明一模一样原版制作(Newcastle毕业证书)纽卡斯尔大学毕业证在读证明一模一样
原版制作(Newcastle毕业证书)纽卡斯尔大学毕业证在读证明一模一样
p2npnqp
 
在线办理(lboro毕业证书)拉夫堡大学毕业证学历证书一模一样
在线办理(lboro毕业证书)拉夫堡大学毕业证学历证书一模一样在线办理(lboro毕业证书)拉夫堡大学毕业证学历证书一模一样
在线办理(lboro毕业证书)拉夫堡大学毕业证学历证书一模一样
pjq9n1lk
 
Global Peatlands Map and Hotspot Explanation Atlas
Global Peatlands Map and Hotspot Explanation AtlasGlobal Peatlands Map and Hotspot Explanation Atlas
Global Peatlands Map and Hotspot Explanation Atlas
Global Landscapes Forum (GLF)
 
Promoting Multilateral Cooperation for Sustainable Peatland management
Promoting Multilateral Cooperation for Sustainable Peatland managementPromoting Multilateral Cooperation for Sustainable Peatland management
Promoting Multilateral Cooperation for Sustainable Peatland management
Global Landscapes Forum (GLF)
 
Wildlife-AnIntroduction.pdf so that you know more about our environment
Wildlife-AnIntroduction.pdf so that you know more about our environmentWildlife-AnIntroduction.pdf so that you know more about our environment
Wildlife-AnIntroduction.pdf so that you know more about our environment
amishajha2407
 
一比一原版(UMTC毕业证书)明尼苏达大学双城分校毕业证如何办理
一比一原版(UMTC毕业证书)明尼苏达大学双城分校毕业证如何办理一比一原版(UMTC毕业证书)明尼苏达大学双城分校毕业证如何办理
一比一原版(UMTC毕业证书)明尼苏达大学双城分校毕业证如何办理
zm9ajxup
 
Evolving Lifecycles with High Resolution Site Characterization (HRSC) and 3-D...
Evolving Lifecycles with High Resolution Site Characterization (HRSC) and 3-D...Evolving Lifecycles with High Resolution Site Characterization (HRSC) and 3-D...
Evolving Lifecycles with High Resolution Site Characterization (HRSC) and 3-D...
Joshua Orris
 
Peatlands of Latin America and the Caribbean
Peatlands of Latin America and the CaribbeanPeatlands of Latin America and the Caribbean
Peatlands of Latin America and the Caribbean
Global Landscapes Forum (GLF)
 
Microbial characterisation and identification, and potability of River Kuywa ...
Microbial characterisation and identification, and potability of River Kuywa ...Microbial characterisation and identification, and potability of River Kuywa ...
Microbial characterisation and identification, and potability of River Kuywa ...
Open Access Research Paper
 
Overview of the Global Peatlands Assessment
Overview of the Global Peatlands AssessmentOverview of the Global Peatlands Assessment
Overview of the Global Peatlands Assessment
Global Landscapes Forum (GLF)
 
Improving the viability of probiotics by encapsulation methods for developmen...
Improving the viability of probiotics by encapsulation methods for developmen...Improving the viability of probiotics by encapsulation methods for developmen...
Improving the viability of probiotics by encapsulation methods for developmen...
Open Access Research Paper
 
Kinetic studies on malachite green dye adsorption from aqueous solutions by A...
Kinetic studies on malachite green dye adsorption from aqueous solutions by A...Kinetic studies on malachite green dye adsorption from aqueous solutions by A...
Kinetic studies on malachite green dye adsorption from aqueous solutions by A...
Open Access Research Paper
 
Global Climate Change and global warming
Global Climate Change and global warmingGlobal Climate Change and global warming
Global Climate Change and global warming
ballkicker20
 
Climate Change All over the World .pptx
Climate Change All over the World  .pptxClimate Change All over the World  .pptx
Climate Change All over the World .pptx
sairaanwer024
 
DENR-PENRO-Bulacan-Presentation Philippine EIS
DENR-PENRO-Bulacan-Presentation Philippine EISDENR-PENRO-Bulacan-Presentation Philippine EIS
DENR-PENRO-Bulacan-Presentation Philippine EIS
MarlonJayBayag
 
Peatland Management in Indonesia, Science to Policy and Knowledge Education
Peatland Management in Indonesia, Science to Policy and Knowledge EducationPeatland Management in Indonesia, Science to Policy and Knowledge Education
Peatland Management in Indonesia, Science to Policy and Knowledge Education
Global Landscapes Forum (GLF)
 
Epcon is One of the World's leading Manufacturing Companies.
Epcon is One of the World's leading Manufacturing Companies.Epcon is One of the World's leading Manufacturing Companies.
Epcon is One of the World's leading Manufacturing Companies.
EpconLP
 

Recently uploaded (20)

Improving the Management of Peatlands and the Capacities of Stakeholders in I...
Improving the Management of Peatlands and the Capacities of Stakeholders in I...Improving the Management of Peatlands and the Capacities of Stakeholders in I...
Improving the Management of Peatlands and the Capacities of Stakeholders in I...
 
Enhanced action and stakeholder engagement for sustainable peatland management
Enhanced action and stakeholder engagement for sustainable peatland managementEnhanced action and stakeholder engagement for sustainable peatland management
Enhanced action and stakeholder engagement for sustainable peatland management
 
ENVIRONMENT~ Renewable Energy Sources and their future prospects.
ENVIRONMENT~ Renewable Energy Sources and their future prospects.ENVIRONMENT~ Renewable Energy Sources and their future prospects.
ENVIRONMENT~ Renewable Energy Sources and their future prospects.
 
原版制作(Newcastle毕业证书)纽卡斯尔大学毕业证在读证明一模一样
原版制作(Newcastle毕业证书)纽卡斯尔大学毕业证在读证明一模一样原版制作(Newcastle毕业证书)纽卡斯尔大学毕业证在读证明一模一样
原版制作(Newcastle毕业证书)纽卡斯尔大学毕业证在读证明一模一样
 
在线办理(lboro毕业证书)拉夫堡大学毕业证学历证书一模一样
在线办理(lboro毕业证书)拉夫堡大学毕业证学历证书一模一样在线办理(lboro毕业证书)拉夫堡大学毕业证学历证书一模一样
在线办理(lboro毕业证书)拉夫堡大学毕业证学历证书一模一样
 
Global Peatlands Map and Hotspot Explanation Atlas
Global Peatlands Map and Hotspot Explanation AtlasGlobal Peatlands Map and Hotspot Explanation Atlas
Global Peatlands Map and Hotspot Explanation Atlas
 
Promoting Multilateral Cooperation for Sustainable Peatland management
Promoting Multilateral Cooperation for Sustainable Peatland managementPromoting Multilateral Cooperation for Sustainable Peatland management
Promoting Multilateral Cooperation for Sustainable Peatland management
 
Wildlife-AnIntroduction.pdf so that you know more about our environment
Wildlife-AnIntroduction.pdf so that you know more about our environmentWildlife-AnIntroduction.pdf so that you know more about our environment
Wildlife-AnIntroduction.pdf so that you know more about our environment
 
一比一原版(UMTC毕业证书)明尼苏达大学双城分校毕业证如何办理
一比一原版(UMTC毕业证书)明尼苏达大学双城分校毕业证如何办理一比一原版(UMTC毕业证书)明尼苏达大学双城分校毕业证如何办理
一比一原版(UMTC毕业证书)明尼苏达大学双城分校毕业证如何办理
 
Evolving Lifecycles with High Resolution Site Characterization (HRSC) and 3-D...
Evolving Lifecycles with High Resolution Site Characterization (HRSC) and 3-D...Evolving Lifecycles with High Resolution Site Characterization (HRSC) and 3-D...
Evolving Lifecycles with High Resolution Site Characterization (HRSC) and 3-D...
 
Peatlands of Latin America and the Caribbean
Peatlands of Latin America and the CaribbeanPeatlands of Latin America and the Caribbean
Peatlands of Latin America and the Caribbean
 
Microbial characterisation and identification, and potability of River Kuywa ...
Microbial characterisation and identification, and potability of River Kuywa ...Microbial characterisation and identification, and potability of River Kuywa ...
Microbial characterisation and identification, and potability of River Kuywa ...
 
Overview of the Global Peatlands Assessment
Overview of the Global Peatlands AssessmentOverview of the Global Peatlands Assessment
Overview of the Global Peatlands Assessment
 
Improving the viability of probiotics by encapsulation methods for developmen...
Improving the viability of probiotics by encapsulation methods for developmen...Improving the viability of probiotics by encapsulation methods for developmen...
Improving the viability of probiotics by encapsulation methods for developmen...
 
Kinetic studies on malachite green dye adsorption from aqueous solutions by A...
Kinetic studies on malachite green dye adsorption from aqueous solutions by A...Kinetic studies on malachite green dye adsorption from aqueous solutions by A...
Kinetic studies on malachite green dye adsorption from aqueous solutions by A...
 
Global Climate Change and global warming
Global Climate Change and global warmingGlobal Climate Change and global warming
Global Climate Change and global warming
 
Climate Change All over the World .pptx
Climate Change All over the World  .pptxClimate Change All over the World  .pptx
Climate Change All over the World .pptx
 
DENR-PENRO-Bulacan-Presentation Philippine EIS
DENR-PENRO-Bulacan-Presentation Philippine EISDENR-PENRO-Bulacan-Presentation Philippine EIS
DENR-PENRO-Bulacan-Presentation Philippine EIS
 
Peatland Management in Indonesia, Science to Policy and Knowledge Education
Peatland Management in Indonesia, Science to Policy and Knowledge EducationPeatland Management in Indonesia, Science to Policy and Knowledge Education
Peatland Management in Indonesia, Science to Policy and Knowledge Education
 
Epcon is One of the World's leading Manufacturing Companies.
Epcon is One of the World's leading Manufacturing Companies.Epcon is One of the World's leading Manufacturing Companies.
Epcon is One of the World's leading Manufacturing Companies.
 

Basic SOP for Agilent 6890/5973 system

  • 1. SOP FOR GCMS L-201 x-2452 L-205 x-2356 G.C. HP 6890 (fid,tcd) M.S.5973 Chemstation Mod. G1540A G 1098A G 1701CA Ver. C.00.00 S.N. US00023315 US82311190 lic. BN26CE1DCB ● PLEASE READ THE COMPLETE SENTENCE , STEPS, BEFORE selecting INPUTS ●First the GC parameters must be satisfied, then the MS parameters and Auto Tuning MS. ● FID and MS have separate injections, therefore 2 DATA Acquisition Methods will be created. . . LOSS OF GC COLUMN FLOW could degrade the GC Column. 1.) Check column(s) flow & MS vacuum; On GC key pad select Col. 1or Col.2 display window will indicate column 1 flow, should be ~1 ml/min. On top of the MS, the Triode Gauge will indicate the MS vacuum, desired vac. 2.5 – 5 . 2.) Check utilities such as; gases for GC He, Air, Hydrogen and vacuum oil level on MS diffusion pump ( rough pump on the floor). 3.) Check AUX. 2,which is the GC/MS interface temperature; set point is 280 ° C. . 4.) Being an FID, the detector will not ignite until the detector temperature is at 150 ° C, also at this temperature both Air & Hydrogen flows will automatically be turned on to preset flow rates for detector ignition. Air flow: Hydrogen flow, usually ~10:1, 400/40 ml/min . I.) Both the GC & MS are being controlled by the computer. II.) Turn the computer on. On Desk Top , select Instrument #1 icon . The opening screen will either be TOP menu or Instrument Control Menu There are 3 main menus; TOP menu , INSTRUMENT CONTROL menu & DATA ANALYSIS ( offline). ●These 3 MAIN menus are available under VIEW on either Top menu & in INSTRUMENT CONTROL menu. ●Also when the computer is powered-up, it will load the parameters of the last method used or maybe the Default method parameters. 5.) Next is creating a Method operating parameters for the GCMS. ● From either TOP menu or INSTRUMENT CONTROL menu, select METHOD. i.) Then select Edit Entire Method .. When finished, name the method, by selecting SAVE AS ii.)The Edit Method window will appear with 3 Edit options.  Method Info  Instr/Acquire  Data Anal Select all 3, then click O.K. iii.)The next screen will be as figure 170 below with a smaller window overlapping the right bottom corner of larger window. The smaller window is info for sample injection source . Then click O.K. iiii.)Then click on the Injector (syringe) and follow the instruction on the screen. Then select the Inlets and fill-in the parameters. When finished editing parameters , SAVE AS with new name.
  • 2. NEXT THE MASS SPECTROMETER MUST BE TUNED
  • 3. GC/MS Standard Operations Procedure Before samples can be analyzed using the GC/MS, the mass spectrometer must be tuned. The MS is tuned by adjusting several parameters while the Perfluorotributylamine (PFTBA,aka FC-43) is injected into the MS chamber. Options are MANUAL tune or AUTOTUNE. ● AUTO TUNING is preferred. In INSTRUMENT CONTROL ,select Instrument, then select PERFORM MS AUTOTUNE. After tune is finished name the results and save the results. Below is the MANUAL procedure for tuning the GC/MS. However. 1) Click on the “Instrument #1” icon to start the Chemstation software. 2) From the “View” menu select “Manual Tune”. 3) When prompted “be sure changes are saved. Switch View Now?”, select “Yes” 4) In the “Manual Tune” view select the “AdjParam” menu to adjust the tune parameters. 5) From The “AdjParam” menu select “Edit MS Params” menu 6) From the ”edit MS Params” menu select “Scan” and you should see a similar PTFBA spectra a s shown in Figure 2-1. Wait 30 seconds for the PFTBA levels to stabilize before changing any tune parameters. Figure 2-1. - Tuning with the PTFBA spectra The scan from 10-700 amu should have less than 200 peaks. If there are more than 200 peaks then some sort of contamination is entering the MS chamber and further trouble shooting should be done.
  • 4. The mass spectrum of PFTBA has a base peak of 69 amu. The relative abundance of the mass peak of 219 to the base peak in the PTFBA spectra should be between 40 and 85%. The relative abundance of the mass peak of 502 to the base peak in the PTFBA spectra should be between 2.5 and 5%. In the “mass” column in Figure 2-1, if the masses of 69, 219, and 502 are off by more than 0.2amu then the mass axis should be adjusted. This is done by selecting “Mass Axis” from the calibrate menu. By doing this the mass axis is automatically adjusted by the software. The “Rel Abund” column shows the relative abundance of the 69, 219, and 502 masses. To adjust the relative abundance, the EN lens and the EntLens offset parameters should be adjusted. The Entrance lens parameters are inversely proportional to the relative abundance, which means that if you wish to increase the relative abundance you should lower the entrance lens setting and vise versa. The abundance of mass 69 should be between 200,000 and 400,000. To adjust the abundance the EM volts parameter should be adjusted. The EM volts are directly proportional to the abundance. An increase in the EM volts parameter will increase the abundance. Click on the “Prof” button to get a profile of the 69, 219, and 502 peaks. The profiles are shown in Figure 2-2. The peak with at 50% of the peak height (Pw50) should be between 0.57- 0.63 → Desired TARGETS Peak #, should be < than 200 Adjust  effect   Em volts  Base 69 , Abundance should between 200,000  400,000 Entr lens  Mass values should be  0.2 amu Mass  % (ratio to base peak ) 69 = 100 219 = 40  85 502 = 2.5  5 after targets are satisfied then select PROFILE A chromatogram of 3 Masses will be on screen amu  Peaks widths ( pw ) should be between 0.57  0.63
  • 5. PROFILE OF MASSES 69,219 & 502 Figure 2-2. Peak widths To adjust the peak widths the amu gain and the amu off set parameters should be adjusted. The relationship between the peak widths and the amu gain and the AMU off set are shown in Figure 2-3. In order to increase the peak width the amu gain and the amu off set parameters should be decreased, and vice versa to decrease the peak width.
  • 6. Figure 2-3 Relationship between peak width and AMU gain and AMU offset 7) After changing the tune parameters print the parameter settings by selecting “print” from the file menu. 8) Click on “OK” to leave the edit Parameters view. 9) Save the tune values by selecting “save tune values” from the file menu. Name the file & save . 10) Select “Top” from the view menu, to switch to the top view. When Prompted “be sure changes are saved. Switch View Now?”, select “Yes” Note, if changes have not been saved go ahead and do so now other wise the changes will be lost once the view has been switched. After the mass spectrometer has been tuned then a sequence table will be prepared to run the samples using the EXAMPLE in figure 2-4 below. A STANDARD SHOULD BE THE FIRST INJECTION. PREPARE a STANDARD, the system requires an injection, a chromatogram to activate the system’s DATA ACQUISITION software. After first Analysis Report the system will permit editing the data report. Edit items that relate to the components’ id on both the GC & MS .
  • 7. ●Next From TOP Menu select SEQUENCE, then select Edit Sample Log Table, to create a SAMPLE LOG TABLE. Fig.2-4 will be on screen Figure 2-4: Sample Log Table Select line 1, which then inputs in boxes Type, vial relate to line 1. The vial number will always be 1 The data file name is limited to eight characters The method for GC/MS analysis in fig.2-4 is AAVOC1 The sample name can be more descriptive and can be longer than eight characters. More information about the sample can be entered in the Miscellaneous Information Box. Normally such information and the sample volume and internal standard volume injected . Repeat for other lines The Expected Barcode Box is left blank. Click on “OK” to close the sample log table. Using the AS up to 8 samples can be analyzed. * For a Single run; from INSTRUMENT CONTROL select Method, then RUN **Another option is togo to INSTRUMENT CONTROL,then click on the upright sample vial. *** A third option is running a SEQUENCE. Ω Regardless of run option, figure 209 Acquisition- Sample Information will appear on screen, just after deciding on injection option . Next page was scanned, unable to edit it, jr
  • 8. EXAMPLE; Figure 2-5 will appear for running a SEQUENCE
  • 9. Fig. 2-5 Start sequence option * Select “Run” from the “Sequence” menu to run the sequence. Figure 2-5 shows the start sequence options * Select “Full Method”, select “Inject anyway on Barcode Mismatch”. Do not select “Overwrite existing data files”. * Entering a sequence comment is optional. * Enter your name under the operator name. * Enter C:msdchem1DATAMeasurements Class for the data file directory * Click on the “Run Sequence” button to run the sequence After first Analysis Report the system will permit editing of the data report , parameters that relate to the components’ id on both the GC & MS . ●Next are the following items , included are Agilent reference pages #s which are in more detail. * Creating a GC Quantitation Data Base . * Creating a MS Quantitation Data, (targent ion, qualifying ions, etc..) * Calibrations Curves (levels) * Library Search. Quantification, Peak purity ●●●●Included are Agilent’s procedures for some items, which would probably be better communicated on actual instruments , sort of hand-on . See pages 8-33 ** The items are: Pftba MSDS included
  • 10.  CREATING A QUANTITATION DATABASE Procedure is below is for the MS data.For the GC there will only be the chromatogram, no ion spectrum. Note; “ The order of compounds in the data base is VERY important. Internal standards must precede all compounds that will be quantitated relative to it. Retention times order is NOT very important.” “Any compound that will be treated as external standards must be entered before the first internal standard.” ●From the Desk Top select DATA ANALYSIS  From Data Analysis, select CALIBRATE. Under Calibrate select SET-UP QUANTITATION. ●Opening screen is named, Quantitation DatabaseGlobals 1.)Enter a name (id) for title, in measure select %, in Curve Fit select Avg,.Response Factors, then click O.K. 2.)The next screen is Edit Compound, which is empty. Click on Insert Above. 3.)The next screen will have the first injection’s chromatogram on top, and a smaller window on the bottom right corner, labeled Quant Setup. 4.)To get the retention times. On the chromatogram move the mouse curser to the apex (top) of first component,then double right click and the retention time will be appear Quant Setup window. Also the spectrum of the compound will appear below the chromatogram. Name the Compound. 5.)Next the targent ion and qualifying ions must be selected from the spectrum. “ A target ion - - is an ion characteristic of the target compound, preferably one that distinguishes this compound from any others with similar retention times. The extracted ion chromatogram for this ion will be used for the quantitation. “ “ Qualifier ions—are selected from the mass spectrum of the target compound . The presence of these ions in the correct amounts relative to the target ion gives evidence of correct target compound identification. Depending on your choice of peak selection parameters, the qualifiers may influence how the software chooses between multiple hits. “ For example isomers. Selecting the taget ion.. On the compound spectrum place the curser which now is shaped like cross-hair, over the selected target ion then click both mouse button at the same time. This will place that ion in the quant setup box and will also calculation the relative ratio. REPEAT this step for the rest of the qualifying ions. ***Then click the SAVE button 6.) Repeat all of step 4 above for the rest of the compounds. 7.) When finished click SAVE, then exit, then exit again. Next is Calibration Curves
  • 11. CREATING A CALIBRATION CURVE FOR A COMPOUND * The procedure is bit similar to the SET-UP QUANTITATION from previous page ● Load the file that was just saved above on SET-QUANTITATION ●From DATA Analysis, select Generate Report, Save & name report. ●From DATA ANALYSIS , select Calibrate, then select Update,update level one, then click O.K. i.)Move Mouse curser to desired component. The edit compound screen will appear . Select insert Above and a screen will appear to add the concentration of the standard. SAVE. ii.) Repeat this for each component, Saving each time. iii.) It will ask if there are more levels (Std % concentrations). ●To add another level ( Std concentration) Repeat steps i,ii,iii. When finished name id and save Calibrations Curves. PFTBA MSDS will be included in Desk Copy.