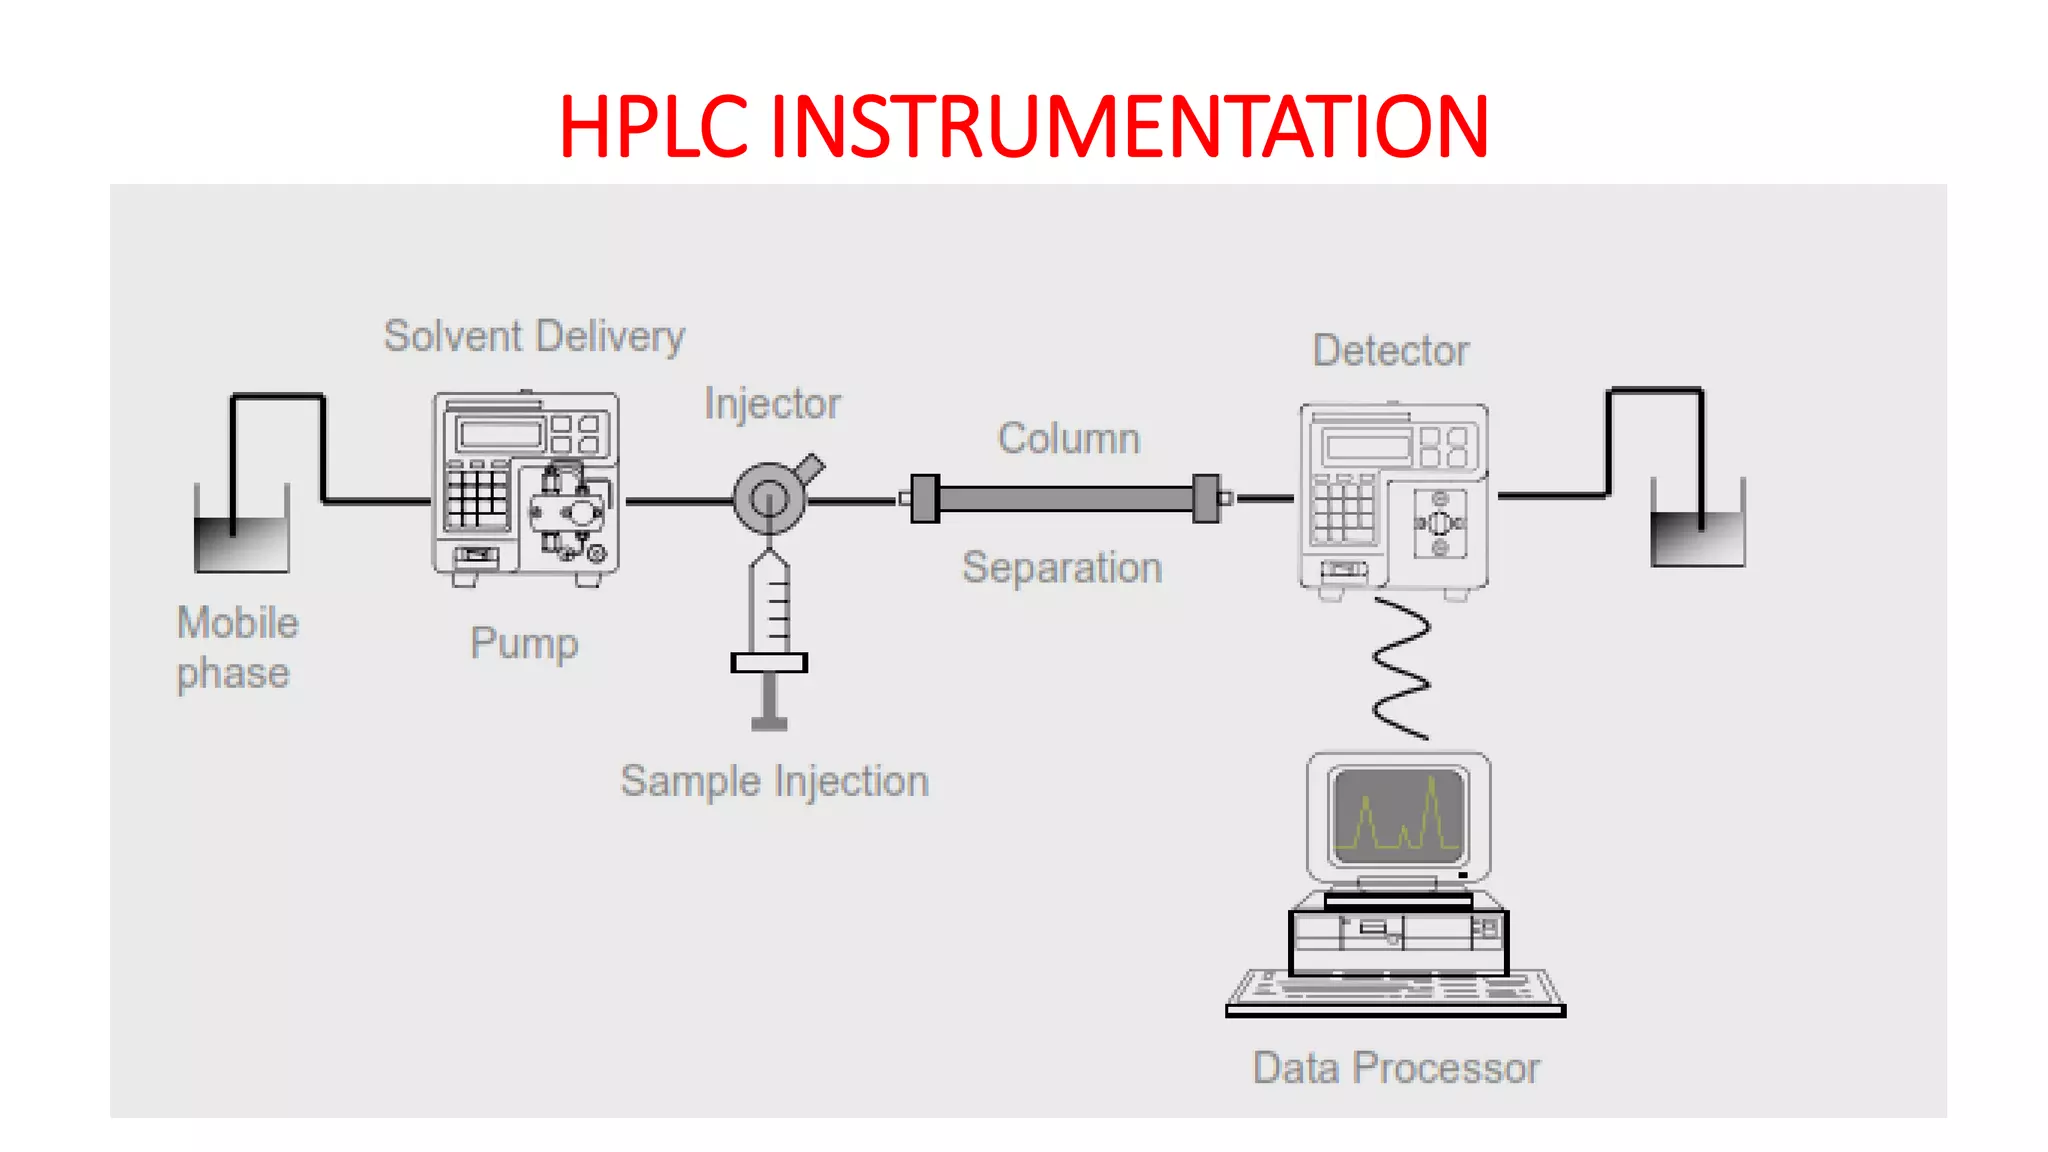
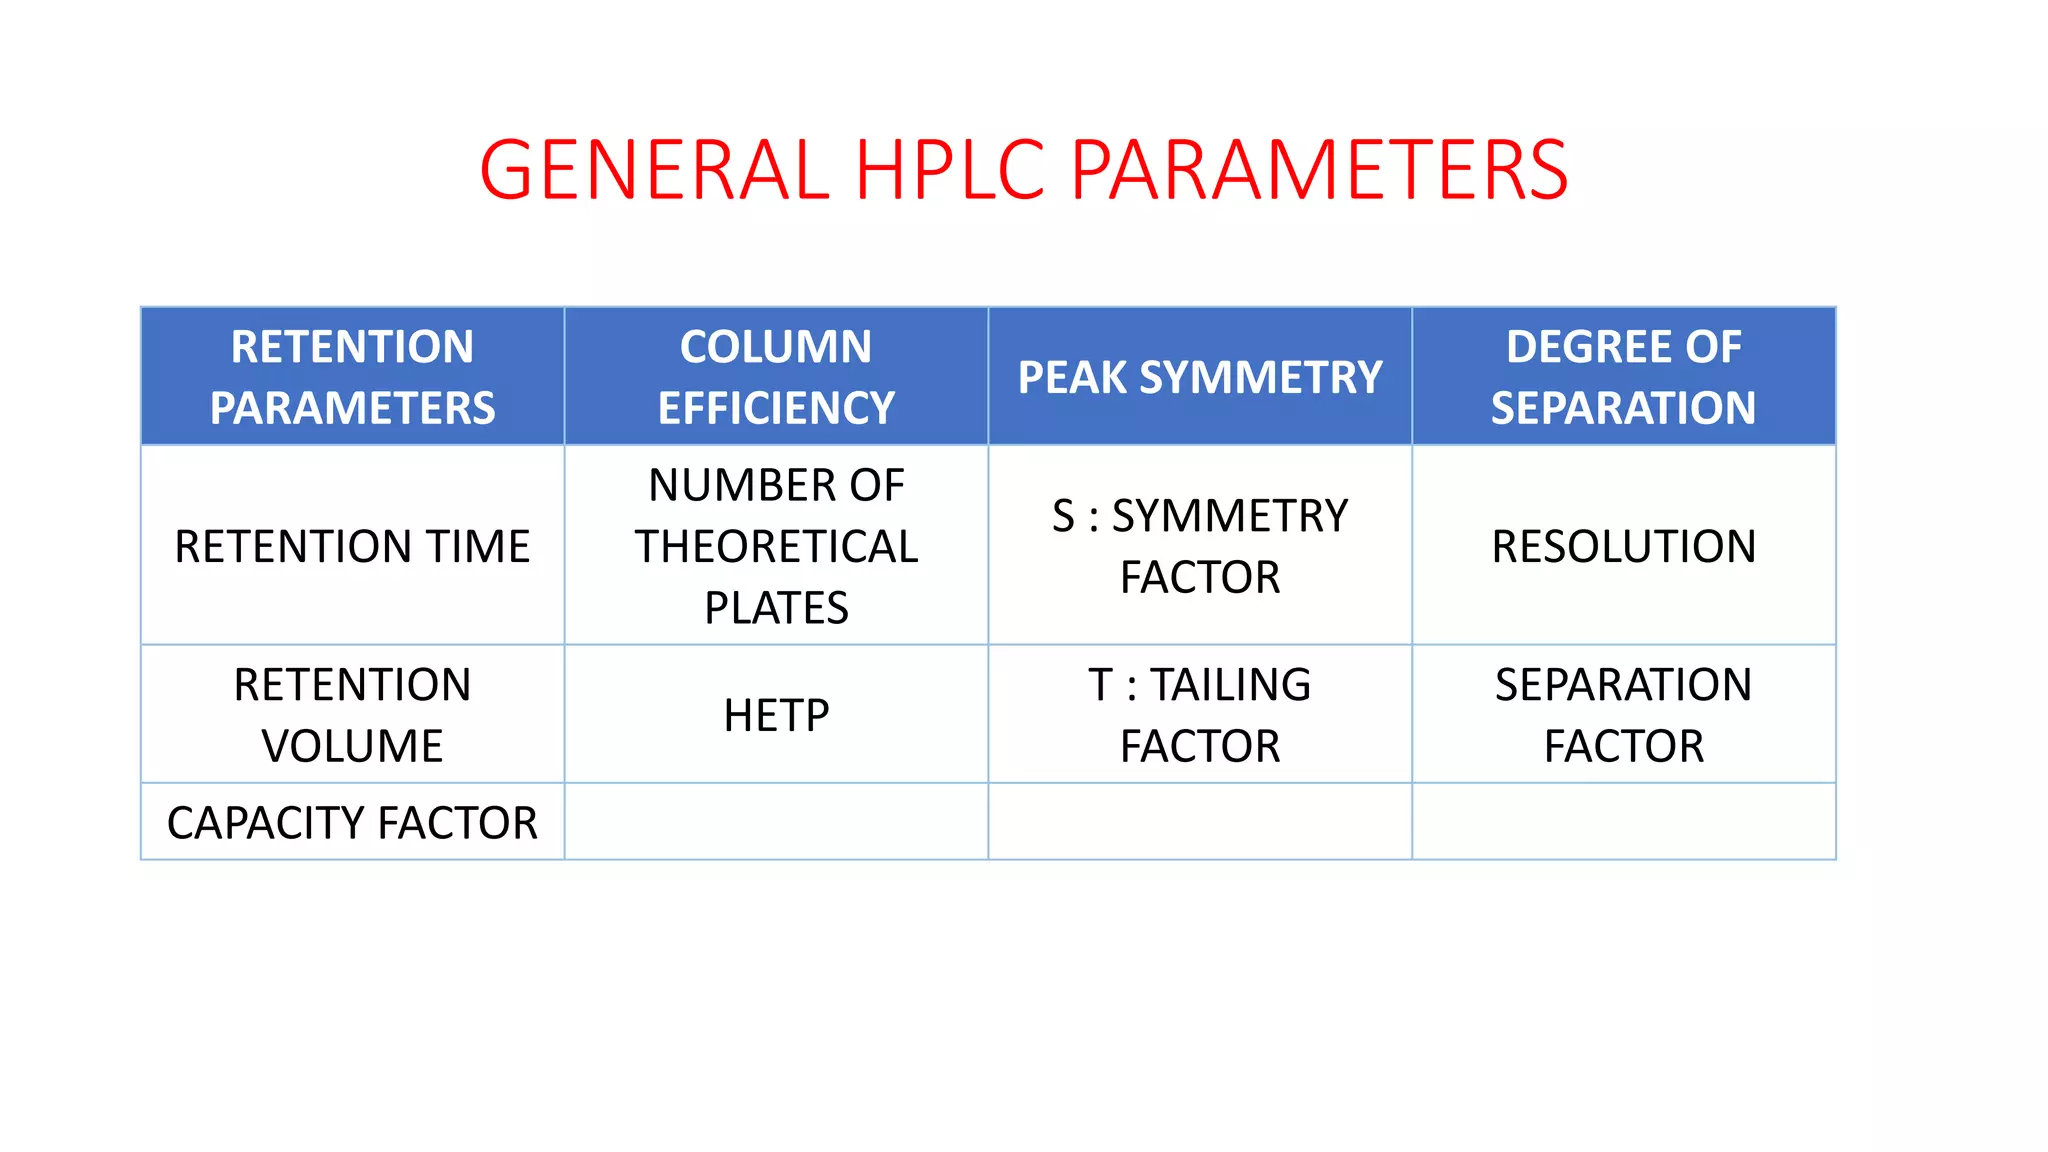
HPLC
METHOD DEVELOPMENT
BY
Dr.A.SREENIVASA CHARAN
TYPES OF HPLC NORMALLY EMPLOYED
NORMAL
PHASE
SP-POLAR
MP-RELATIVELY
LESS POLAR
REVERSE
PHASE
SP-NON POLAR
MP-RELATIVELY
MORE POLAR
HYDROPHILLIC
INTERACTION
CHROMTOGRAPHY
(HILIC)
VARIANT OF
NP-HPLC
SP-POLAR
MP-ORGANIC
PHASE + WATER
(<20%)
HYDROPHOBIC
INTERACTION
CHROMATOGRAPHY
(HIC)
A TYPE OF RP-
HPLC
USED FOR
BIOMOLECULES
HIGH PERFORMANCE (PRESSURE ?) LIQUID
CHROMATOGRAPHY
HPLC INSTRUMENTATION
GENERAL HPLC PARAMETERS
RETENTION
PARAMETERS
COLUMN
EFFICIENCY
PEAK SYMMETRY
DEGREE OF
SEPARATION
RETENTION TIME
NUMBER OF
THEORETICAL
PLATES
S : SYMMETRY
FACTOR
RESOLUTION
RETENTION
VOLUME
HETP
T : TAILING
FACTOR
SEPARATION
FACTOR
CAPACITY FACTOR
HPLC METHOD DEVELOPMENT
MORE OF AN ART THAN A TECHNIQUE
DEFINING THE METHOD
SAMPLE
CHARACTERISTICS
METHOD
IMPLICATIONS
• NATURE OF THE SAMPLE
• PHYSICO-CHEMICAL PROPERTIES
• SOLUBILITY
• pKa
• CHIRALITY
• SPECTRA-UV,IR,NMR,MS
• METABOLIC AND DEGRADATION
PATHWAYS
• METHOD DEVELOPMENT TYPE
• MAXIMUM RUN FOR ANALYSIS
• NO.OF SAMPLES IN ROUTINE
ANALYSIS
• COMPLEXITY OF THE MIXTURE
• NO.OF COMPONENTS IN THE
MIXTURE
COMMON MISTAKES
 Inadequate formulation of method goals
 Insufficient knowledge of chemistry
 Use of the first reversed phase HPLC column available
 Use of wrong instrument set-up
 Trial and error with different columns, mobile phases
METHOD DEVELOPMENT PROTOCOL
COLLECTING ANALYTE INFORMATION IN REGARD TO PHYSICO-CHEMICAL PROPERTIES
DETERMINING SUITABLE MODE OF DETECTION FOR ANALYSIS
SAMPLE PREPARATION
(EXTRACTION,CENTRIFUGATION, FILTRATION, SONICATION, TYPE OF DILUENT)
DETERMINATION OF SOLUTION STABILITY IN DILUENT
CHOICE OF MOBILE PHASE AND GRADIENT CONDITIONS (MOST CRUCIAL STEP)
STATIONARY PHASE SELECTION AND ITS STABILITY AT OPERATIONAL MODE OF MOBILE
PHASE pH
OPTIMIZAION OF SEPARATION CONDITIONS
TROUBLESHOOT THE PROBLEMS
VALIDATE THE DEVELOPED METHOD FOR ROUTINE ANALYSIS
SAMPLE PROPERTIES
• ANALYTE STRUCTURE AND
pKa
• IONOGENIC NATURE OF
ANALYTE
• IF ANALYTE IS NEUTRAL
• ELUENT pH WILL HAVE NO
EFFECT
• HOWEVER THE DEGRADATION
PRODUCTS MUST BE
CONSIDERED
• IF ANALYTE IS IONIZABLE
• pKa IS ESSENTIAL
• pKa PREDICTION &
DETERMINATION
pKa PREDICTION
• ACD LABS
• PALLAS
• CHEMICALIZE.ORG
• CHEMSPIDER.COM
• DRUGBANK
• CHEMIDPLUS
• PUBCHEM
• CHEMBLDB
EXPERIMENTAL
DETERMINATION OF pKa
• POTENTIOMETRIC
TITRATIONS
• OCTANOL-WATER
PARTITION RATIOS
• SOLUBILITY DATA
• SPECTROPHOTOMETRIC
METHODS
• NMR TITRATIONS
• CAPILLARY
ELECTROPHORESIS
• LC METHODS
• LC-CE
pKa of Some Common Functional Groups
aAddition of R(methyl, ethyl, etc.) group on aromatic ring or on NR2 will cause an increase of compound
pKa due to electron- donating effects from methyl groups.
bSubstitution in general of halogens on aromatic ring will decrease compound pKa. Example: o-
chloroaniline pKa = 2.6, aniline pKa = 4.6.
SOLUBILITY OF COMPONENTS AND DILUENT
EFFECTS (MATRIX EFFECTS)
• Solubility of the analyte is also very important
• Solubility of a particular drug is a prerequisite for any salt selection
program
• The free acid/free base and their corresponding salts will all have
different solubilities in the diluent
• The analyte-Its reactivity with diluent
• Source of impurities-synthetic or diluent-in situ
METABOLIC AND DEGRADATION PATHWAYS
In silico
• META SITE
• METABOL-
EXPERT
• METEOR
• METABOLISM
• ACD/MS
DATABASES
• MDL
METABOLITE
• DRUG BANK
• GEN BANK
MET ID-LCMS
• METABOLYNX
• MET ID
• METWORKS
• METABOLITE
PREDICT
In vitro
MODELS
• RAT
• MOUSE
• MONKEY
• LIVER
FRACTIONS
• CYP 450
ISOZYMES
DETECTOR CONSIDERATIONS
• The UV spectra of target
analyte and impurities must be
taken and overlaid with each
other.
• A wavelength must be chosen
such that adequate response is
obtained for the active and
that at least a 0.05 v/v%
solution of the active at target
concentration could be
quantified (S/N greater than
10)
UV
PDA
MASS
NMR
ELSD
FLUORESCENCE
ELECTROCHEMICAL
LIGHT SCATTERING
REFRACTIVE INDEX
FLAME IONIZATION
CORONA CHARGED AEROSOL DETECTION
• The spectral homogeneity of the peak of interest must be taken into
consideration.
• Diode array spectra at least three points across the peak should be
taken to ensure the peak is spectrally homogenous
SOLUTION STABILITY AND SAMPLE PREPARATION
• Stability of solution in the diluent is important
• Sample processing should be done carefully at desired temperatures
• Sample preparation is a critical step of method development
• Centrifugation effects (speed & time)
• Filtration effects
MOBILE PHASE CONSIDERATIONS
• Alteration of the mobile-phase pH is one of the greatest tools in the
“chromatographers toolbox” allowing simultaneous change in
retention and selectivity between critical pair of components.
• Purity of the solvents systems
• Instrument suitability
• Economic considerations
NORMAL
PHASE
SOLVENTS
HEXANE
ISOPROPYL
ALCOHOL
N,N-DMFETHYL
ACETATE
DICHLORO
METHANE
REVERSE
PHASE
SOLVENTS
WATER
THF
ETHANOLACN
METHANOL
COMMONLY USED MOBILE PHASE SOLVENTS
Solvent or Solvent Class* UV cut-off (nm)
Acetonitrile and Water <190
Alkanes (hexane,iso-octane,etc.) 190-205
Alkyl alcohols (methanol,isopropyl alcohol.etc.) 205-220
Alkyl ethers (diethyl ether, methyl t-butyl ether,etc) 210-220
Alkyl chlorides (dichloromethane,chloroform,etc.) 220-270
Freons 225-245
Alkyl acetates (ethyl and butyl acetate,etc.) 250-260
Alkyl amides (dimethylformamide,dimethyl acetamide ,etc.) 260-270
Benzene and alkyl benzenes (toluene,xylene,etc.) 270-290
Chlorobenzenes (chlorobenzene, 1,2-dichlorobenzene,etc.) 280-310
Alkyl Ketones ( acetone, methyl propyl ketone,etc.) 320-340
*All solvents unpreserved
MOBILE PHASE pH
BASED ON ANALYTE
IONIZABLE
ONE IONIZABLE
CENTER
pH = ±1 pKa OF THE
ANALYTE
MORE THAN ONE
IONOZABLE CENTER
Log P OF THE
DRUG
NEUTRAL
BASED ON
RUN TIME
FAST
ANALYSIS
IN IONIC STATE
IF MATRIX IS
COMPATIBLE
IF MATRIX IN IN-
COMPATIBLE
MOBILE PHASE
ADDITIVES(<5%)
ACIDIC
MODIFIERS
BASIC
MODIFIERS
ION-PAIR REAGENTS
pH-ADJUSTMENT
CONVERTED TO
NEUTRAL FORM
SLOW
ANALYSIS
IN NEUTRAL STATE
STRENGTHS WEAKNESSES
OPPORTUNITIES THREATS
pH = pKa – 2
the acid is 1 % dissociated
(mostly neutral)
pH = pKa
the acid is 50 % dissociated
(equal amounts of ionized and
neutral)
pH = pKa + 2
the acid is 99 % dissociated
(mostly ionized)
pH = pKa – 2
the base is 99 %
dissociated
(mostly ionized)
pH = pKa
the base is 50 % dissociated
(equal amounts of ionized
and neutral)
pH = pKa + 2
the base is 1 % dissociated
(mostly neutral)
CHOICE OF BUFFERS
• In order to develop rugged HPLC methods, knowledge of choosing the
right buffer is very important.
• Buffers that are selected should have a good buffering capacity at the
specified mobile-phase pH.
• The concentration of the buffer should be at least 10mM.
• Optimum buffering capacity occurs at a pH =pKa of the buffer.
• In general, most buffers provide adequate buffering capacity for
controlling mobile-phase pH only within ±1 unit of their respective
pKa.
• Also, buffers are great media for growing bacteria. It is recommended
to have at least 10 v/v% of organic in the aqueous phase to prevent
bacterial growth.
GENERAL CONSIDERATIONS FOR BUFFER
• The type of buffer that is chosen will depend on the wavelength of the method
and the concentration of organic in the mobile phase.
• A judicious choice of type and concentration of buffer must be made to ensure
mobile-phase compatibility.
• Purity of buffer should be taken into consideration.
• Phosphate is more soluble in methanol/water than in acetonitrile/water or
THF/water.
• Some salt buffers are hygroscopic. It leads to improper final concentrations.
• Ammonium salts are generally more soluble in organic/water mobile phases
than potassium salts, and potassium salts are more soluble than sodium salts.
• TFA can degrade with time, is volatile, absorbs at low UV wavelengths, and is not
a buffer at pH > 1.5.
• Citrate buffers can attack stainless steel.
• At pH greater than 7, phosphate buffers accelerates the dissolution of silica
and severely shortens the lifetime of silica-based HPLC columns. If possible,
organic buffers should not be used at pH greater than 7.
• Ammonium bicarbonate buffers usually are prone to pH changes and are usually
stable for only 24 to 48 hours.
• After buffers are prepared, they should be filtered through a 0.2-µm filter.
• Mobile phases should be degassed if an on-line degasser is not available on
the HPLC system.
pH Range pKa Reagent
0–2 Hydrochloric acid; nitric acid; perchloric acid
0.3–5.3 1.3, 4.4 Oxalic acid, dihydrate; sodium oxalate; potassium tetroxalate, dihydrate
0.9–2.9, 5.2–7.2 1.9, 6.2 Maleic acid
1.1–1.8 Potassium chloride
1.1–3.1, 6.2–10.1 2.1, 7.2, 12.4 Phosphoric acid; potassium phosphate, monobasic; potassium phosphate, dibasic; potassium phosphate,
tribasic, n-hydrate; sodium phosphate, monobasic, monohydrate; sodium phosphate, dibasic, 7-hydrate;
sodium phosphate, tribasic, 12-hydrate
1.8–3.8 2.8 Monochloroacetic acid; chloroacetic acid, sodium salt
1.9–6.4 2.9, 5.4 Phthalic acid; potassium biphthalate
2.0–5.4 3.0, 4.4 d-Tartaric acid; potassium tartrate, ½-hydrate
2.1–7.4 3.1, 4.8, 6.4 Citric acid, anhydrous; citric acid, monohydrate; potassium citrate, monohydrate
2.8–4.8 3.8 Formic acid; sodium formate
3.2–6.6 4.2, 5.6 Succinic acid
3.6–5.6 4.6 Acetic acid; sodium acetate, trihydrate
4.1–6.1 5.1 Hexamethylenetetramine
5.3–7.3,9.3–11.3 6.3, 10.3 Carbonic acid; potassium bicarbonate; potassium carbonate, anhydrous; sodium bicarbonate; sodium
carbonate, anhydrous; sodium carbonate, monohydrate
6.5–8.5 7.5 Imidazole
6.8 4.6 (acetic acid);
9.3 (ammonium hydroxide)
Ammonium acetate
6.8–8.8 7.8 Triethanolamine; TRIS hydrochloride
7.1–9.1 8.1 N,N-bis(2-hydroxyethyl)glycine (bicine); 4-(2-hydroxyethyl)-1- piperazineethanesulfonic acid (HEPES)
7.8–9.8 8.8 2-Amino-2-methyl-1,2-propanediol (AMP)
8.2–10.2 9.2 Boric acid; sodium borate, 10-hydrate
8.3–10.3 9.3 Ammonium hydroxide; ammonium chloride
12–14 Potassium hydroxide, 45% solution; sodium hydroxide, 50%
12.4 Calcium hydroxide
CONCENTRATION OF BUFFERS
• A buffer concentration in the range of 10 to 50 mM is adequate for most
reversed-phase applications.
• However, sometimes the concentration of the buffer does lead to improvement
of peak shape.
• The concentration should also be low enough to avoid problems with
precipitation when significant amounts of organic modifiers are used in the
mobile phase.
• It is seldom advisable to use a buffer concentration more than 100 mM and less
than 10 mM.
• It is mainly ionic strength and not a buffer capacity that is governing the peak
distortion in less than 10 mM concentration range—at these conditions the
solvation equilibrium is slow, causing peak distortion.
PRACTICAL ASPECTS OF PREPARING A
BUFFERED MOBILE PHASE
• Define the appropriate pH for the separation and then select an
appropriate buffer.
• Prepare an aqueous buffer solution of the desired concentration and
pH.
• Measure the pH of the solution and adjust, if necessary, to the
desired pH with dilute acid or dilute basic solution.
• If you are performing an isocratic separation, combine the aqueous
buffer solution with the appropriate organic modifier (e.g., methanol
or acetonitrile) to produce the desired mobile phase and let the
solution come to equilibrium.
CHOICE OF ORGANIC MODIFIER
• Selection of the organic modifier type could be viewed as relatively simple
• The usual choice is between acetonitrile and methanol (rarely THF)
• In short, methanol shows more predictable influence on the analyte elution
• The viscosity of water/organic mixtures should be considered as an
additional parameter in the selection of organic modifier.
• The stability of the mobile phase should also be considered. THF is known to
form peroxides.
APPARENT pH
SEPARATION MODES
• Isocratic Versus Gradient Separations
• Traditionally, isocratic separations are deemed as more reproducible
than gradient separations.
ISOCRATIC
CONSTATNT EQUILIBRIUM
CONDITIONS
PREDICTABLE SEPARATIONS
LESS NUMBER OF SAMPLES
LOW PEAK CAPACITY, BROAD
PEAKS
GRADIENT
HIGH SEPARATION POWER
LESS PEAK WIDTH
TAILING DEPENDS ON THE
STRONGER ELUENT
FAST RATES OF SEPARATION
CHOICE OF STATIONARY PHASE
Knowledge of the Sample
• Structure of sample components?
• Number of compounds present?
• Sample matrix?
• pKa values of sample components?
• Concentration range?
• Molecular weight range?
• Solubility?
• Other pertinent data?
Column Chemistry
(bonded phase, bonding type,
end capping, carbon load)
Goals for the Separation
• Max. resolution of all components?
• Partial resolution?
• Fast analysis?
• Economy (low solvent usage)?
• Column stability and lifetime?
• Preparative method?
• High sensitivity?
• Other goals?
Column Physics
(particle bed dimensions,
particle shape, particle
size, surface area, pore
size)
RIGHT STATIONARY PHASE
ANALYTE
STRUCTURES
HYDROPHOBIC
HYDROPHILLIC
FUNCTIONAL
GROUPS
LOG P CHART
SELECTION OF
BONDED
PHASE-SILICA,
C-8,C-18, CSP,
GEL SP, ION SP
IF SAMPLE IS
HYDROPHOBIC
& +VE LOG P
VALUE- RP C-
18
FOR
BIOANALYSIS-
MONOLITHIC
COLUMN IS
BEST CHOICE
COLUMN SELECTION GUIDE
ANALYTESTRUCTURE
LOG P
STATIONARYPHASE
HYDROPHOBIC-
+VE LOG P-RP
COLUMN-C8 OR
C18
POLAR
ANALYTES-NP
COLUMN
CHIRAL-SUITABLE
CHIRAL COLUMN
SORBENTSPECIFICATIONS
MATRIX
TOLERABILITY
MS SUITABILITY
PARTICLE SIZE
pH-STABILTY
COLUMDIMENSION
LENGTH X i.d
GUARD
PREPARATIVE
SEMI-
PREPARATIVE
PRE-COLUMN
METHOD
DEVELOPMENT
USPCLASSIFICATION
L1-L60
CHOOSING RIGHT COLUMN FORMAT
PARTICLE SIZE
• SMALL-HIGH
SEPARATION
EFFICIENCY & HIGH
RESOLUTION
• LARGE-OFFER FAST
FLOW RATES,LESS
PRONE TO
CLOGGING
• 5μm IS BEST OPTION
PORE SIZE
• PORE-LARGE
ENOUGH TO
COMPLETELY
ENCLOSE TARGET
• SMALL-HIGH
SURFACE
AREA,HIGHER
CAPACITY
• LARGE-SMALL
SURFACE
AREA,FASTER
EQUILIBRATION,GRA
DIENT MODE,
PORTEINS
CARBON LOAD
• AMOUNT OF
FUNCTIONAL
BONDED PHASE
ATTACHED TO THE
BASE MATERIAL
• LOW-WEAKLY
HYDROPHOBIC,LOW
RT
• HIGH-GREATER
RESOLUTION,HIGHER
CAPACITIES,HYDROP
HOBIC COMP.
END CAPPING
• END CAPPING THE
BONDED PHASES
MINIMIZES
SECONDARY
INTERACTION WITH
FREE SILANOL
GROUPS
• USE IF
INTERACTIONS WITH
POLAR COMPOUNDS
IS NOT REQUIRED
• NON-END CAPPING-
POLAR
SELECTIVITY,STRONG
RETENTION OF
POLAR COMP.
Feature Utility
5-µm totally porous particles Most separations
3-µm totally porous particles Fast separations
1.5-µm pellicular particles
Very fast separations (especially
macromolecules)
± 50% (from mean) particle size
distribution
Stable,reproducible,more efficient with
low column pressure drop
7-12nm pores, 150-400 m2/g (narrow
pore)
Small molecular separations
15-100nm pores, 10-50 m2/g (wide
pore)
Macromolecular separations
COLUMN SELECTION GUIDES:
• Chromatographic Columns Online Database-USP NF
• WATERS
• AGILENT
• PHENOMENEX
• THERMOSCIENTIFIC
EQUILIBRATION & OTHER FACTORS
• Equilibration with mobile phase is very important in gradient elution
• The time needed to equilibrate the column is determined by flow rate
• Lower the flow rate, longer the equilibration time
• Flow rate has to be selected based on separation of impurities, column back pressures
and retention times.
• Generally flow rate shall not be more than 3.0ml/min. High flow rate reduces analysis
time
• Select the flow rate which gives least RT & back pressure, good peak symmetry &
separation of impurities.
• In most cases ambient temperature is used to optimize the chromatographic conditions.
• If peak is asymmetric with different mobile phase and column combinations then
temperatures above ambient can be used.
• Increase in temperature decreases analysis time
• Increasing flow rate, increasing temperature (up to column stability limit at a particular
pH), increasing the concentration of the organic eluent, and using shorter columns with
narrower dimensions may be used to obtain more desirable run times.
METHOD OPTIMIZATION
OPTIMIZATION
CONSIDERATIONS
• MOBILE PHASE pH
• ORGANIC SOLVENT COMPOSITION
• FLOW RATE
• GRADIENT ELUTION
• TYPE OF COLUMN
• COLUMN TEMPEARTURE
DATA SYSTEMS
• DRYLAB
• AMDS-WATERS
• CHROMSWORD
• AUTOCHROM
HPLC TROUBLE SHOOTING
HIGH PRESSURE
NO PRESSURE / LOW
PRESSURE
NO FLOW
NO PEAKS/VERY
SMALL PEAKS
PEAK TAILING ON
INITIAL & LATER
INJECTIONS
SPLIT PEAKS
LOSS OF
RESOLUTION
VARIABLE RT
BASE LINE DRIFTROUNDED PEAKS
FRONTING
PEAKS
TAILING PEAKS
GHOST PEAKSNEGATIVE PEAKS
CHANGE IN
SELECTIVITY
CHANGE IN PEAK
HEIGHT
METHOD VALIDATION
1 • ACCURACY
2 • PRECISION
3 • SPECIFICITY
4 • LIMIT OF DETECTION
5 • LIMIT OF QUANTITATION
6 • ROBUSTNESS
7 • ANALYTICAL SOLUTION STABILITY
8 • STABILITY STUDIES
SAMPLE PREPARATION IN HPLC
HPLC method development by DrA.S Charan

HPLC method development by DrA.S Charan

  • 1.
  • 2.
    TYPES OF HPLCNORMALLY EMPLOYED NORMAL PHASE SP-POLAR MP-RELATIVELY LESS POLAR REVERSE PHASE SP-NON POLAR MP-RELATIVELY MORE POLAR HYDROPHILLIC INTERACTION CHROMTOGRAPHY (HILIC) VARIANT OF NP-HPLC SP-POLAR MP-ORGANIC PHASE + WATER (<20%) HYDROPHOBIC INTERACTION CHROMATOGRAPHY (HIC) A TYPE OF RP- HPLC USED FOR BIOMOLECULES
  • 3.
    HIGH PERFORMANCE (PRESSURE?) LIQUID CHROMATOGRAPHY
  • 4.
  • 5.
    GENERAL HPLC PARAMETERS RETENTION PARAMETERS COLUMN EFFICIENCY PEAKSYMMETRY DEGREE OF SEPARATION RETENTION TIME NUMBER OF THEORETICAL PLATES S : SYMMETRY FACTOR RESOLUTION RETENTION VOLUME HETP T : TAILING FACTOR SEPARATION FACTOR CAPACITY FACTOR
  • 6.
    HPLC METHOD DEVELOPMENT MOREOF AN ART THAN A TECHNIQUE
  • 7.
    DEFINING THE METHOD SAMPLE CHARACTERISTICS METHOD IMPLICATIONS •NATURE OF THE SAMPLE • PHYSICO-CHEMICAL PROPERTIES • SOLUBILITY • pKa • CHIRALITY • SPECTRA-UV,IR,NMR,MS • METABOLIC AND DEGRADATION PATHWAYS • METHOD DEVELOPMENT TYPE • MAXIMUM RUN FOR ANALYSIS • NO.OF SAMPLES IN ROUTINE ANALYSIS • COMPLEXITY OF THE MIXTURE • NO.OF COMPONENTS IN THE MIXTURE
  • 9.
    COMMON MISTAKES  Inadequateformulation of method goals  Insufficient knowledge of chemistry  Use of the first reversed phase HPLC column available  Use of wrong instrument set-up  Trial and error with different columns, mobile phases
  • 10.
    METHOD DEVELOPMENT PROTOCOL COLLECTINGANALYTE INFORMATION IN REGARD TO PHYSICO-CHEMICAL PROPERTIES DETERMINING SUITABLE MODE OF DETECTION FOR ANALYSIS SAMPLE PREPARATION (EXTRACTION,CENTRIFUGATION, FILTRATION, SONICATION, TYPE OF DILUENT) DETERMINATION OF SOLUTION STABILITY IN DILUENT CHOICE OF MOBILE PHASE AND GRADIENT CONDITIONS (MOST CRUCIAL STEP) STATIONARY PHASE SELECTION AND ITS STABILITY AT OPERATIONAL MODE OF MOBILE PHASE pH OPTIMIZAION OF SEPARATION CONDITIONS TROUBLESHOOT THE PROBLEMS VALIDATE THE DEVELOPED METHOD FOR ROUTINE ANALYSIS
  • 11.
    SAMPLE PROPERTIES • ANALYTESTRUCTURE AND pKa • IONOGENIC NATURE OF ANALYTE • IF ANALYTE IS NEUTRAL • ELUENT pH WILL HAVE NO EFFECT • HOWEVER THE DEGRADATION PRODUCTS MUST BE CONSIDERED • IF ANALYTE IS IONIZABLE • pKa IS ESSENTIAL • pKa PREDICTION & DETERMINATION pKa PREDICTION • ACD LABS • PALLAS • CHEMICALIZE.ORG • CHEMSPIDER.COM • DRUGBANK • CHEMIDPLUS • PUBCHEM • CHEMBLDB EXPERIMENTAL DETERMINATION OF pKa • POTENTIOMETRIC TITRATIONS • OCTANOL-WATER PARTITION RATIOS • SOLUBILITY DATA • SPECTROPHOTOMETRIC METHODS • NMR TITRATIONS • CAPILLARY ELECTROPHORESIS • LC METHODS • LC-CE
  • 12.
    pKa of SomeCommon Functional Groups aAddition of R(methyl, ethyl, etc.) group on aromatic ring or on NR2 will cause an increase of compound pKa due to electron- donating effects from methyl groups. bSubstitution in general of halogens on aromatic ring will decrease compound pKa. Example: o- chloroaniline pKa = 2.6, aniline pKa = 4.6.
  • 13.
    SOLUBILITY OF COMPONENTSAND DILUENT EFFECTS (MATRIX EFFECTS) • Solubility of the analyte is also very important • Solubility of a particular drug is a prerequisite for any salt selection program • The free acid/free base and their corresponding salts will all have different solubilities in the diluent • The analyte-Its reactivity with diluent • Source of impurities-synthetic or diluent-in situ
  • 14.
    METABOLIC AND DEGRADATIONPATHWAYS In silico • META SITE • METABOL- EXPERT • METEOR • METABOLISM • ACD/MS DATABASES • MDL METABOLITE • DRUG BANK • GEN BANK MET ID-LCMS • METABOLYNX • MET ID • METWORKS • METABOLITE PREDICT In vitro MODELS • RAT • MOUSE • MONKEY • LIVER FRACTIONS • CYP 450 ISOZYMES
  • 15.
    DETECTOR CONSIDERATIONS • TheUV spectra of target analyte and impurities must be taken and overlaid with each other. • A wavelength must be chosen such that adequate response is obtained for the active and that at least a 0.05 v/v% solution of the active at target concentration could be quantified (S/N greater than 10) UV PDA MASS NMR ELSD FLUORESCENCE ELECTROCHEMICAL LIGHT SCATTERING REFRACTIVE INDEX FLAME IONIZATION CORONA CHARGED AEROSOL DETECTION
  • 17.
    • The spectralhomogeneity of the peak of interest must be taken into consideration. • Diode array spectra at least three points across the peak should be taken to ensure the peak is spectrally homogenous
  • 18.
    SOLUTION STABILITY ANDSAMPLE PREPARATION • Stability of solution in the diluent is important • Sample processing should be done carefully at desired temperatures • Sample preparation is a critical step of method development • Centrifugation effects (speed & time) • Filtration effects
  • 19.
    MOBILE PHASE CONSIDERATIONS •Alteration of the mobile-phase pH is one of the greatest tools in the “chromatographers toolbox” allowing simultaneous change in retention and selectivity between critical pair of components. • Purity of the solvents systems • Instrument suitability • Economic considerations
  • 20.
  • 22.
    Solvent or SolventClass* UV cut-off (nm) Acetonitrile and Water <190 Alkanes (hexane,iso-octane,etc.) 190-205 Alkyl alcohols (methanol,isopropyl alcohol.etc.) 205-220 Alkyl ethers (diethyl ether, methyl t-butyl ether,etc) 210-220 Alkyl chlorides (dichloromethane,chloroform,etc.) 220-270 Freons 225-245 Alkyl acetates (ethyl and butyl acetate,etc.) 250-260 Alkyl amides (dimethylformamide,dimethyl acetamide ,etc.) 260-270 Benzene and alkyl benzenes (toluene,xylene,etc.) 270-290 Chlorobenzenes (chlorobenzene, 1,2-dichlorobenzene,etc.) 280-310 Alkyl Ketones ( acetone, methyl propyl ketone,etc.) 320-340 *All solvents unpreserved
  • 24.
    MOBILE PHASE pH BASEDON ANALYTE IONIZABLE ONE IONIZABLE CENTER pH = ±1 pKa OF THE ANALYTE MORE THAN ONE IONOZABLE CENTER Log P OF THE DRUG NEUTRAL BASED ON RUN TIME FAST ANALYSIS IN IONIC STATE IF MATRIX IS COMPATIBLE IF MATRIX IN IN- COMPATIBLE MOBILE PHASE ADDITIVES(<5%) ACIDIC MODIFIERS BASIC MODIFIERS ION-PAIR REAGENTS pH-ADJUSTMENT CONVERTED TO NEUTRAL FORM SLOW ANALYSIS IN NEUTRAL STATE
  • 26.
    STRENGTHS WEAKNESSES OPPORTUNITIES THREATS pH= pKa – 2 the acid is 1 % dissociated (mostly neutral) pH = pKa the acid is 50 % dissociated (equal amounts of ionized and neutral) pH = pKa + 2 the acid is 99 % dissociated (mostly ionized) pH = pKa – 2 the base is 99 % dissociated (mostly ionized) pH = pKa the base is 50 % dissociated (equal amounts of ionized and neutral) pH = pKa + 2 the base is 1 % dissociated (mostly neutral)
  • 27.
    CHOICE OF BUFFERS •In order to develop rugged HPLC methods, knowledge of choosing the right buffer is very important. • Buffers that are selected should have a good buffering capacity at the specified mobile-phase pH. • The concentration of the buffer should be at least 10mM. • Optimum buffering capacity occurs at a pH =pKa of the buffer. • In general, most buffers provide adequate buffering capacity for controlling mobile-phase pH only within ±1 unit of their respective pKa. • Also, buffers are great media for growing bacteria. It is recommended to have at least 10 v/v% of organic in the aqueous phase to prevent bacterial growth.
  • 28.
    GENERAL CONSIDERATIONS FORBUFFER • The type of buffer that is chosen will depend on the wavelength of the method and the concentration of organic in the mobile phase. • A judicious choice of type and concentration of buffer must be made to ensure mobile-phase compatibility. • Purity of buffer should be taken into consideration. • Phosphate is more soluble in methanol/water than in acetonitrile/water or THF/water. • Some salt buffers are hygroscopic. It leads to improper final concentrations. • Ammonium salts are generally more soluble in organic/water mobile phases than potassium salts, and potassium salts are more soluble than sodium salts.
  • 29.
    • TFA candegrade with time, is volatile, absorbs at low UV wavelengths, and is not a buffer at pH > 1.5. • Citrate buffers can attack stainless steel. • At pH greater than 7, phosphate buffers accelerates the dissolution of silica and severely shortens the lifetime of silica-based HPLC columns. If possible, organic buffers should not be used at pH greater than 7. • Ammonium bicarbonate buffers usually are prone to pH changes and are usually stable for only 24 to 48 hours. • After buffers are prepared, they should be filtered through a 0.2-µm filter. • Mobile phases should be degassed if an on-line degasser is not available on the HPLC system.
  • 30.
    pH Range pKaReagent 0–2 Hydrochloric acid; nitric acid; perchloric acid 0.3–5.3 1.3, 4.4 Oxalic acid, dihydrate; sodium oxalate; potassium tetroxalate, dihydrate 0.9–2.9, 5.2–7.2 1.9, 6.2 Maleic acid 1.1–1.8 Potassium chloride 1.1–3.1, 6.2–10.1 2.1, 7.2, 12.4 Phosphoric acid; potassium phosphate, monobasic; potassium phosphate, dibasic; potassium phosphate, tribasic, n-hydrate; sodium phosphate, monobasic, monohydrate; sodium phosphate, dibasic, 7-hydrate; sodium phosphate, tribasic, 12-hydrate 1.8–3.8 2.8 Monochloroacetic acid; chloroacetic acid, sodium salt 1.9–6.4 2.9, 5.4 Phthalic acid; potassium biphthalate 2.0–5.4 3.0, 4.4 d-Tartaric acid; potassium tartrate, ½-hydrate 2.1–7.4 3.1, 4.8, 6.4 Citric acid, anhydrous; citric acid, monohydrate; potassium citrate, monohydrate 2.8–4.8 3.8 Formic acid; sodium formate 3.2–6.6 4.2, 5.6 Succinic acid 3.6–5.6 4.6 Acetic acid; sodium acetate, trihydrate 4.1–6.1 5.1 Hexamethylenetetramine 5.3–7.3,9.3–11.3 6.3, 10.3 Carbonic acid; potassium bicarbonate; potassium carbonate, anhydrous; sodium bicarbonate; sodium carbonate, anhydrous; sodium carbonate, monohydrate 6.5–8.5 7.5 Imidazole 6.8 4.6 (acetic acid); 9.3 (ammonium hydroxide) Ammonium acetate 6.8–8.8 7.8 Triethanolamine; TRIS hydrochloride 7.1–9.1 8.1 N,N-bis(2-hydroxyethyl)glycine (bicine); 4-(2-hydroxyethyl)-1- piperazineethanesulfonic acid (HEPES) 7.8–9.8 8.8 2-Amino-2-methyl-1,2-propanediol (AMP) 8.2–10.2 9.2 Boric acid; sodium borate, 10-hydrate 8.3–10.3 9.3 Ammonium hydroxide; ammonium chloride 12–14 Potassium hydroxide, 45% solution; sodium hydroxide, 50% 12.4 Calcium hydroxide
  • 31.
    CONCENTRATION OF BUFFERS •A buffer concentration in the range of 10 to 50 mM is adequate for most reversed-phase applications. • However, sometimes the concentration of the buffer does lead to improvement of peak shape. • The concentration should also be low enough to avoid problems with precipitation when significant amounts of organic modifiers are used in the mobile phase. • It is seldom advisable to use a buffer concentration more than 100 mM and less than 10 mM. • It is mainly ionic strength and not a buffer capacity that is governing the peak distortion in less than 10 mM concentration range—at these conditions the solvation equilibrium is slow, causing peak distortion.
  • 32.
    PRACTICAL ASPECTS OFPREPARING A BUFFERED MOBILE PHASE • Define the appropriate pH for the separation and then select an appropriate buffer. • Prepare an aqueous buffer solution of the desired concentration and pH. • Measure the pH of the solution and adjust, if necessary, to the desired pH with dilute acid or dilute basic solution. • If you are performing an isocratic separation, combine the aqueous buffer solution with the appropriate organic modifier (e.g., methanol or acetonitrile) to produce the desired mobile phase and let the solution come to equilibrium.
  • 33.
    CHOICE OF ORGANICMODIFIER • Selection of the organic modifier type could be viewed as relatively simple • The usual choice is between acetonitrile and methanol (rarely THF) • In short, methanol shows more predictable influence on the analyte elution • The viscosity of water/organic mixtures should be considered as an additional parameter in the selection of organic modifier. • The stability of the mobile phase should also be considered. THF is known to form peroxides.
  • 34.
  • 35.
    SEPARATION MODES • IsocraticVersus Gradient Separations • Traditionally, isocratic separations are deemed as more reproducible than gradient separations. ISOCRATIC CONSTATNT EQUILIBRIUM CONDITIONS PREDICTABLE SEPARATIONS LESS NUMBER OF SAMPLES LOW PEAK CAPACITY, BROAD PEAKS GRADIENT HIGH SEPARATION POWER LESS PEAK WIDTH TAILING DEPENDS ON THE STRONGER ELUENT FAST RATES OF SEPARATION
  • 36.
    CHOICE OF STATIONARYPHASE Knowledge of the Sample • Structure of sample components? • Number of compounds present? • Sample matrix? • pKa values of sample components? • Concentration range? • Molecular weight range? • Solubility? • Other pertinent data? Column Chemistry (bonded phase, bonding type, end capping, carbon load)
  • 37.
    Goals for theSeparation • Max. resolution of all components? • Partial resolution? • Fast analysis? • Economy (low solvent usage)? • Column stability and lifetime? • Preparative method? • High sensitivity? • Other goals? Column Physics (particle bed dimensions, particle shape, particle size, surface area, pore size)
  • 39.
    RIGHT STATIONARY PHASE ANALYTE STRUCTURES HYDROPHOBIC HYDROPHILLIC FUNCTIONAL GROUPS LOGP CHART SELECTION OF BONDED PHASE-SILICA, C-8,C-18, CSP, GEL SP, ION SP IF SAMPLE IS HYDROPHOBIC & +VE LOG P VALUE- RP C- 18 FOR BIOANALYSIS- MONOLITHIC COLUMN IS BEST CHOICE
  • 40.
    COLUMN SELECTION GUIDE ANALYTESTRUCTURE LOGP STATIONARYPHASE HYDROPHOBIC- +VE LOG P-RP COLUMN-C8 OR C18 POLAR ANALYTES-NP COLUMN CHIRAL-SUITABLE CHIRAL COLUMN SORBENTSPECIFICATIONS MATRIX TOLERABILITY MS SUITABILITY PARTICLE SIZE pH-STABILTY COLUMDIMENSION LENGTH X i.d GUARD PREPARATIVE SEMI- PREPARATIVE PRE-COLUMN METHOD DEVELOPMENT USPCLASSIFICATION L1-L60
  • 42.
    CHOOSING RIGHT COLUMNFORMAT PARTICLE SIZE • SMALL-HIGH SEPARATION EFFICIENCY & HIGH RESOLUTION • LARGE-OFFER FAST FLOW RATES,LESS PRONE TO CLOGGING • 5μm IS BEST OPTION PORE SIZE • PORE-LARGE ENOUGH TO COMPLETELY ENCLOSE TARGET • SMALL-HIGH SURFACE AREA,HIGHER CAPACITY • LARGE-SMALL SURFACE AREA,FASTER EQUILIBRATION,GRA DIENT MODE, PORTEINS CARBON LOAD • AMOUNT OF FUNCTIONAL BONDED PHASE ATTACHED TO THE BASE MATERIAL • LOW-WEAKLY HYDROPHOBIC,LOW RT • HIGH-GREATER RESOLUTION,HIGHER CAPACITIES,HYDROP HOBIC COMP. END CAPPING • END CAPPING THE BONDED PHASES MINIMIZES SECONDARY INTERACTION WITH FREE SILANOL GROUPS • USE IF INTERACTIONS WITH POLAR COMPOUNDS IS NOT REQUIRED • NON-END CAPPING- POLAR SELECTIVITY,STRONG RETENTION OF POLAR COMP.
  • 43.
    Feature Utility 5-µm totallyporous particles Most separations 3-µm totally porous particles Fast separations 1.5-µm pellicular particles Very fast separations (especially macromolecules) ± 50% (from mean) particle size distribution Stable,reproducible,more efficient with low column pressure drop 7-12nm pores, 150-400 m2/g (narrow pore) Small molecular separations 15-100nm pores, 10-50 m2/g (wide pore) Macromolecular separations COLUMN SELECTION GUIDES: • Chromatographic Columns Online Database-USP NF • WATERS • AGILENT • PHENOMENEX • THERMOSCIENTIFIC
  • 44.
    EQUILIBRATION & OTHERFACTORS • Equilibration with mobile phase is very important in gradient elution • The time needed to equilibrate the column is determined by flow rate • Lower the flow rate, longer the equilibration time • Flow rate has to be selected based on separation of impurities, column back pressures and retention times. • Generally flow rate shall not be more than 3.0ml/min. High flow rate reduces analysis time • Select the flow rate which gives least RT & back pressure, good peak symmetry & separation of impurities. • In most cases ambient temperature is used to optimize the chromatographic conditions. • If peak is asymmetric with different mobile phase and column combinations then temperatures above ambient can be used. • Increase in temperature decreases analysis time • Increasing flow rate, increasing temperature (up to column stability limit at a particular pH), increasing the concentration of the organic eluent, and using shorter columns with narrower dimensions may be used to obtain more desirable run times.
  • 45.
    METHOD OPTIMIZATION OPTIMIZATION CONSIDERATIONS • MOBILEPHASE pH • ORGANIC SOLVENT COMPOSITION • FLOW RATE • GRADIENT ELUTION • TYPE OF COLUMN • COLUMN TEMPEARTURE DATA SYSTEMS • DRYLAB • AMDS-WATERS • CHROMSWORD • AUTOCHROM
  • 46.
  • 47.
    HIGH PRESSURE NO PRESSURE/ LOW PRESSURE NO FLOW NO PEAKS/VERY SMALL PEAKS
  • 48.
    PEAK TAILING ON INITIAL& LATER INJECTIONS SPLIT PEAKS LOSS OF RESOLUTION VARIABLE RT
  • 49.
    BASE LINE DRIFTROUNDEDPEAKS FRONTING PEAKS TAILING PEAKS
  • 50.
    GHOST PEAKSNEGATIVE PEAKS CHANGEIN SELECTIVITY CHANGE IN PEAK HEIGHT
  • 51.
    METHOD VALIDATION 1 •ACCURACY 2 • PRECISION 3 • SPECIFICITY 4 • LIMIT OF DETECTION 5 • LIMIT OF QUANTITATION 6 • ROBUSTNESS 7 • ANALYTICAL SOLUTION STABILITY 8 • STABILITY STUDIES
  • 52.