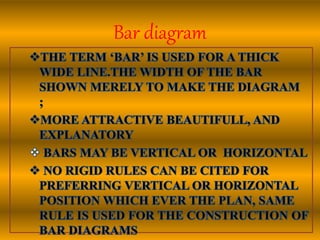
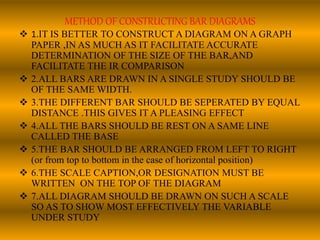
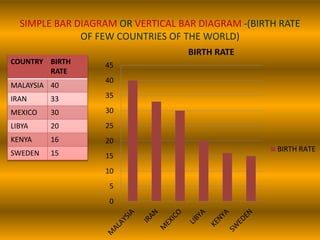
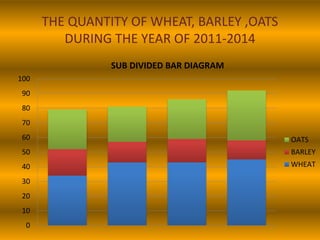
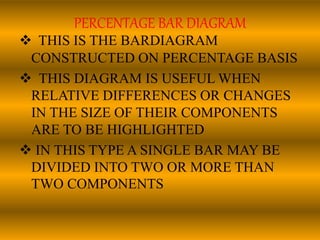
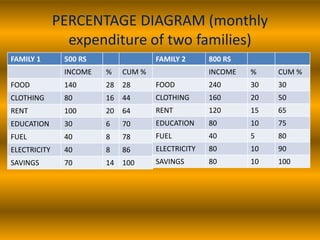
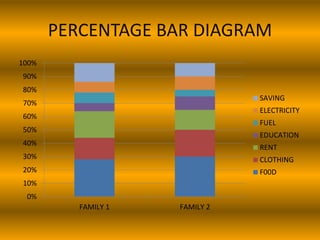
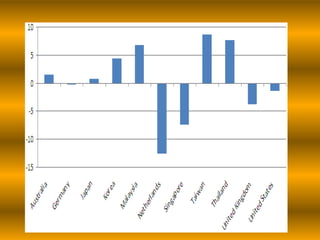
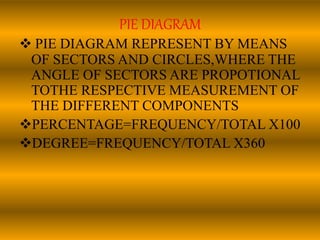
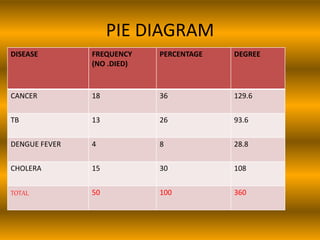
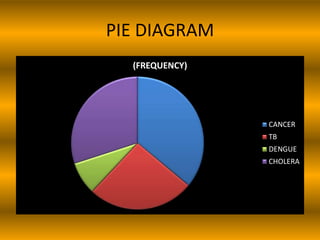
SlideShare a Scribd company logo
WELCOMESasna.p.s
William playfair
(1786 –bar diagram)
(1801-pie chart)
Bar diagram
METHOD OF CONSTRUCTING BAR DIAGRAMS
 1.IT IS BETTER TO CONSTRUCT A DIAGRAM ON A GRAPH
PAPER ,IN AS MUCH AS IT FACILITATE ACCURATE
DETERMINATION OF THE SIZE OF THE BAR,AND
FACILITATE THE IR COMPARISON
 2.ALL BARS ARE DRAWN IN A SINGLE STUDY SHOULD BE
OF THE SAME WIDTH.
 3.THE DIFFERENT BAR SHOULD BE SEPERATED BY EQUAL
DISTANCE .THIS GIVES IT A PLEASING EFFECT
 4.ALL THE BARS SHOULD BE REST ON A SAME LINE
CALLED THE BASE
 5.THE BAR SHOULD BE ARRANGED FROM LEFT TO RIGHT
(or from top to bottom in the case of horizontal position)
 6.THE SCALE CAPTION,OR DESIGNATION MUST BE
WRITTEN ON THE TOP OF THE DIAGRAM
 7.ALL DIAGRAM SHOULD BE DRAWN ON SUCH A SCALE
SO AS TO SHOW MOST EFFECTIVELY THE VARIABLE
UNDER STUDY
SIMPLE BAR DIAGRAM
A SIMPLE BAR DIAGRAM IS A ONE
DIMENTIONAL DIAGRAM IN WHICH
THE BARS REPRESENTS THE WHOLE OF
MAGNITUDE
(QUESTION:-THE BIRTH RATE OF FEW COUNTRIESOF THE WORLD.IN
THIS ;THE FIGURES THE BARS ARE IN VERTICAL POSITION)
SIMPLE BAR DIAGRAM OR VERTICAL BAR DIAGRAM -(BIRTH RATE
OF FEW COUNTRIES OF THE WORLD)
0
5
10
15
20
25
30
35
40
45
BIRTH RATE
BIRTH RATE
COUNTRY BIRTH
RATE
MALAYSIA 40
IRAN 33
MEXICO 30
LIBYA 20
KENYA 16
SWEDEN 15
HORIZONTAL BAR DIAGRAM
 IT IS ALSO POSSIBLE TO DRAW
HORIZONTAL BAR DIAGRAM .. WHICH
MEANS THAT THE LONGER THE
BAR,LARGER THE CATEGORY.
 IT IS AN EFFECTIVE WAY OF PRESENTING
DATA WHEN THE DIFFERENT CATEGORIES
HAVE LONG TITLES,THAT WOULD BE
DIFFICULT TO INCLUDE BELOW A
VERTICAL BAR.(OR WHEN THERE ARE LARGE
NUMBER OF DIFFERENT CATEGORIES) AND THERE
IS ENOUGH SPACE TO FIT ALL COLOUMN
REQUIRED FOR A VERTICAL BAR CHART
ACROSS THE PAGE
HORIZONTAL BAR DIAGRAM
0 10 20 30 40 50
MALAYSIA
IRAN
MEXICO
LIBYA
KENYA
SWEDEN
BIRTH RATE
BIRTH RATE
SUB DIVIDED BARDIAGRAM
 THE BARDIAGRAM USED TO EXHIBIT
THE DIVISIONS OF WHOLE IN TO
COMPARTMENTS(THE GIVEN MAGNITUDE CAN BE
DIVIDED IN TO SUB DIVISIONS OR A SIPLE BAR MAY BE
SUBDIVIDED IN THE RATIO OF THE VARIOUS DIVISIONS TO
EXHIBIT THE RELATIONSHIP OF THE PART S TOTHE WHOLE)
 IT SHOULD REMEMBERED THAT
THE ORDER IN WHICH THE
COMPONENTS ARE SHOWN IN A
BAR IS FOLLOWED IN ALL THE
BARS USED IN THE DIAGRAM
THE QUANTITY OF WHEAT,BARLEY,OATS
DURING THE YEAR OF 2011-2014
YEARS WHEAT BARLEY OATS
2011 34 18 27
2012 43 14 24
2013 43 16 27
2014 45 13 34
THE QUANTITY OF WHEAT, BARLEY ,OATS
DURING THE YEAR OF 2011-2014
0
10
20
30
40
50
60
70
80
90
100
SUB DIVIDED BAR DIAGRAM
OATS
BARLEY
WHEAT
PERCENTAGE BAR DIAGRAM
 THIS IS THE BARDIAGRAM
CONSTRUCTED ON PERCENTAGE BASIS
 THIS DIAGRAM IS USEFUL WHEN
RELATIVE DIFFERENCES OR CHANGES
IN THE SIZE OF THEIR COMPONENTS
ARE TO BE HIGHLIGHTED
 IN THIS TYPE A SINGLE BAR MAY BE
DIVIDED INTO TWO OR MORE THAN
TWO COMPONENTS
PERCENTAGE DIAGRAM (monthly
expenditure of two families)
FAMILY 1 500 RS
INCOME % CUM %
FOOD 140 28 28
CLOTHING 80 16 44
RENT 100 20 64
EDUCATION 30 6 70
FUEL 40 8 78
ELECTRICITY 40 8 86
SAVINGS 70 14 100
FAMILY 2 800 RS
INCOME % CUM %
FOOD 240 30 30
CLOTHING 160 20 50
RENT 120 15 65
EDUCATION 80 10 75
FUEL 40 5 80
ELECTRICITY 80 10 90
SAVINGS 80 10 100
PERCENTAGE BAR DIAGRAM
0%
10%
20%
30%
40%
50%
60%
70%
80%
90%
100%
FAMILY 1 FAMILY 2
SAVING
ELECTRICITY
FUEL
EDUCATION
RENT
CLOTHING
F00D
MULTIPLE BAR DIAGRAM
 IN MULTIPLE BAR DIAGRAM TWO OR
MORE SETS OF DATA INTER-RELATED
ARE PRESENTED
THE TECHINIQUE OF DRAWING
DIAGRAM IS THAT OF A SIMPLE BAR
DIAGRAM
THE DIFFERENT BAR ARE
DIFFERENTIATED USING DIFFERENT
COLOURS,SHADES,DOTS,OR CROSSING
MULTIPLE BAR DIAGRAM
YEARS IMPORTS EXPORTS
2010 7930 4260
2011 8850 5225
2012 9780 6150
2013 11720 7340
2014 12150 8145
MULTIPLE BAR DIAGRAM(MULTIPLE BAR
DIAGRAM SHOWING IMPORTS &EXPORTS FOR THE YEAR 2010-2014)
0
2000
4000
6000
8000
10000
12000
14000
2010 2011 2012 2013 2014
imports
exports
Bilateral bar diagram
 BILATERAL CHARTS,ALSO CALLED “GAIN
OR LOSS”CHARTS;EMPLOY BARS TO SHOW
PLUS AND MINUS DIRECTION FROM THE
POINT OF REFERENCE.
PIE DIAGRAM
 PIE DIAGRAM REPRESENT BY MEANS
OF SECTORS AND CIRCLES,WHERE THE
ANGLE OF SECTORS ARE PROPOTIONAL
TOTHE RESPECTIVE MEASUREMENT OF
THE DIFFERENT COMPONENTS
PERCENTAGE=FREQUENCY/TOTAL X100
DEGREE=FREQUENCY/TOTAL X360
HOW TO CONSTRUCT PIE DIAGRAM
• GATHER YOUR NUMERICAL DATAAND LABEL
INFORMATION AND WRITE IT DOWN WITH ONE DATA
POINT PER LINE
• ADD THE DATAALL TOGETHER CALCULATETHE TOTAL
.THIS NUMBER WILL BE DENOMINATOR
• CALCULATE THE % OF THE TOTAL FOR EACH DATA
POINT BY DIVIDING EACH ONE BY THE DENOMINATOR
CALCULATED .
• CALCULATE THE ANGLE BETWEEN THEM BY MULTIPLY
WITH 360
• USE MATHEMATICAL COMPASS TO DRAW DATA
• DRAW THE RADIUS
• USE PROTRACTER TO POSITION THE ANGLE
• DRAW EACH SECTION
• COLOUR EACH SEGMENT
PIE DIAGRAM
DISEASE FREQUENCY
(NO .DIED)
PERCENTAGE DEGREE
CANCER 18 36 129.6
TB 13 26 93.6
DENGUE FEVER 4 8 28.8
CHOLERA 15 30 108
TOTAL 50 100 360
PIE DIAGRAM
(FREQUENCY)
CANCER
TB
DENGUE
CHOLERA
THANK
YOU

More Related Content

What's hot

PRESENTATION OF DATA.pptx
PRESENTATION OF DATA.pptxPRESENTATION OF DATA.pptx
PRESENTATION OF DATA.pptx
LadeneDenila
 
MERITS AND DEMERITS OF MEAN,MEDIAN,MODE,GM,HM AND WHEN TO USE THEM
MERITS AND DEMERITS OF MEAN,MEDIAN,MODE,GM,HM AND WHEN TO USE THEMMERITS AND DEMERITS OF MEAN,MEDIAN,MODE,GM,HM AND WHEN TO USE THEM
MERITS AND DEMERITS OF MEAN,MEDIAN,MODE,GM,HM AND WHEN TO USE THEM
RephelPaulManasaiS
 
Proc SQL in SAS Enterprise Guide 4.3
Proc SQL in SAS Enterprise Guide 4.3Proc SQL in SAS Enterprise Guide 4.3
Proc SQL in SAS Enterprise Guide 4.3Mark Tabladillo
 
SAS Access / SAS Connect
SAS Access / SAS ConnectSAS Access / SAS Connect
SAS Access / SAS Connect
guest2160992
 
Correlation
CorrelationCorrelation
Correlation
ancytd
 
Graphical Representation of data
Graphical Representation of dataGraphical Representation of data
Graphical Representation of data
Jijo K Mathew
 
Correlation and partial correlation
Correlation and partial correlationCorrelation and partial correlation
Correlation and partial correlation
Udaybhaskar Mogallapu
 
Conditional statements in sas
Conditional statements in sasConditional statements in sas
Conditional statements in sasvenkatam
 
Correlation analysis
Correlation analysisCorrelation analysis
Correlation analysis
Shiela Vinarao
 
Correlationanalysis
CorrelationanalysisCorrelationanalysis
Correlationanalysis
Libu Thomas
 
Introduction to SAS Data Set Options
Introduction to SAS Data Set OptionsIntroduction to SAS Data Set Options
Introduction to SAS Data Set Options
Mark Tabladillo
 
Covariance and correlation
Covariance and correlationCovariance and correlation
Covariance and correlationRashid Hussain
 
Measures of dispersion
Measures of dispersionMeasures of dispersion
Measures of dispersionSachin Shekde
 
Measure of dispersion
Measure of dispersionMeasure of dispersion
Measure of dispersion
Anil Pokhrel
 
Dot Plot Presentation
Dot Plot PresentationDot Plot Presentation
Dot Plot Presentation
Dr. Amjad Ali Arain
 
Where Vs If Statement
Where Vs If StatementWhere Vs If Statement
Where Vs If Statement
Sunil Gupta
 
Presentation of Data
Presentation of DataPresentation of Data
Presentation of Data
Umair Anwar
 
Correlation analysis
Correlation analysis Correlation analysis
Correlation analysis
Misab P.T
 
Data organization
Data organizationData organization
Data organization
rowell balala
 

What's hot (20)

PRESENTATION OF DATA.pptx
PRESENTATION OF DATA.pptxPRESENTATION OF DATA.pptx
PRESENTATION OF DATA.pptx
 
MERITS AND DEMERITS OF MEAN,MEDIAN,MODE,GM,HM AND WHEN TO USE THEM
MERITS AND DEMERITS OF MEAN,MEDIAN,MODE,GM,HM AND WHEN TO USE THEMMERITS AND DEMERITS OF MEAN,MEDIAN,MODE,GM,HM AND WHEN TO USE THEM
MERITS AND DEMERITS OF MEAN,MEDIAN,MODE,GM,HM AND WHEN TO USE THEM
 
Proc SQL in SAS Enterprise Guide 4.3
Proc SQL in SAS Enterprise Guide 4.3Proc SQL in SAS Enterprise Guide 4.3
Proc SQL in SAS Enterprise Guide 4.3
 
SAS Access / SAS Connect
SAS Access / SAS ConnectSAS Access / SAS Connect
SAS Access / SAS Connect
 
Correlation
CorrelationCorrelation
Correlation
 
Graphical Representation of data
Graphical Representation of dataGraphical Representation of data
Graphical Representation of data
 
Correlation and partial correlation
Correlation and partial correlationCorrelation and partial correlation
Correlation and partial correlation
 
Conditional statements in sas
Conditional statements in sasConditional statements in sas
Conditional statements in sas
 
Correlation analysis
Correlation analysisCorrelation analysis
Correlation analysis
 
Correlationanalysis
CorrelationanalysisCorrelationanalysis
Correlationanalysis
 
Introduction to SAS Data Set Options
Introduction to SAS Data Set OptionsIntroduction to SAS Data Set Options
Introduction to SAS Data Set Options
 
PEARSON'CORRELATION
PEARSON'CORRELATION PEARSON'CORRELATION
PEARSON'CORRELATION
 
Covariance and correlation
Covariance and correlationCovariance and correlation
Covariance and correlation
 
Measures of dispersion
Measures of dispersionMeasures of dispersion
Measures of dispersion
 
Measure of dispersion
Measure of dispersionMeasure of dispersion
Measure of dispersion
 
Dot Plot Presentation
Dot Plot PresentationDot Plot Presentation
Dot Plot Presentation
 
Where Vs If Statement
Where Vs If StatementWhere Vs If Statement
Where Vs If Statement
 
Presentation of Data
Presentation of DataPresentation of Data
Presentation of Data
 
Correlation analysis
Correlation analysis Correlation analysis
Correlation analysis
 
Data organization
Data organizationData organization
Data organization
 

Viewers also liked

online assignment
online assignmentonline assignment
online assignment
mi5thu
 
Graphical representation of data in excel
Graphical representation of data in excelGraphical representation of data in excel
Graphical representation of data in excel
anam
 
Rt graphical representation
Rt graphical representationRt graphical representation
Rt graphical representation
Rinchen
 
Bar Diagram (chart) in Statistics presentation
Bar Diagram (chart) in Statistics presentationBar Diagram (chart) in Statistics presentation
Bar Diagram (chart) in Statistics presentation
sheiblu
 
Statistik perkuliahan
Statistik perkuliahanStatistik perkuliahan
Statistik perkuliahanfajrulhafidz
 
Presentationofdatamod6b
Presentationofdatamod6bPresentationofdatamod6b
Presentationofdatamod6b
Chie Pegollo
 
Pictogram PPT Presentation
Pictogram PPT PresentationPictogram PPT Presentation
Pictogram PPT PresentationAngelicaGuna
 
Qt graphical representation of data
Qt   graphical representation of dataQt   graphical representation of data
Qt graphical representation of dataJoel Pais
 
Analisis & interpretasi
Analisis & interpretasiAnalisis & interpretasi
Analisis & interpretasiJoni Iswanto
 
Chapter 3: Prsentation of Data
Chapter 3: Prsentation of DataChapter 3: Prsentation of Data
Chapter 3: Prsentation of Data
Andrilyn Alcantara
 
Graphical presentation of data
Graphical presentation of dataGraphical presentation of data
Graphical presentation of dataprince irfan
 
Types of graphs
Types of graphsTypes of graphs
Types of graphs
abigail Dayrit
 
Single line diagram
Single line diagramSingle line diagram
Single line diagram
Md. Rimon Mia
 
Types of graphs
Types of graphsTypes of graphs
Types of graphsbweldon
 
Introduction to graph class 8
Introduction to graph class 8Introduction to graph class 8
Introduction to graph class 8
Monika Rana
 
Graphical representation of data mohit verma
Graphical representation of data mohit verma Graphical representation of data mohit verma
Graphical representation of data mohit verma
MOHIT KUMAR VERMA
 
Graphical presentation of data
Graphical presentation of dataGraphical presentation of data
Graphical presentation of datadrasifk
 

Viewers also liked (20)

online assignment
online assignmentonline assignment
online assignment
 
Graphical representation of data in excel
Graphical representation of data in excelGraphical representation of data in excel
Graphical representation of data in excel
 
Chapter 4 presentation of data
Chapter 4 presentation of dataChapter 4 presentation of data
Chapter 4 presentation of data
 
Rt graphical representation
Rt graphical representationRt graphical representation
Rt graphical representation
 
Bar Diagram (chart) in Statistics presentation
Bar Diagram (chart) in Statistics presentationBar Diagram (chart) in Statistics presentation
Bar Diagram (chart) in Statistics presentation
 
Statistik perkuliahan
Statistik perkuliahanStatistik perkuliahan
Statistik perkuliahan
 
Topic 8 graphs
Topic 8 graphsTopic 8 graphs
Topic 8 graphs
 
Presentationofdatamod6b
Presentationofdatamod6bPresentationofdatamod6b
Presentationofdatamod6b
 
Pictogram PPT Presentation
Pictogram PPT PresentationPictogram PPT Presentation
Pictogram PPT Presentation
 
Qt graphical representation of data
Qt   graphical representation of dataQt   graphical representation of data
Qt graphical representation of data
 
Analisis & interpretasi
Analisis & interpretasiAnalisis & interpretasi
Analisis & interpretasi
 
Chapter 3: Prsentation of Data
Chapter 3: Prsentation of DataChapter 3: Prsentation of Data
Chapter 3: Prsentation of Data
 
Graphical presentation of data
Graphical presentation of dataGraphical presentation of data
Graphical presentation of data
 
Types of graphs
Types of graphsTypes of graphs
Types of graphs
 
Single line diagram
Single line diagramSingle line diagram
Single line diagram
 
Types of graphs
Types of graphsTypes of graphs
Types of graphs
 
Introduction to graph class 8
Introduction to graph class 8Introduction to graph class 8
Introduction to graph class 8
 
Graphical representation of data mohit verma
Graphical representation of data mohit verma Graphical representation of data mohit verma
Graphical representation of data mohit verma
 
Graphical presentation of data
Graphical presentation of dataGraphical presentation of data
Graphical presentation of data
 
Graphs ppt
Graphs pptGraphs ppt
Graphs ppt
 

More from sana sana

Solid waste disposal and mangrove destruction
Solid waste disposal and mangrove destructionSolid waste disposal and mangrove destruction
Solid waste disposal and mangrove destruction
sana sana
 
sand mining,food adulteration,changing crop pattern,quarring
sand mining,food adulteration,changing crop pattern,quarringsand mining,food adulteration,changing crop pattern,quarring
sand mining,food adulteration,changing crop pattern,quarring
sana sana
 
agencies of environmental protection
agencies of environmental protectionagencies of environmental protection
agencies of environmental protection
sana sana
 
environmental movements in india and kerala
environmental movements in  india and keralaenvironmental movements in  india and kerala
environmental movements in india and kerala
sana sana
 
WATER POLLUTION AND MARINE POLLUTION
WATER POLLUTION AND MARINE POLLUTIONWATER POLLUTION AND MARINE POLLUTION
WATER POLLUTION AND MARINE POLLUTION
sana sana
 
WATER POLLTUON
WATER POLLTUONWATER POLLTUON
WATER POLLTUON
sana sana
 
teaching methods of environmental education
teaching methods of environmental educationteaching methods of environmental education
teaching methods of environmental education
sana sana
 
extinction of species loss of habitat and biodiversity types of biodiversity ...
extinction of species loss of habitat and biodiversity types of biodiversity ...extinction of species loss of habitat and biodiversity types of biodiversity ...
extinction of species loss of habitat and biodiversity types of biodiversity ...
sana sana
 
objectives and principles of environmental education
objectives and principles of environmental educationobjectives and principles of environmental education
objectives and principles of environmental education
sana sana
 
environmental education techniques
environmental education techniquesenvironmental education techniques
environmental education techniques
sana sana
 
co curricular activities in environmental education
co curricular activities in environmental educationco curricular activities in environmental education
co curricular activities in environmental education
sana sana
 
APPROACHES IN ENVIRONMENTAL EDUCATION
APPROACHES IN ENVIRONMENTAL EDUCATIONAPPROACHES IN ENVIRONMENTAL EDUCATION
APPROACHES IN ENVIRONMENTAL EDUCATION
sana sana
 
principles of environment
principles of environmentprinciples of environment
principles of environment
sana sana
 
meaning significance and characteristics of environmental education
meaning significance and characteristics of environmental educationmeaning significance and characteristics of environmental education
meaning significance and characteristics of environmental education
sana sana
 
simple presentation of noise and radioactive pollution
simple presentation of noise and radioactive pollutionsimple presentation of noise and radioactive pollution
simple presentation of noise and radioactive pollution
sana sana
 
basic idea of natural resources
basic idea of natural resourcesbasic idea of natural resources
basic idea of natural resources
sana sana
 
Biodiversity in sustainable development
Biodiversity in sustainable developmentBiodiversity in sustainable development
Biodiversity in sustainable development
sana sana
 
indutrialisation,modernisation,urbanisation and its impacts on the environment
indutrialisation,modernisation,urbanisation and its impacts on the environmentindutrialisation,modernisation,urbanisation and its impacts on the environment
indutrialisation,modernisation,urbanisation and its impacts on the environment
sana sana
 
viral diseases of human prepared by hasna
 viral diseases of human prepared by hasna viral diseases of human prepared by hasna
viral diseases of human prepared by hasna
sana sana
 
composition of the microbial world and turning points in microbiological rese...
composition of the microbial world and turning points in microbiological rese...composition of the microbial world and turning points in microbiological rese...
composition of the microbial world and turning points in microbiological rese...
sana sana
 

More from sana sana (20)

Solid waste disposal and mangrove destruction
Solid waste disposal and mangrove destructionSolid waste disposal and mangrove destruction
Solid waste disposal and mangrove destruction
 
sand mining,food adulteration,changing crop pattern,quarring
sand mining,food adulteration,changing crop pattern,quarringsand mining,food adulteration,changing crop pattern,quarring
sand mining,food adulteration,changing crop pattern,quarring
 
agencies of environmental protection
agencies of environmental protectionagencies of environmental protection
agencies of environmental protection
 
environmental movements in india and kerala
environmental movements in  india and keralaenvironmental movements in  india and kerala
environmental movements in india and kerala
 
WATER POLLUTION AND MARINE POLLUTION
WATER POLLUTION AND MARINE POLLUTIONWATER POLLUTION AND MARINE POLLUTION
WATER POLLUTION AND MARINE POLLUTION
 
WATER POLLTUON
WATER POLLTUONWATER POLLTUON
WATER POLLTUON
 
teaching methods of environmental education
teaching methods of environmental educationteaching methods of environmental education
teaching methods of environmental education
 
extinction of species loss of habitat and biodiversity types of biodiversity ...
extinction of species loss of habitat and biodiversity types of biodiversity ...extinction of species loss of habitat and biodiversity types of biodiversity ...
extinction of species loss of habitat and biodiversity types of biodiversity ...
 
objectives and principles of environmental education
objectives and principles of environmental educationobjectives and principles of environmental education
objectives and principles of environmental education
 
environmental education techniques
environmental education techniquesenvironmental education techniques
environmental education techniques
 
co curricular activities in environmental education
co curricular activities in environmental educationco curricular activities in environmental education
co curricular activities in environmental education
 
APPROACHES IN ENVIRONMENTAL EDUCATION
APPROACHES IN ENVIRONMENTAL EDUCATIONAPPROACHES IN ENVIRONMENTAL EDUCATION
APPROACHES IN ENVIRONMENTAL EDUCATION
 
principles of environment
principles of environmentprinciples of environment
principles of environment
 
meaning significance and characteristics of environmental education
meaning significance and characteristics of environmental educationmeaning significance and characteristics of environmental education
meaning significance and characteristics of environmental education
 
simple presentation of noise and radioactive pollution
simple presentation of noise and radioactive pollutionsimple presentation of noise and radioactive pollution
simple presentation of noise and radioactive pollution
 
basic idea of natural resources
basic idea of natural resourcesbasic idea of natural resources
basic idea of natural resources
 
Biodiversity in sustainable development
Biodiversity in sustainable developmentBiodiversity in sustainable development
Biodiversity in sustainable development
 
indutrialisation,modernisation,urbanisation and its impacts on the environment
indutrialisation,modernisation,urbanisation and its impacts on the environmentindutrialisation,modernisation,urbanisation and its impacts on the environment
indutrialisation,modernisation,urbanisation and its impacts on the environment
 
viral diseases of human prepared by hasna
 viral diseases of human prepared by hasna viral diseases of human prepared by hasna
viral diseases of human prepared by hasna
 
composition of the microbial world and turning points in microbiological rese...
composition of the microbial world and turning points in microbiological rese...composition of the microbial world and turning points in microbiological rese...
composition of the microbial world and turning points in microbiological rese...
 

Recently uploaded

ESR_factors_affect-clinic significance-Pathysiology.pptx
ESR_factors_affect-clinic significance-Pathysiology.pptxESR_factors_affect-clinic significance-Pathysiology.pptx
ESR_factors_affect-clinic significance-Pathysiology.pptx
muralinath2
 
role of pramana in research.pptx in science
role of pramana in research.pptx in sciencerole of pramana in research.pptx in science
role of pramana in research.pptx in science
sonaliswain16
 
In silico drugs analogue design: novobiocin analogues.pptx
In silico drugs analogue design: novobiocin analogues.pptxIn silico drugs analogue design: novobiocin analogues.pptx
In silico drugs analogue design: novobiocin analogues.pptx
AlaminAfendy1
 
erythropoiesis-I_mechanism& clinical significance.pptx
erythropoiesis-I_mechanism& clinical significance.pptxerythropoiesis-I_mechanism& clinical significance.pptx
erythropoiesis-I_mechanism& clinical significance.pptx
muralinath2
 
extra-chromosomal-inheritance[1].pptx.pdfpdf
extra-chromosomal-inheritance[1].pptx.pdfpdfextra-chromosomal-inheritance[1].pptx.pdfpdf
extra-chromosomal-inheritance[1].pptx.pdfpdf
DiyaBiswas10
 
platelets- lifespan -Clot retraction-disorders.pptx
platelets- lifespan -Clot retraction-disorders.pptxplatelets- lifespan -Clot retraction-disorders.pptx
platelets- lifespan -Clot retraction-disorders.pptx
muralinath2
 
NuGOweek 2024 Ghent - programme - final version
NuGOweek 2024 Ghent - programme - final versionNuGOweek 2024 Ghent - programme - final version
NuGOweek 2024 Ghent - programme - final version
pablovgd
 
Observation of Io’s Resurfacing via Plume Deposition Using Ground-based Adapt...
Observation of Io’s Resurfacing via Plume Deposition Using Ground-based Adapt...Observation of Io’s Resurfacing via Plume Deposition Using Ground-based Adapt...
Observation of Io’s Resurfacing via Plume Deposition Using Ground-based Adapt...
Sérgio Sacani
 
Unveiling the Energy Potential of Marshmallow Deposits.pdf
Unveiling the Energy Potential of Marshmallow Deposits.pdfUnveiling the Energy Potential of Marshmallow Deposits.pdf
Unveiling the Energy Potential of Marshmallow Deposits.pdf
Erdal Coalmaker
 
Nutraceutical market, scope and growth: Herbal drug technology
Nutraceutical market, scope and growth: Herbal drug technologyNutraceutical market, scope and growth: Herbal drug technology
Nutraceutical market, scope and growth: Herbal drug technology
Lokesh Patil
 
GBSN - Microbiology (Lab 4) Culture Media
GBSN - Microbiology (Lab 4) Culture MediaGBSN - Microbiology (Lab 4) Culture Media
GBSN - Microbiology (Lab 4) Culture Media
Areesha Ahmad
 
Structural Classification Of Protein (SCOP)
Structural Classification Of Protein  (SCOP)Structural Classification Of Protein  (SCOP)
Structural Classification Of Protein (SCOP)
aishnasrivastava
 
What is greenhouse gasses and how many gasses are there to affect the Earth.
What is greenhouse gasses and how many gasses are there to affect the Earth.What is greenhouse gasses and how many gasses are there to affect the Earth.
What is greenhouse gasses and how many gasses are there to affect the Earth.
moosaasad1975
 
Citrus Greening Disease and its Management
Citrus Greening Disease and its ManagementCitrus Greening Disease and its Management
Citrus Greening Disease and its Management
subedisuryaofficial
 
Comparative structure of adrenal gland in vertebrates
Comparative structure of adrenal gland in vertebratesComparative structure of adrenal gland in vertebrates
Comparative structure of adrenal gland in vertebrates
sachin783648
 
Richard's aventures in two entangled wonderlands
Richard's aventures in two entangled wonderlandsRichard's aventures in two entangled wonderlands
Richard's aventures in two entangled wonderlands
Richard Gill
 
Earliest Galaxies in the JADES Origins Field: Luminosity Function and Cosmic ...
Earliest Galaxies in the JADES Origins Field: Luminosity Function and Cosmic ...Earliest Galaxies in the JADES Origins Field: Luminosity Function and Cosmic ...
Earliest Galaxies in the JADES Origins Field: Luminosity Function and Cosmic ...
Sérgio Sacani
 
Deep Behavioral Phenotyping in Systems Neuroscience for Functional Atlasing a...
Deep Behavioral Phenotyping in Systems Neuroscience for Functional Atlasing a...Deep Behavioral Phenotyping in Systems Neuroscience for Functional Atlasing a...
Deep Behavioral Phenotyping in Systems Neuroscience for Functional Atlasing a...
Ana Luísa Pinho
 
Comparing Evolved Extractive Text Summary Scores of Bidirectional Encoder Rep...
Comparing Evolved Extractive Text Summary Scores of Bidirectional Encoder Rep...Comparing Evolved Extractive Text Summary Scores of Bidirectional Encoder Rep...
Comparing Evolved Extractive Text Summary Scores of Bidirectional Encoder Rep...
University of Maribor
 
THE IMPORTANCE OF MARTIAN ATMOSPHERE SAMPLE RETURN.
THE IMPORTANCE OF MARTIAN ATMOSPHERE SAMPLE RETURN.THE IMPORTANCE OF MARTIAN ATMOSPHERE SAMPLE RETURN.
THE IMPORTANCE OF MARTIAN ATMOSPHERE SAMPLE RETURN.
Sérgio Sacani
 

Recently uploaded (20)

ESR_factors_affect-clinic significance-Pathysiology.pptx
ESR_factors_affect-clinic significance-Pathysiology.pptxESR_factors_affect-clinic significance-Pathysiology.pptx
ESR_factors_affect-clinic significance-Pathysiology.pptx
 
role of pramana in research.pptx in science
role of pramana in research.pptx in sciencerole of pramana in research.pptx in science
role of pramana in research.pptx in science
 
In silico drugs analogue design: novobiocin analogues.pptx
In silico drugs analogue design: novobiocin analogues.pptxIn silico drugs analogue design: novobiocin analogues.pptx
In silico drugs analogue design: novobiocin analogues.pptx
 
erythropoiesis-I_mechanism& clinical significance.pptx
erythropoiesis-I_mechanism& clinical significance.pptxerythropoiesis-I_mechanism& clinical significance.pptx
erythropoiesis-I_mechanism& clinical significance.pptx
 
extra-chromosomal-inheritance[1].pptx.pdfpdf
extra-chromosomal-inheritance[1].pptx.pdfpdfextra-chromosomal-inheritance[1].pptx.pdfpdf
extra-chromosomal-inheritance[1].pptx.pdfpdf
 
platelets- lifespan -Clot retraction-disorders.pptx
platelets- lifespan -Clot retraction-disorders.pptxplatelets- lifespan -Clot retraction-disorders.pptx
platelets- lifespan -Clot retraction-disorders.pptx
 
NuGOweek 2024 Ghent - programme - final version
NuGOweek 2024 Ghent - programme - final versionNuGOweek 2024 Ghent - programme - final version
NuGOweek 2024 Ghent - programme - final version
 
Observation of Io’s Resurfacing via Plume Deposition Using Ground-based Adapt...
Observation of Io’s Resurfacing via Plume Deposition Using Ground-based Adapt...Observation of Io’s Resurfacing via Plume Deposition Using Ground-based Adapt...
Observation of Io’s Resurfacing via Plume Deposition Using Ground-based Adapt...
 
Unveiling the Energy Potential of Marshmallow Deposits.pdf
Unveiling the Energy Potential of Marshmallow Deposits.pdfUnveiling the Energy Potential of Marshmallow Deposits.pdf
Unveiling the Energy Potential of Marshmallow Deposits.pdf
 
Nutraceutical market, scope and growth: Herbal drug technology
Nutraceutical market, scope and growth: Herbal drug technologyNutraceutical market, scope and growth: Herbal drug technology
Nutraceutical market, scope and growth: Herbal drug technology
 
GBSN - Microbiology (Lab 4) Culture Media
GBSN - Microbiology (Lab 4) Culture MediaGBSN - Microbiology (Lab 4) Culture Media
GBSN - Microbiology (Lab 4) Culture Media
 
Structural Classification Of Protein (SCOP)
Structural Classification Of Protein  (SCOP)Structural Classification Of Protein  (SCOP)
Structural Classification Of Protein (SCOP)
 
What is greenhouse gasses and how many gasses are there to affect the Earth.
What is greenhouse gasses and how many gasses are there to affect the Earth.What is greenhouse gasses and how many gasses are there to affect the Earth.
What is greenhouse gasses and how many gasses are there to affect the Earth.
 
Citrus Greening Disease and its Management
Citrus Greening Disease and its ManagementCitrus Greening Disease and its Management
Citrus Greening Disease and its Management
 
Comparative structure of adrenal gland in vertebrates
Comparative structure of adrenal gland in vertebratesComparative structure of adrenal gland in vertebrates
Comparative structure of adrenal gland in vertebrates
 
Richard's aventures in two entangled wonderlands
Richard's aventures in two entangled wonderlandsRichard's aventures in two entangled wonderlands
Richard's aventures in two entangled wonderlands
 
Earliest Galaxies in the JADES Origins Field: Luminosity Function and Cosmic ...
Earliest Galaxies in the JADES Origins Field: Luminosity Function and Cosmic ...Earliest Galaxies in the JADES Origins Field: Luminosity Function and Cosmic ...
Earliest Galaxies in the JADES Origins Field: Luminosity Function and Cosmic ...
 
Deep Behavioral Phenotyping in Systems Neuroscience for Functional Atlasing a...
Deep Behavioral Phenotyping in Systems Neuroscience for Functional Atlasing a...Deep Behavioral Phenotyping in Systems Neuroscience for Functional Atlasing a...
Deep Behavioral Phenotyping in Systems Neuroscience for Functional Atlasing a...
 
Comparing Evolved Extractive Text Summary Scores of Bidirectional Encoder Rep...
Comparing Evolved Extractive Text Summary Scores of Bidirectional Encoder Rep...Comparing Evolved Extractive Text Summary Scores of Bidirectional Encoder Rep...
Comparing Evolved Extractive Text Summary Scores of Bidirectional Encoder Rep...
 
THE IMPORTANCE OF MARTIAN ATMOSPHERE SAMPLE RETURN.
THE IMPORTANCE OF MARTIAN ATMOSPHERE SAMPLE RETURN.THE IMPORTANCE OF MARTIAN ATMOSPHERE SAMPLE RETURN.
THE IMPORTANCE OF MARTIAN ATMOSPHERE SAMPLE RETURN.
 

different typesbardiagram and pie diagram

  • 2. William playfair (1786 –bar diagram) (1801-pie chart)
  • 4. METHOD OF CONSTRUCTING BAR DIAGRAMS  1.IT IS BETTER TO CONSTRUCT A DIAGRAM ON A GRAPH PAPER ,IN AS MUCH AS IT FACILITATE ACCURATE DETERMINATION OF THE SIZE OF THE BAR,AND FACILITATE THE IR COMPARISON  2.ALL BARS ARE DRAWN IN A SINGLE STUDY SHOULD BE OF THE SAME WIDTH.  3.THE DIFFERENT BAR SHOULD BE SEPERATED BY EQUAL DISTANCE .THIS GIVES IT A PLEASING EFFECT  4.ALL THE BARS SHOULD BE REST ON A SAME LINE CALLED THE BASE  5.THE BAR SHOULD BE ARRANGED FROM LEFT TO RIGHT (or from top to bottom in the case of horizontal position)  6.THE SCALE CAPTION,OR DESIGNATION MUST BE WRITTEN ON THE TOP OF THE DIAGRAM  7.ALL DIAGRAM SHOULD BE DRAWN ON SUCH A SCALE SO AS TO SHOW MOST EFFECTIVELY THE VARIABLE UNDER STUDY
  • 5. SIMPLE BAR DIAGRAM A SIMPLE BAR DIAGRAM IS A ONE DIMENTIONAL DIAGRAM IN WHICH THE BARS REPRESENTS THE WHOLE OF MAGNITUDE (QUESTION:-THE BIRTH RATE OF FEW COUNTRIESOF THE WORLD.IN THIS ;THE FIGURES THE BARS ARE IN VERTICAL POSITION)
  • 6. SIMPLE BAR DIAGRAM OR VERTICAL BAR DIAGRAM -(BIRTH RATE OF FEW COUNTRIES OF THE WORLD) 0 5 10 15 20 25 30 35 40 45 BIRTH RATE BIRTH RATE COUNTRY BIRTH RATE MALAYSIA 40 IRAN 33 MEXICO 30 LIBYA 20 KENYA 16 SWEDEN 15
  • 7. HORIZONTAL BAR DIAGRAM  IT IS ALSO POSSIBLE TO DRAW HORIZONTAL BAR DIAGRAM .. WHICH MEANS THAT THE LONGER THE BAR,LARGER THE CATEGORY.  IT IS AN EFFECTIVE WAY OF PRESENTING DATA WHEN THE DIFFERENT CATEGORIES HAVE LONG TITLES,THAT WOULD BE DIFFICULT TO INCLUDE BELOW A VERTICAL BAR.(OR WHEN THERE ARE LARGE NUMBER OF DIFFERENT CATEGORIES) AND THERE IS ENOUGH SPACE TO FIT ALL COLOUMN REQUIRED FOR A VERTICAL BAR CHART ACROSS THE PAGE
  • 8. HORIZONTAL BAR DIAGRAM 0 10 20 30 40 50 MALAYSIA IRAN MEXICO LIBYA KENYA SWEDEN BIRTH RATE BIRTH RATE
  • 9. SUB DIVIDED BARDIAGRAM  THE BARDIAGRAM USED TO EXHIBIT THE DIVISIONS OF WHOLE IN TO COMPARTMENTS(THE GIVEN MAGNITUDE CAN BE DIVIDED IN TO SUB DIVISIONS OR A SIPLE BAR MAY BE SUBDIVIDED IN THE RATIO OF THE VARIOUS DIVISIONS TO EXHIBIT THE RELATIONSHIP OF THE PART S TOTHE WHOLE)  IT SHOULD REMEMBERED THAT THE ORDER IN WHICH THE COMPONENTS ARE SHOWN IN A BAR IS FOLLOWED IN ALL THE BARS USED IN THE DIAGRAM
  • 10. THE QUANTITY OF WHEAT,BARLEY,OATS DURING THE YEAR OF 2011-2014 YEARS WHEAT BARLEY OATS 2011 34 18 27 2012 43 14 24 2013 43 16 27 2014 45 13 34
  • 11. THE QUANTITY OF WHEAT, BARLEY ,OATS DURING THE YEAR OF 2011-2014 0 10 20 30 40 50 60 70 80 90 100 SUB DIVIDED BAR DIAGRAM OATS BARLEY WHEAT
  • 12. PERCENTAGE BAR DIAGRAM  THIS IS THE BARDIAGRAM CONSTRUCTED ON PERCENTAGE BASIS  THIS DIAGRAM IS USEFUL WHEN RELATIVE DIFFERENCES OR CHANGES IN THE SIZE OF THEIR COMPONENTS ARE TO BE HIGHLIGHTED  IN THIS TYPE A SINGLE BAR MAY BE DIVIDED INTO TWO OR MORE THAN TWO COMPONENTS
  • 13. PERCENTAGE DIAGRAM (monthly expenditure of two families) FAMILY 1 500 RS INCOME % CUM % FOOD 140 28 28 CLOTHING 80 16 44 RENT 100 20 64 EDUCATION 30 6 70 FUEL 40 8 78 ELECTRICITY 40 8 86 SAVINGS 70 14 100 FAMILY 2 800 RS INCOME % CUM % FOOD 240 30 30 CLOTHING 160 20 50 RENT 120 15 65 EDUCATION 80 10 75 FUEL 40 5 80 ELECTRICITY 80 10 90 SAVINGS 80 10 100
  • 14. PERCENTAGE BAR DIAGRAM 0% 10% 20% 30% 40% 50% 60% 70% 80% 90% 100% FAMILY 1 FAMILY 2 SAVING ELECTRICITY FUEL EDUCATION RENT CLOTHING F00D
  • 15. MULTIPLE BAR DIAGRAM  IN MULTIPLE BAR DIAGRAM TWO OR MORE SETS OF DATA INTER-RELATED ARE PRESENTED THE TECHINIQUE OF DRAWING DIAGRAM IS THAT OF A SIMPLE BAR DIAGRAM THE DIFFERENT BAR ARE DIFFERENTIATED USING DIFFERENT COLOURS,SHADES,DOTS,OR CROSSING
  • 16. MULTIPLE BAR DIAGRAM YEARS IMPORTS EXPORTS 2010 7930 4260 2011 8850 5225 2012 9780 6150 2013 11720 7340 2014 12150 8145
  • 17. MULTIPLE BAR DIAGRAM(MULTIPLE BAR DIAGRAM SHOWING IMPORTS &EXPORTS FOR THE YEAR 2010-2014) 0 2000 4000 6000 8000 10000 12000 14000 2010 2011 2012 2013 2014 imports exports
  • 18. Bilateral bar diagram  BILATERAL CHARTS,ALSO CALLED “GAIN OR LOSS”CHARTS;EMPLOY BARS TO SHOW PLUS AND MINUS DIRECTION FROM THE POINT OF REFERENCE.
  • 19.
  • 20. PIE DIAGRAM  PIE DIAGRAM REPRESENT BY MEANS OF SECTORS AND CIRCLES,WHERE THE ANGLE OF SECTORS ARE PROPOTIONAL TOTHE RESPECTIVE MEASUREMENT OF THE DIFFERENT COMPONENTS PERCENTAGE=FREQUENCY/TOTAL X100 DEGREE=FREQUENCY/TOTAL X360
  • 21. HOW TO CONSTRUCT PIE DIAGRAM • GATHER YOUR NUMERICAL DATAAND LABEL INFORMATION AND WRITE IT DOWN WITH ONE DATA POINT PER LINE • ADD THE DATAALL TOGETHER CALCULATETHE TOTAL .THIS NUMBER WILL BE DENOMINATOR • CALCULATE THE % OF THE TOTAL FOR EACH DATA POINT BY DIVIDING EACH ONE BY THE DENOMINATOR CALCULATED . • CALCULATE THE ANGLE BETWEEN THEM BY MULTIPLY WITH 360 • USE MATHEMATICAL COMPASS TO DRAW DATA • DRAW THE RADIUS • USE PROTRACTER TO POSITION THE ANGLE • DRAW EACH SECTION • COLOUR EACH SEGMENT
  • 22. PIE DIAGRAM DISEASE FREQUENCY (NO .DIED) PERCENTAGE DEGREE CANCER 18 36 129.6 TB 13 26 93.6 DENGUE FEVER 4 8 28.8 CHOLERA 15 30 108 TOTAL 50 100 360