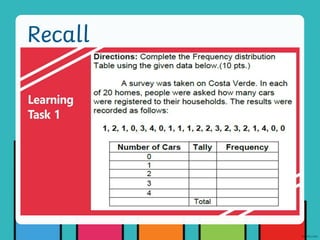
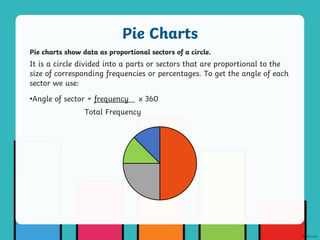
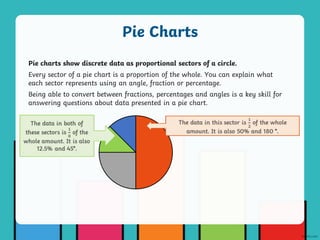
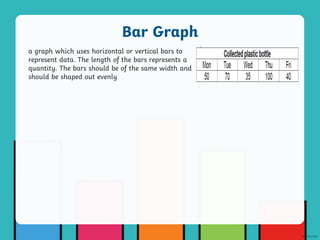
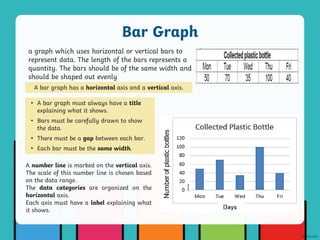
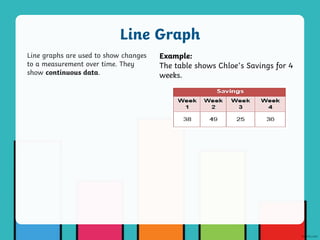
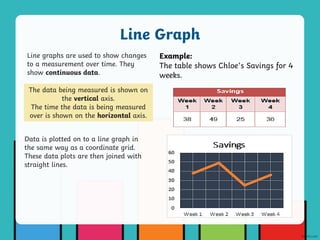
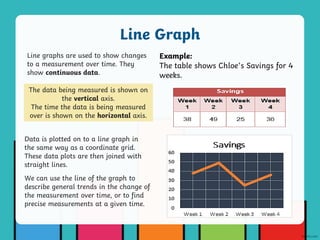
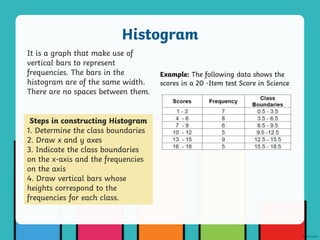
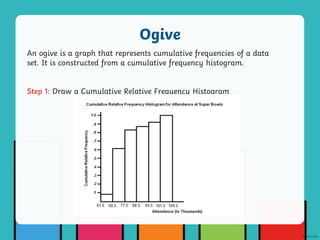
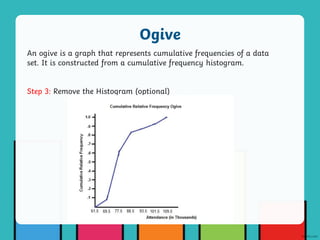
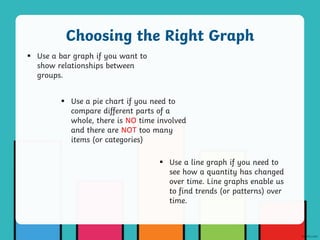
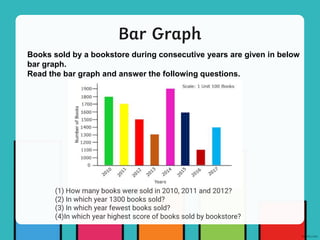
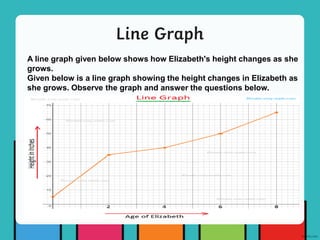
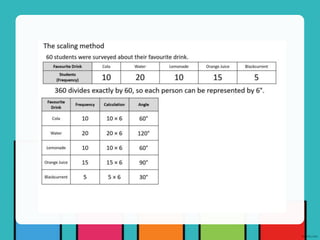
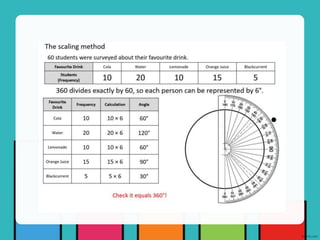
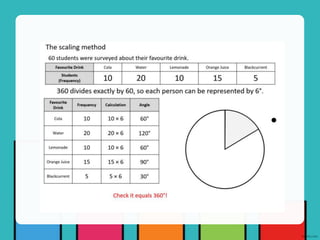
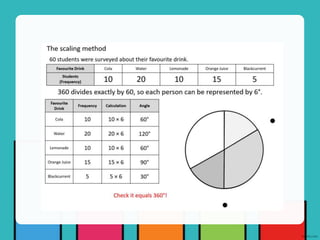
The document discusses different types of graphs used to represent organized data, including pie charts, bar graphs, line graphs, histograms, and ogives. It provides examples and explanations of how to construct and interpret each graph type. Key points covered include how pie charts show discrete data as proportional sectors of a circle, how bar graphs use horizontal or vertical bars to represent data quantities, and how line graphs show changes in a measurement over time.


![Presenting-Experimental-Data-Grade-8 [Autosaved].pptx](https://cdn.slidesharecdn.com/ss_thumbnails/presenting-experimental-data-grade-8autosaved-240925105557-9775d0ae-thumbnail.jpg?width=640&height=640&fit=bounds)
![Presenting-Experimental-Data-Grade-8 [Autosaved].pptx](https://cdn.slidesharecdn.com/ss_thumbnails/presenting-experimental-data-grade-8autosaved-240925104859-008a237a-thumbnail.jpg?width=640&height=640&fit=bounds)


