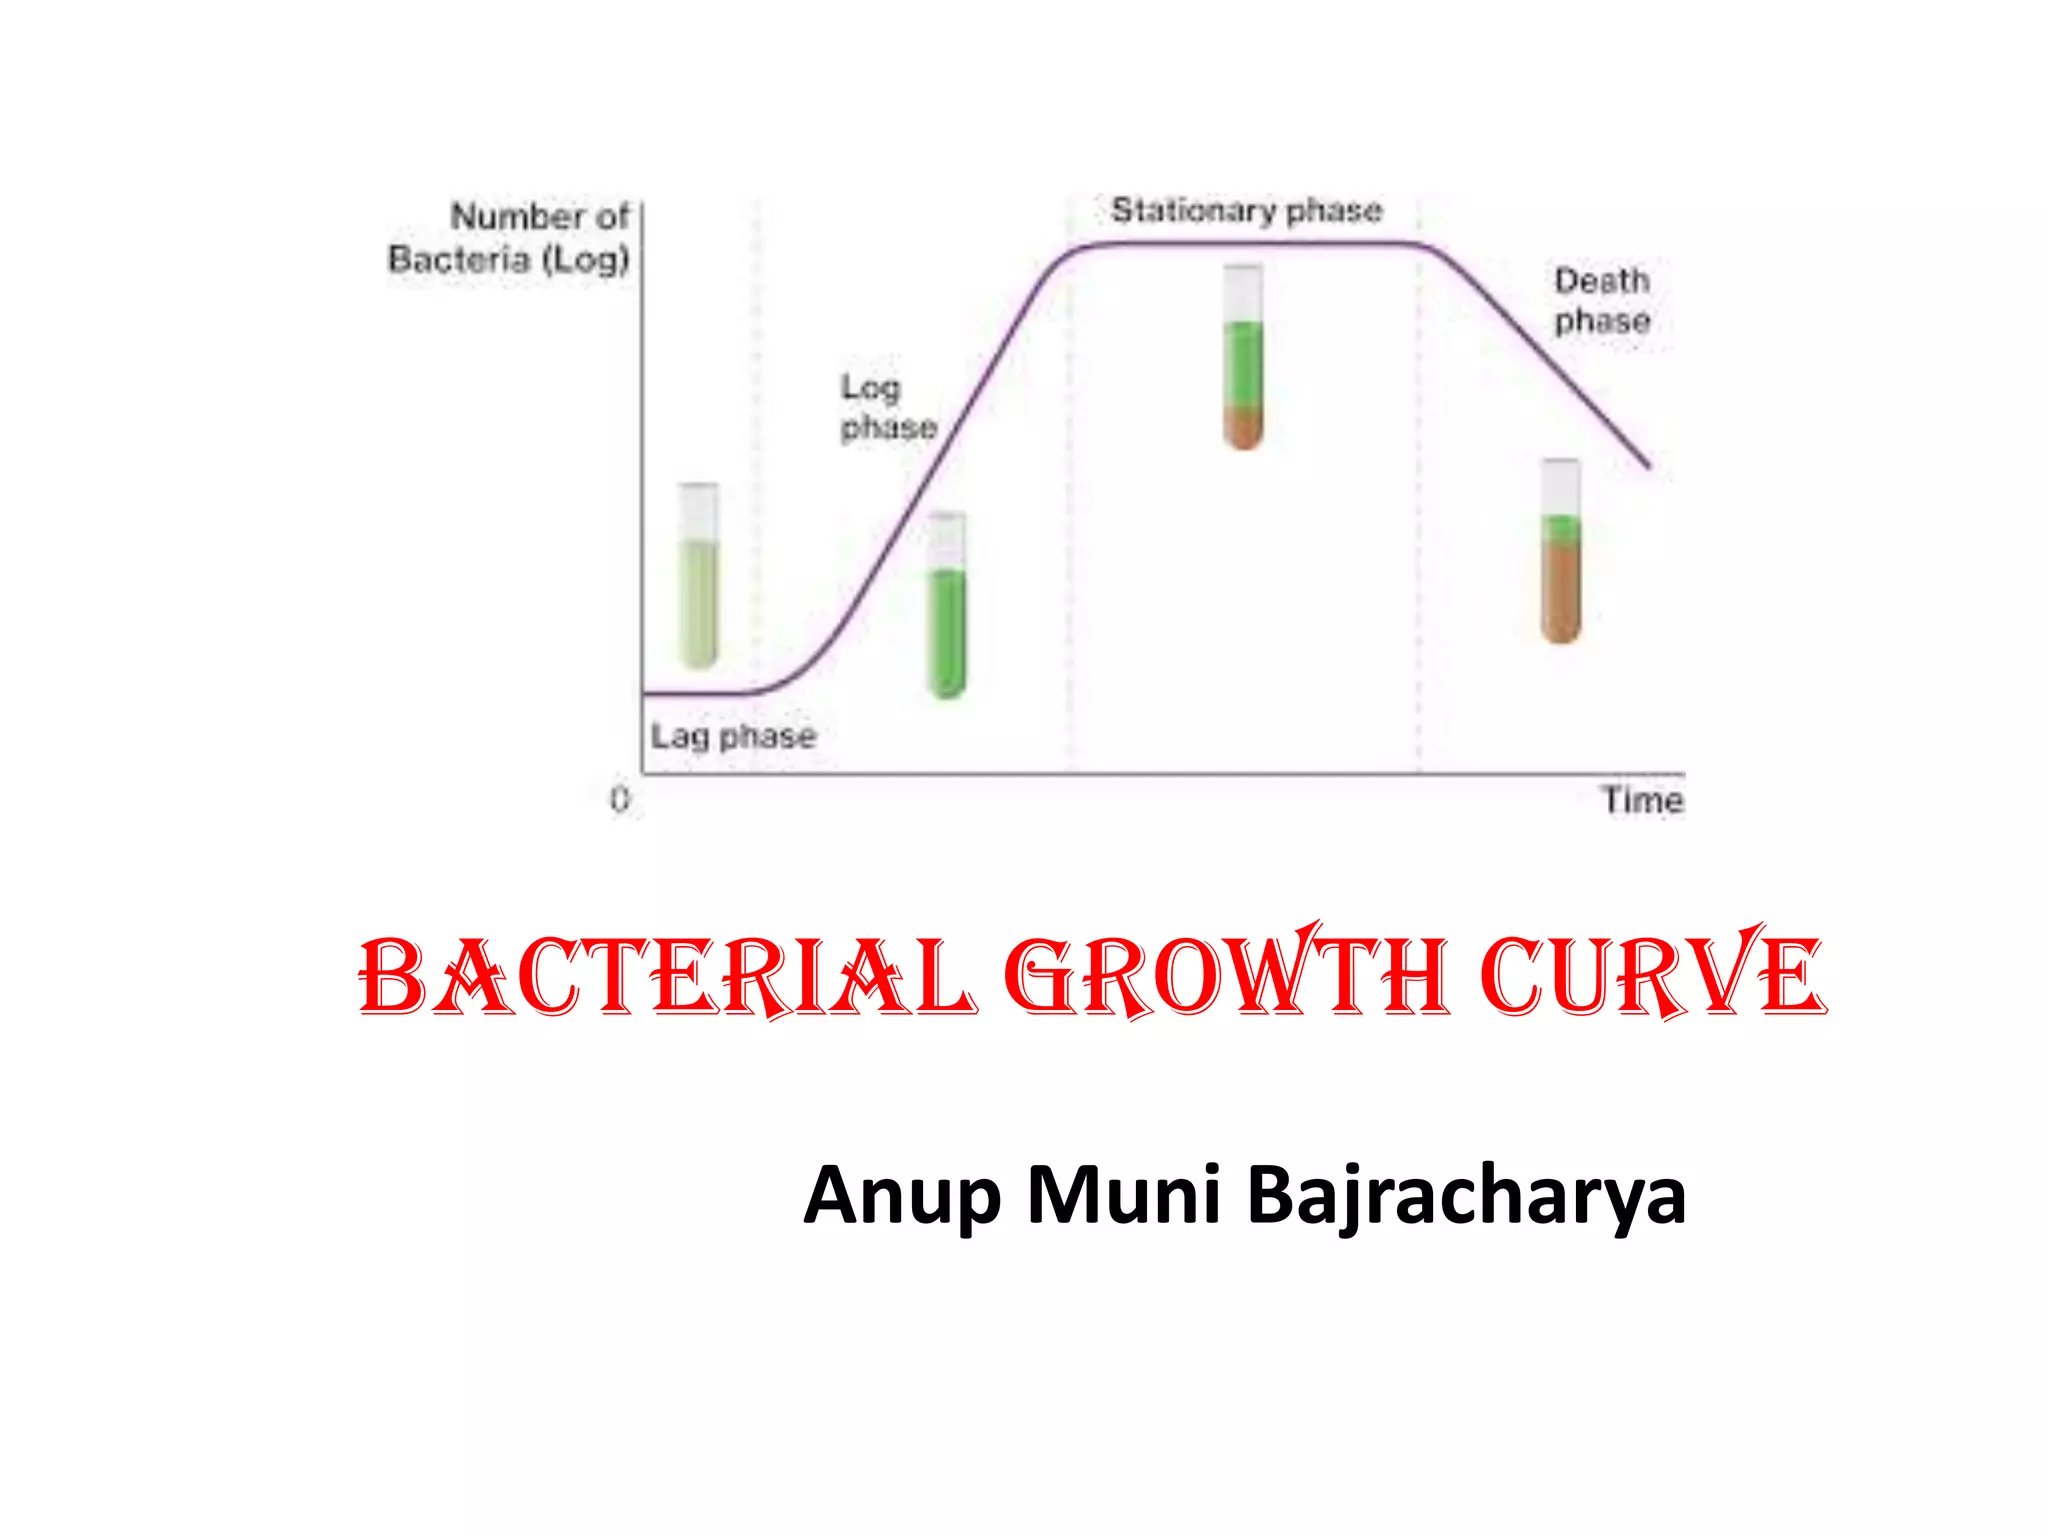
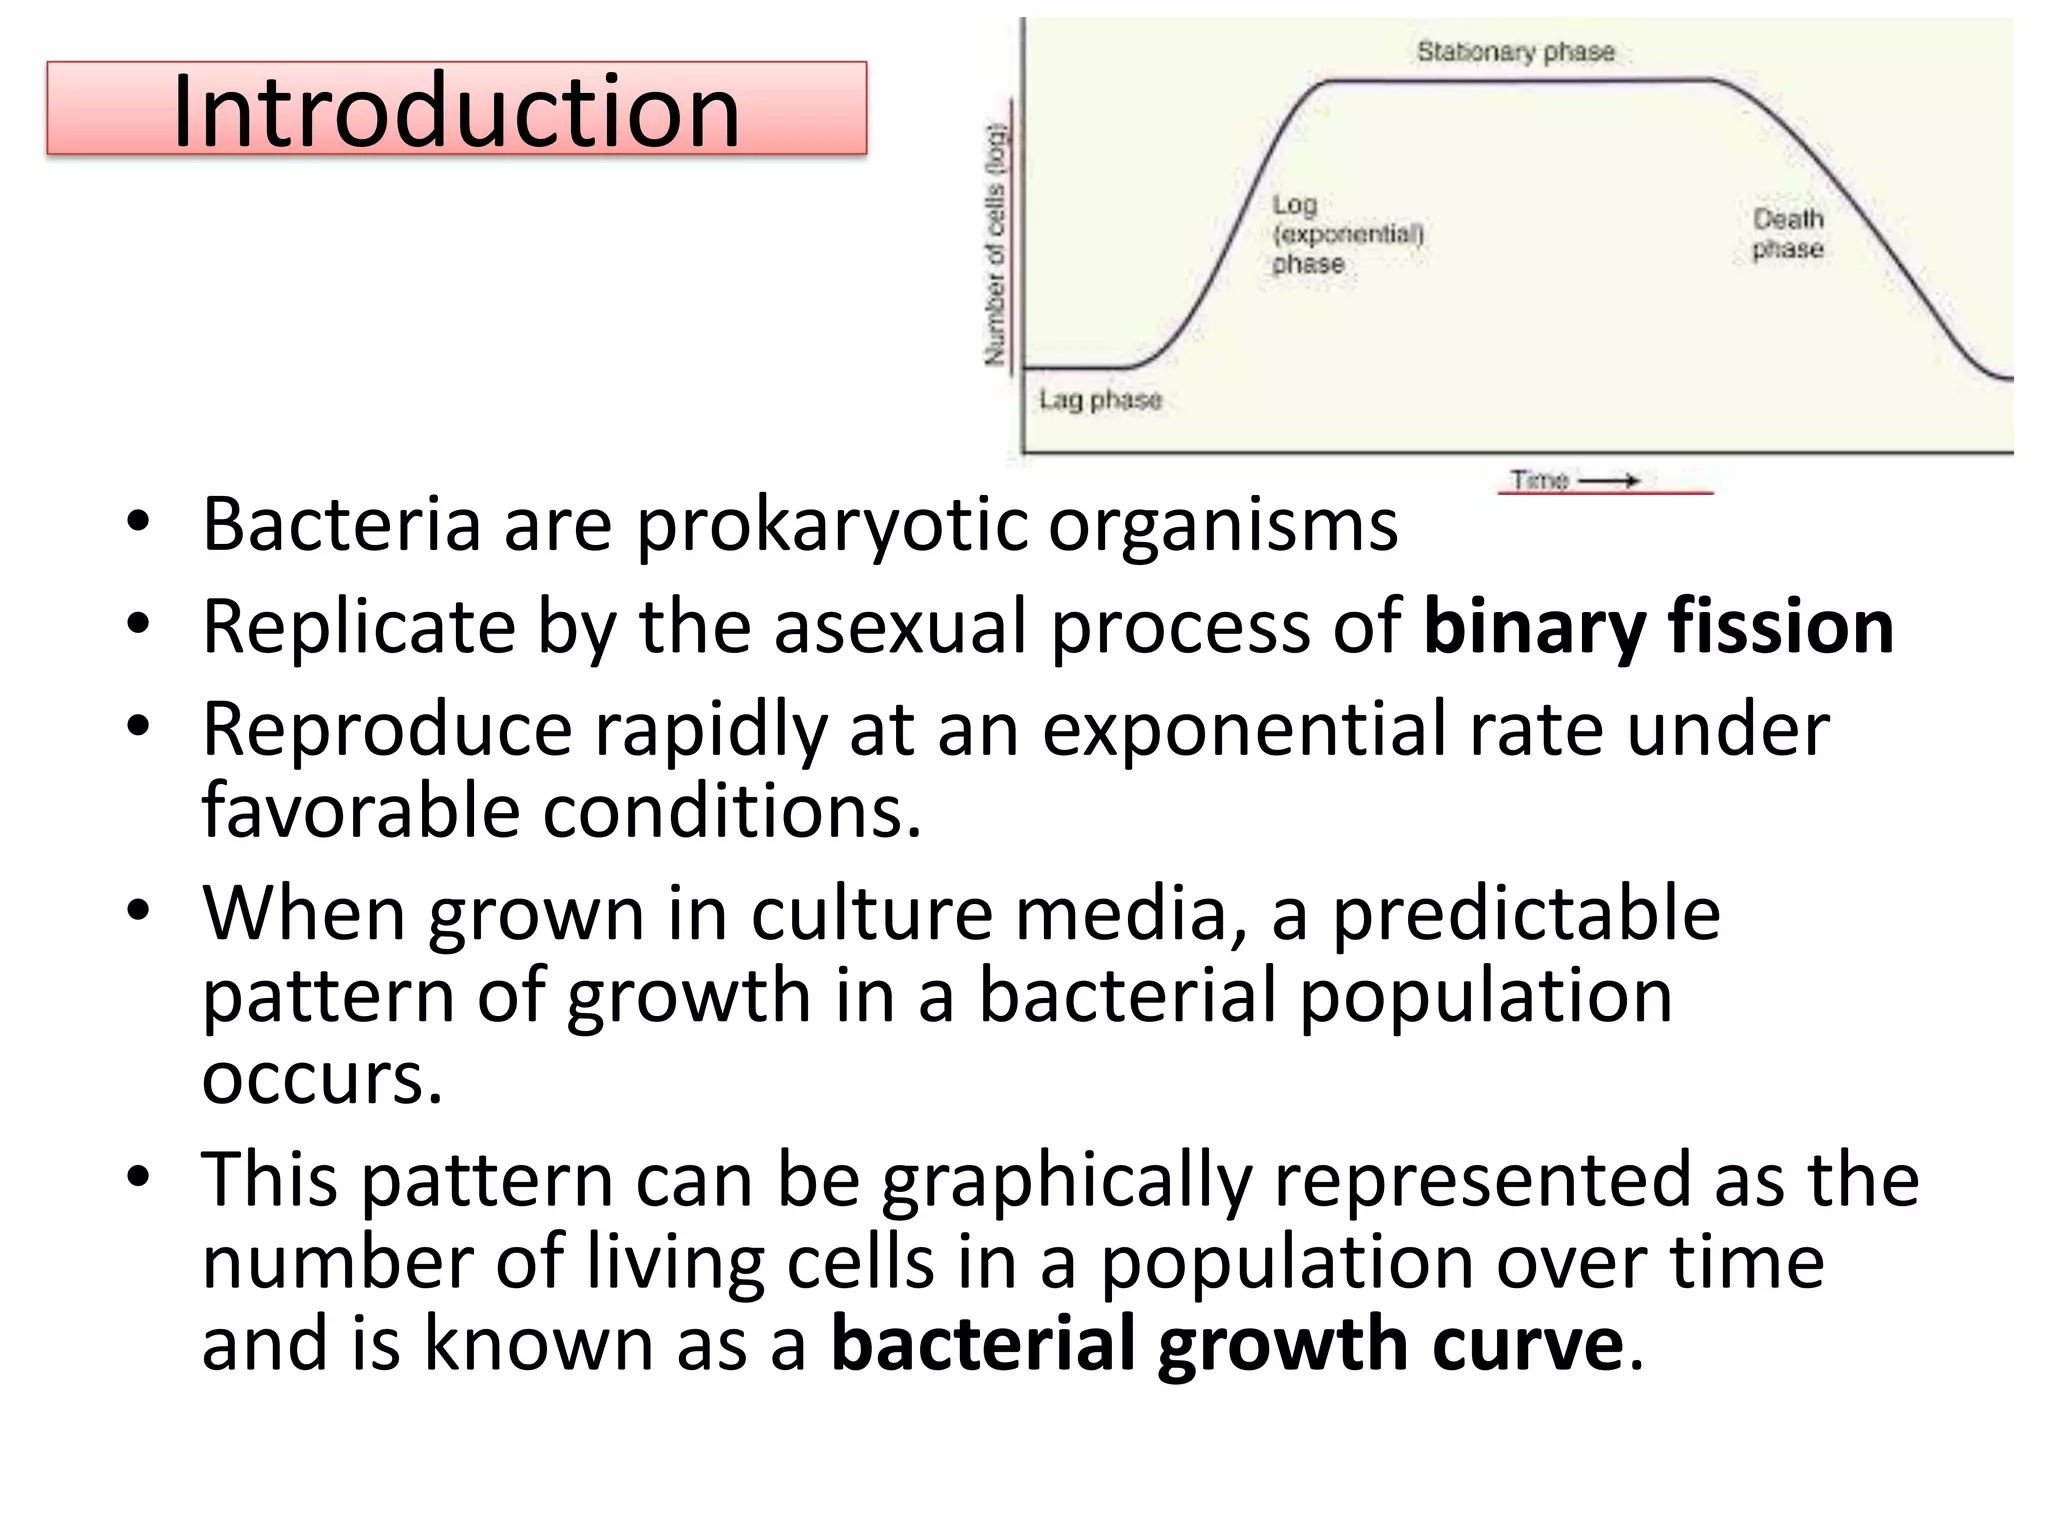
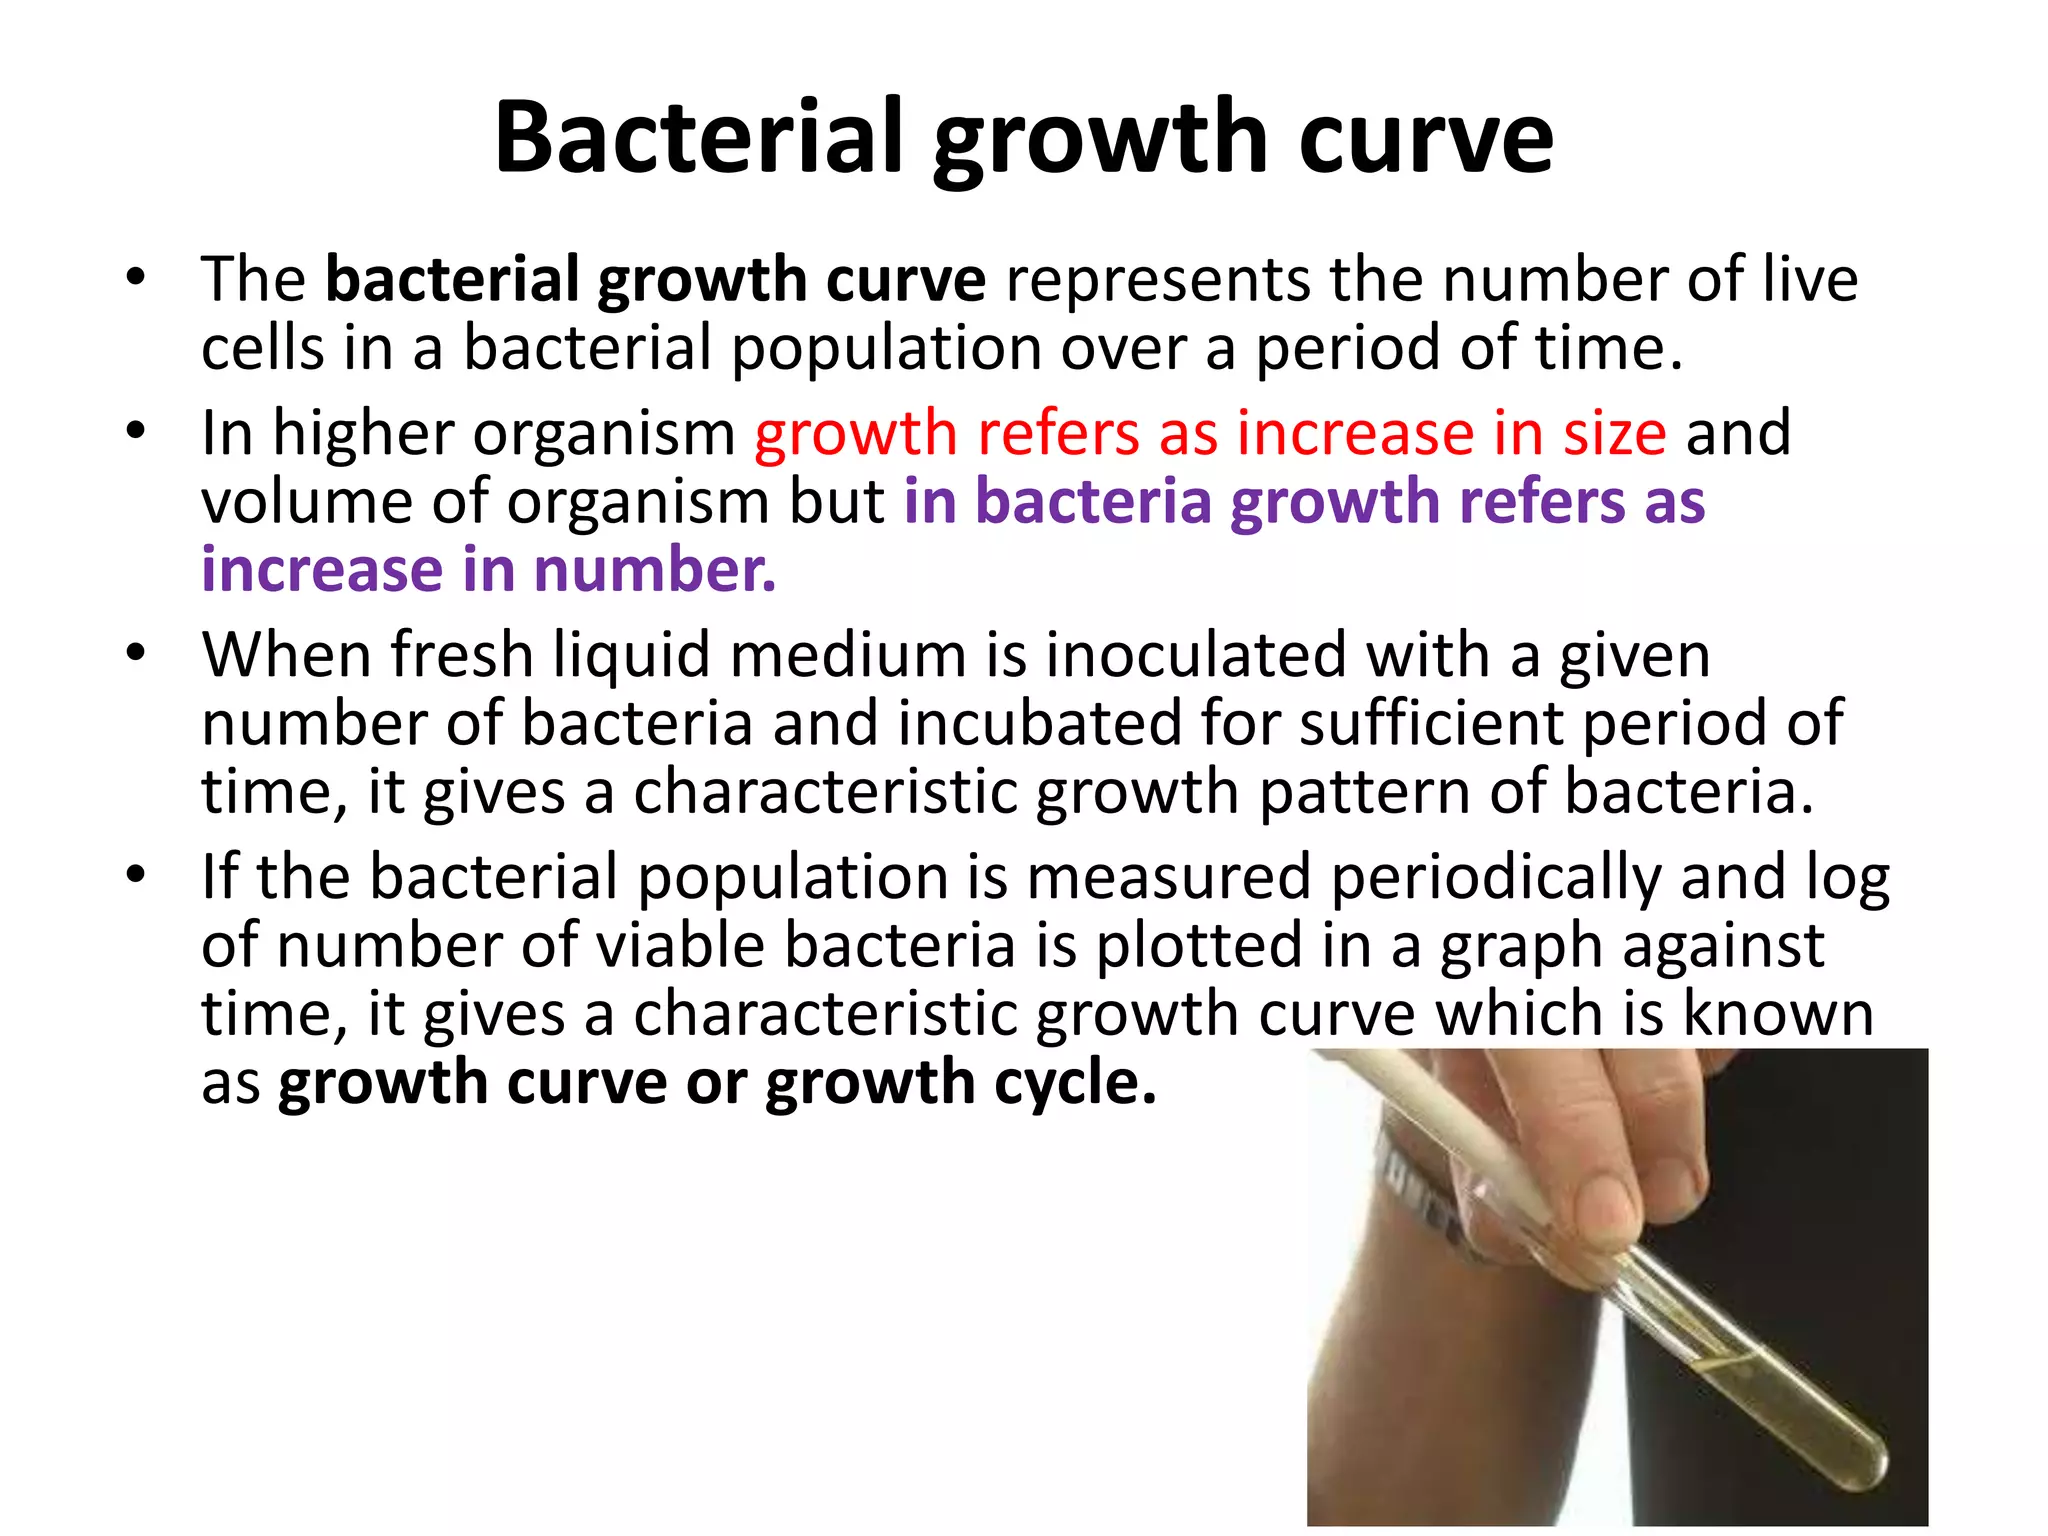
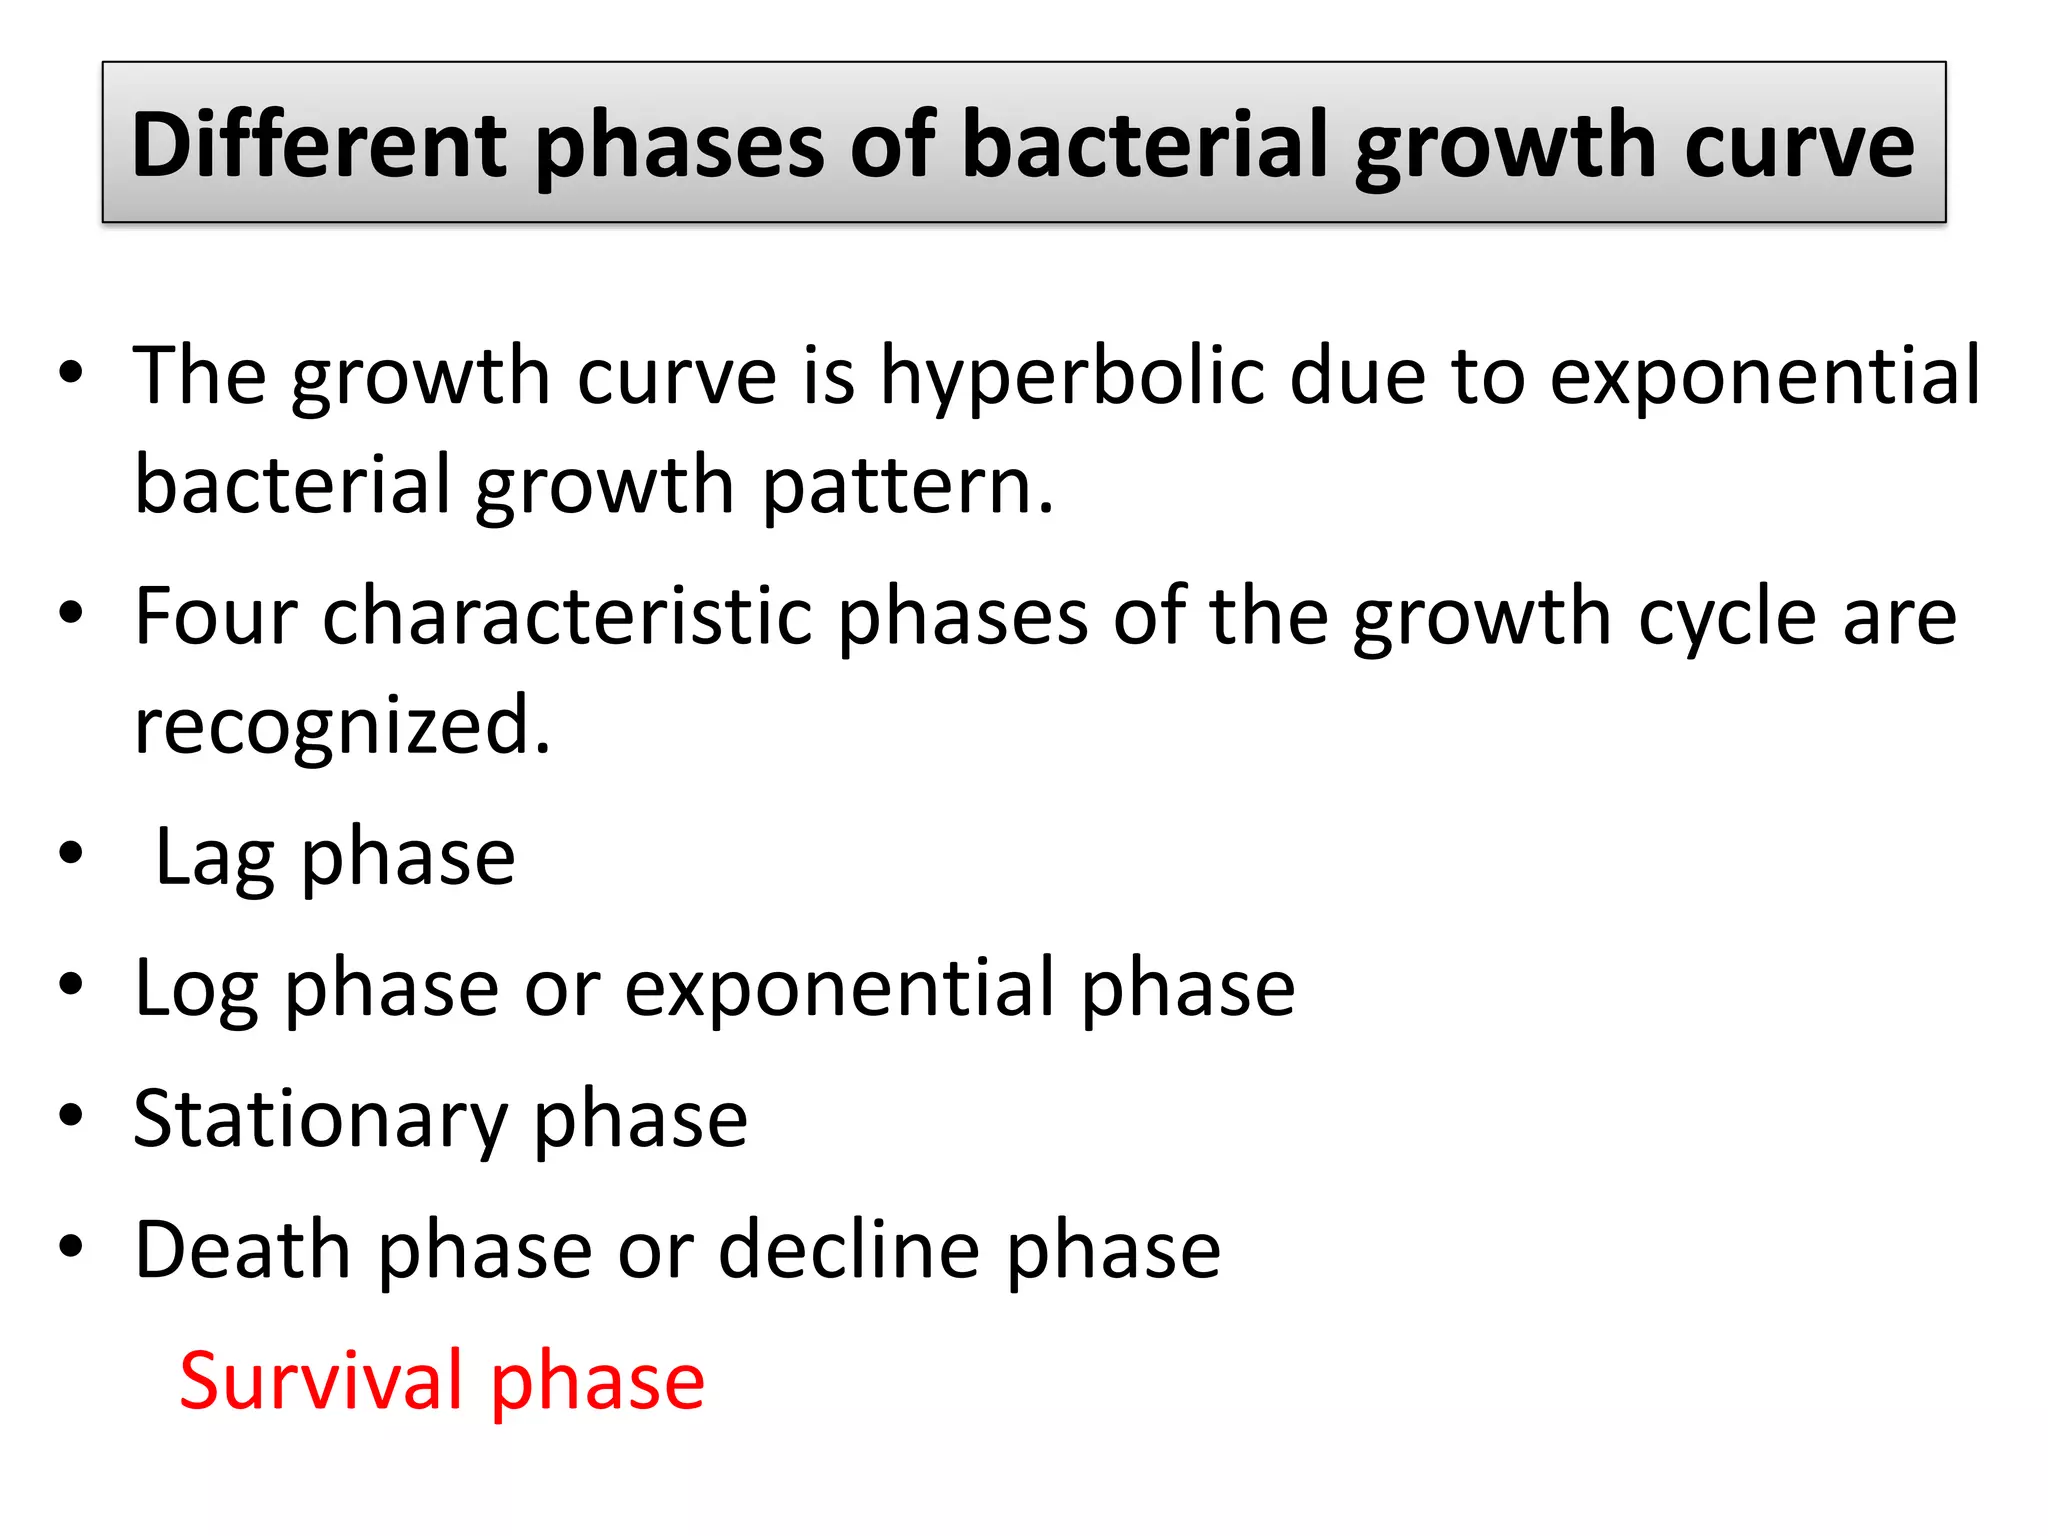
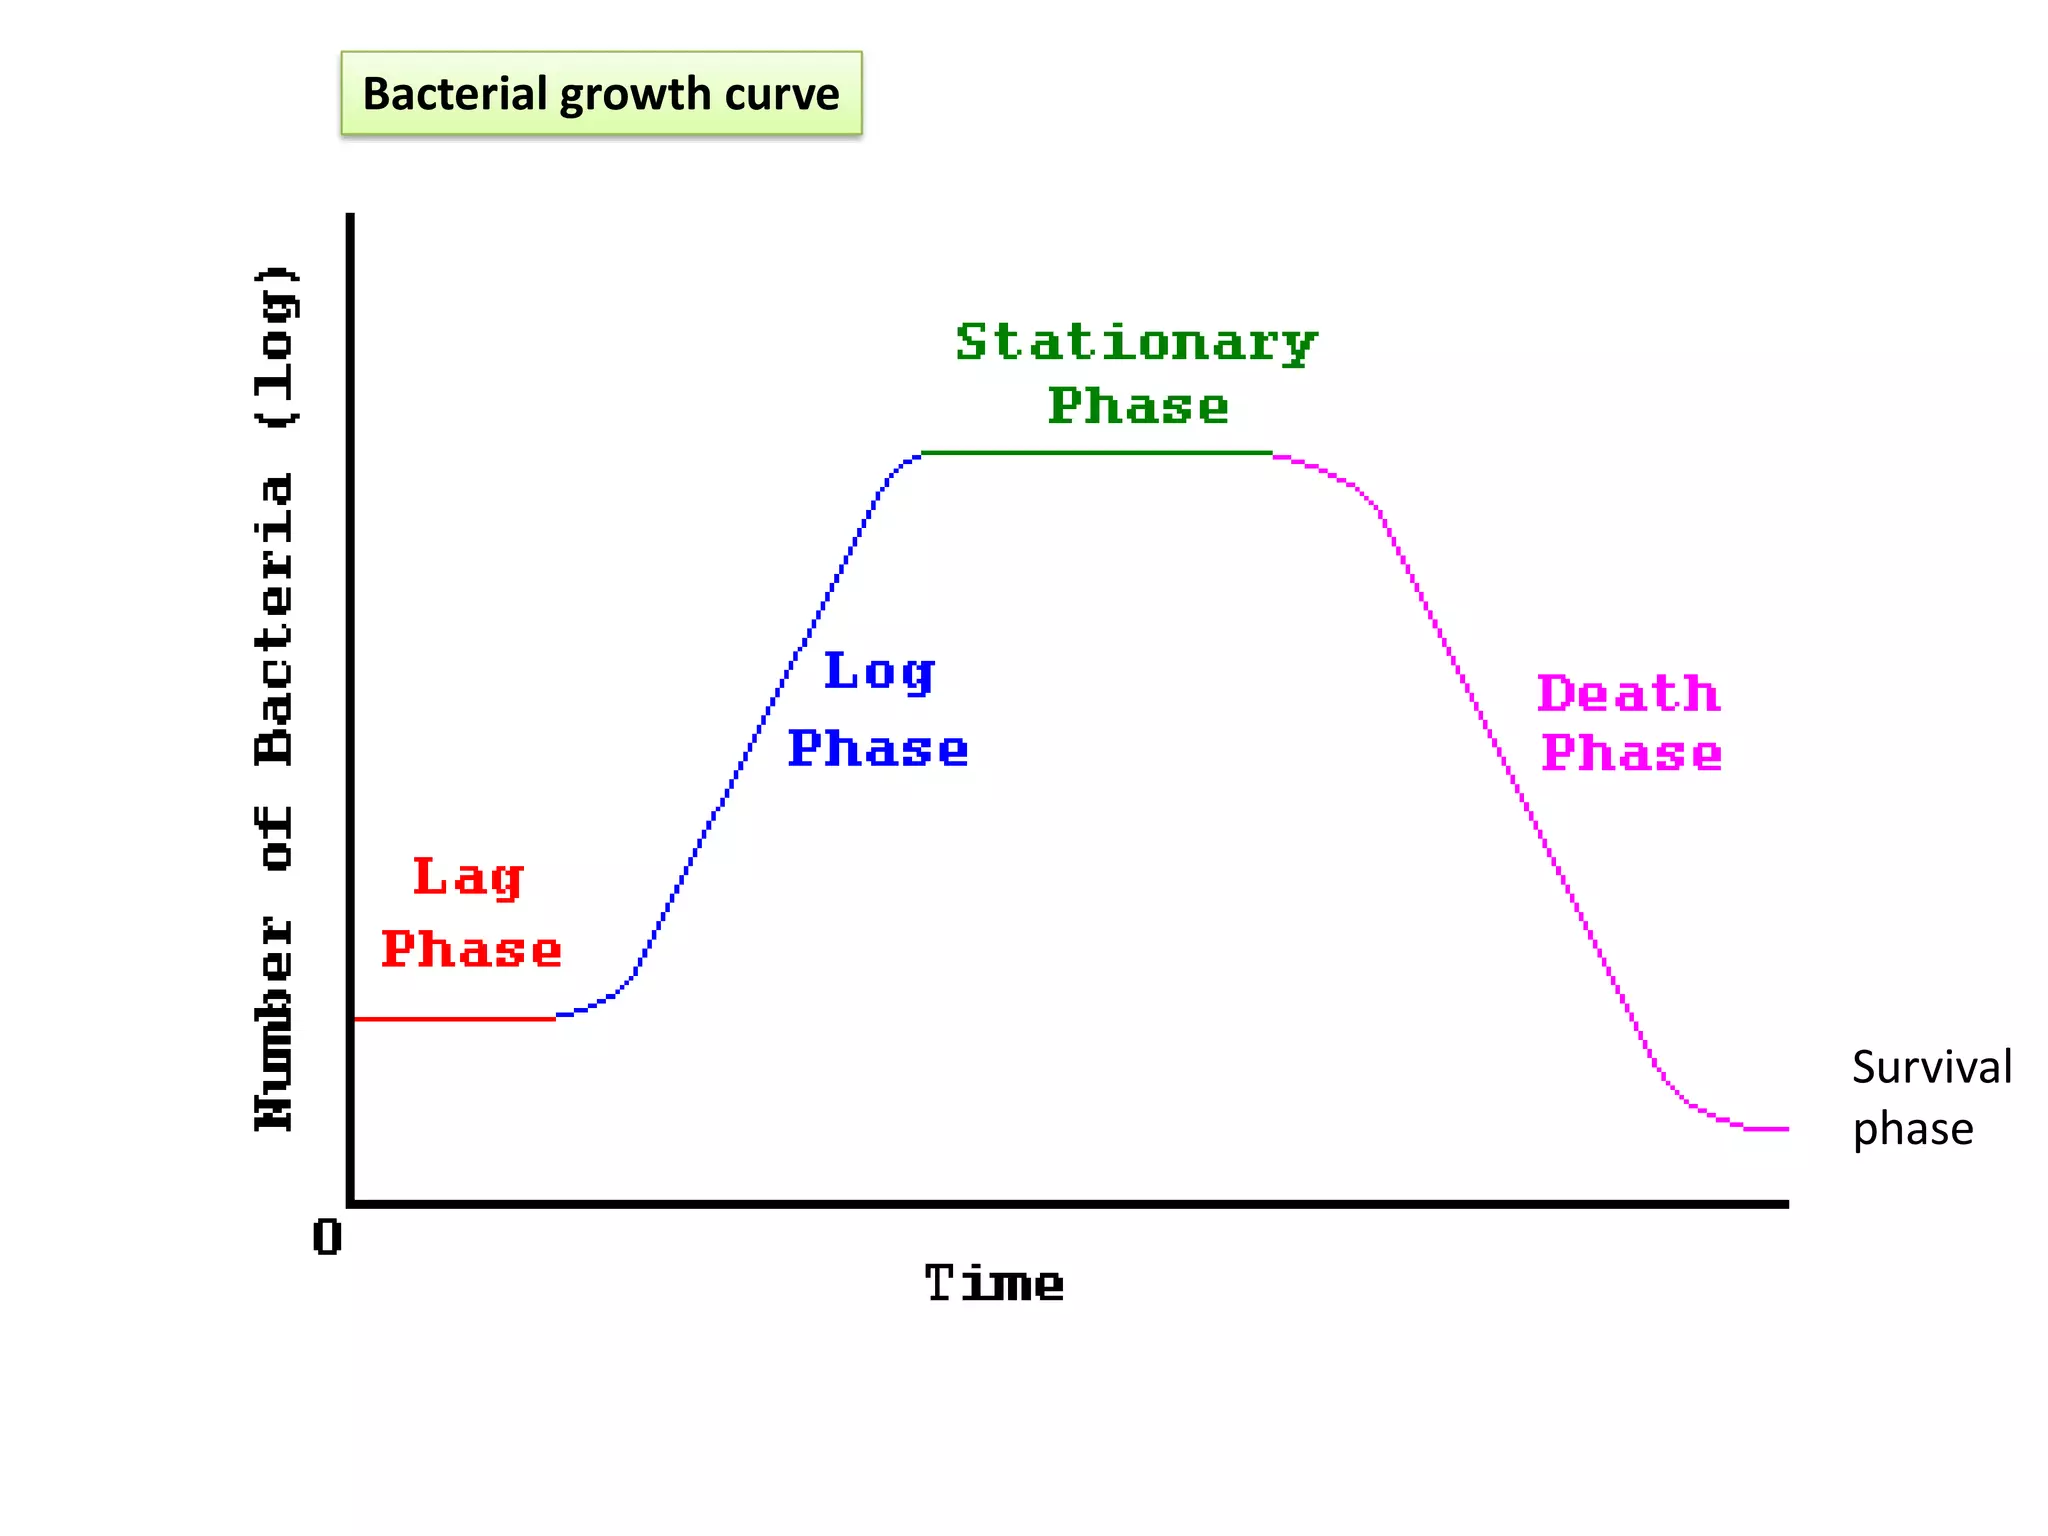
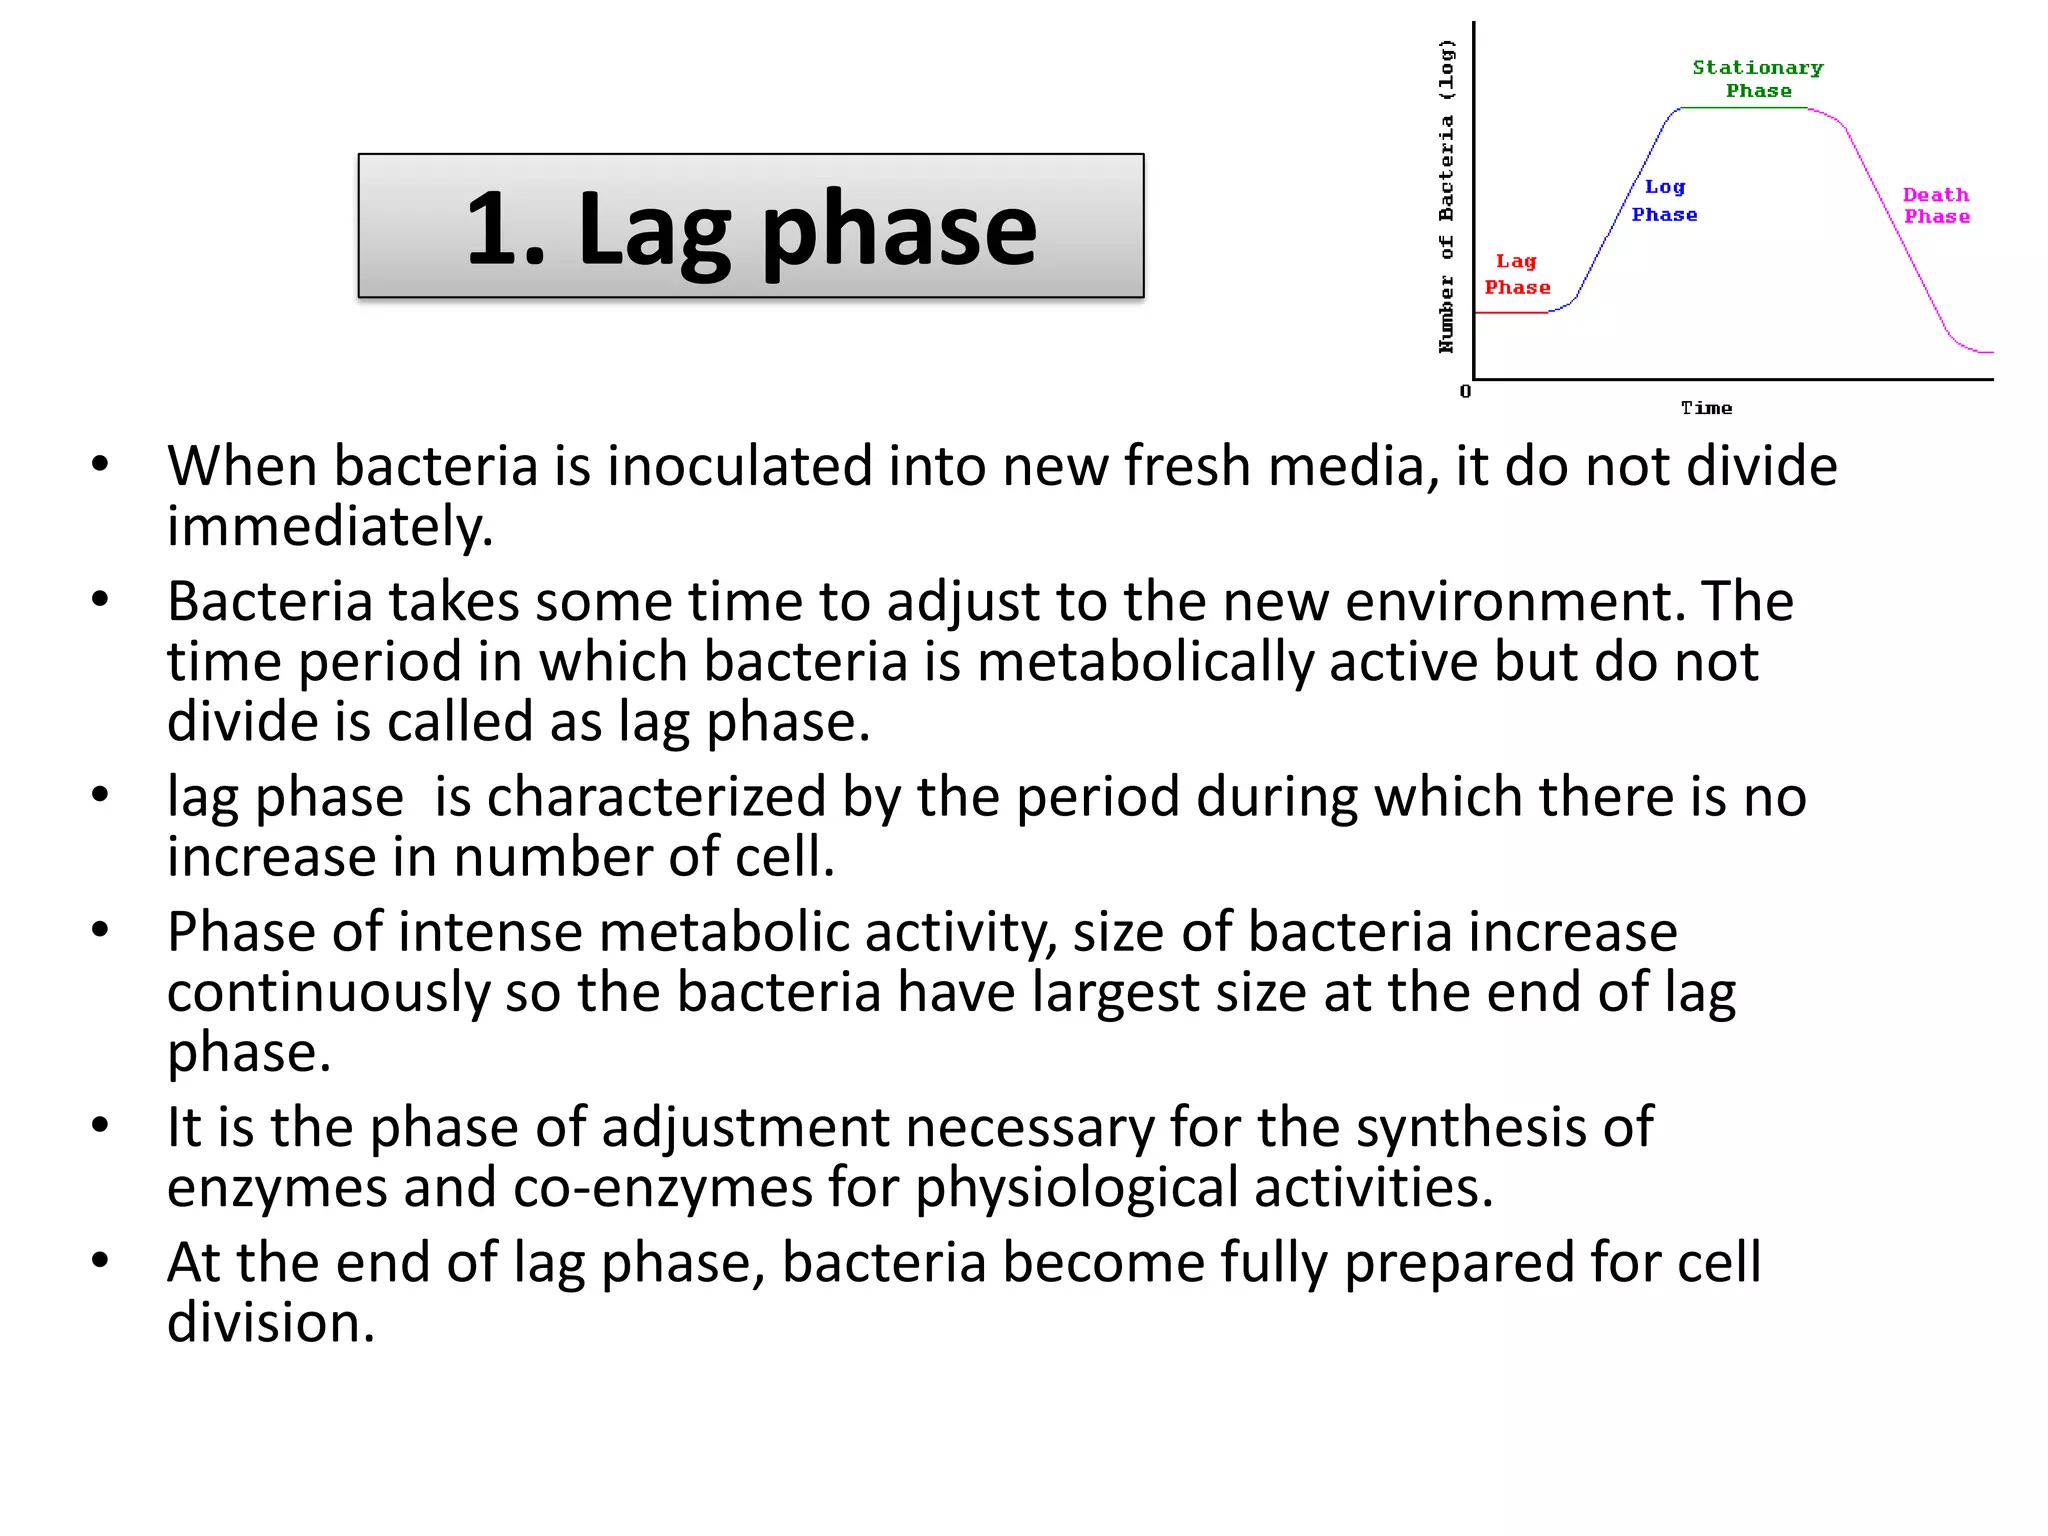
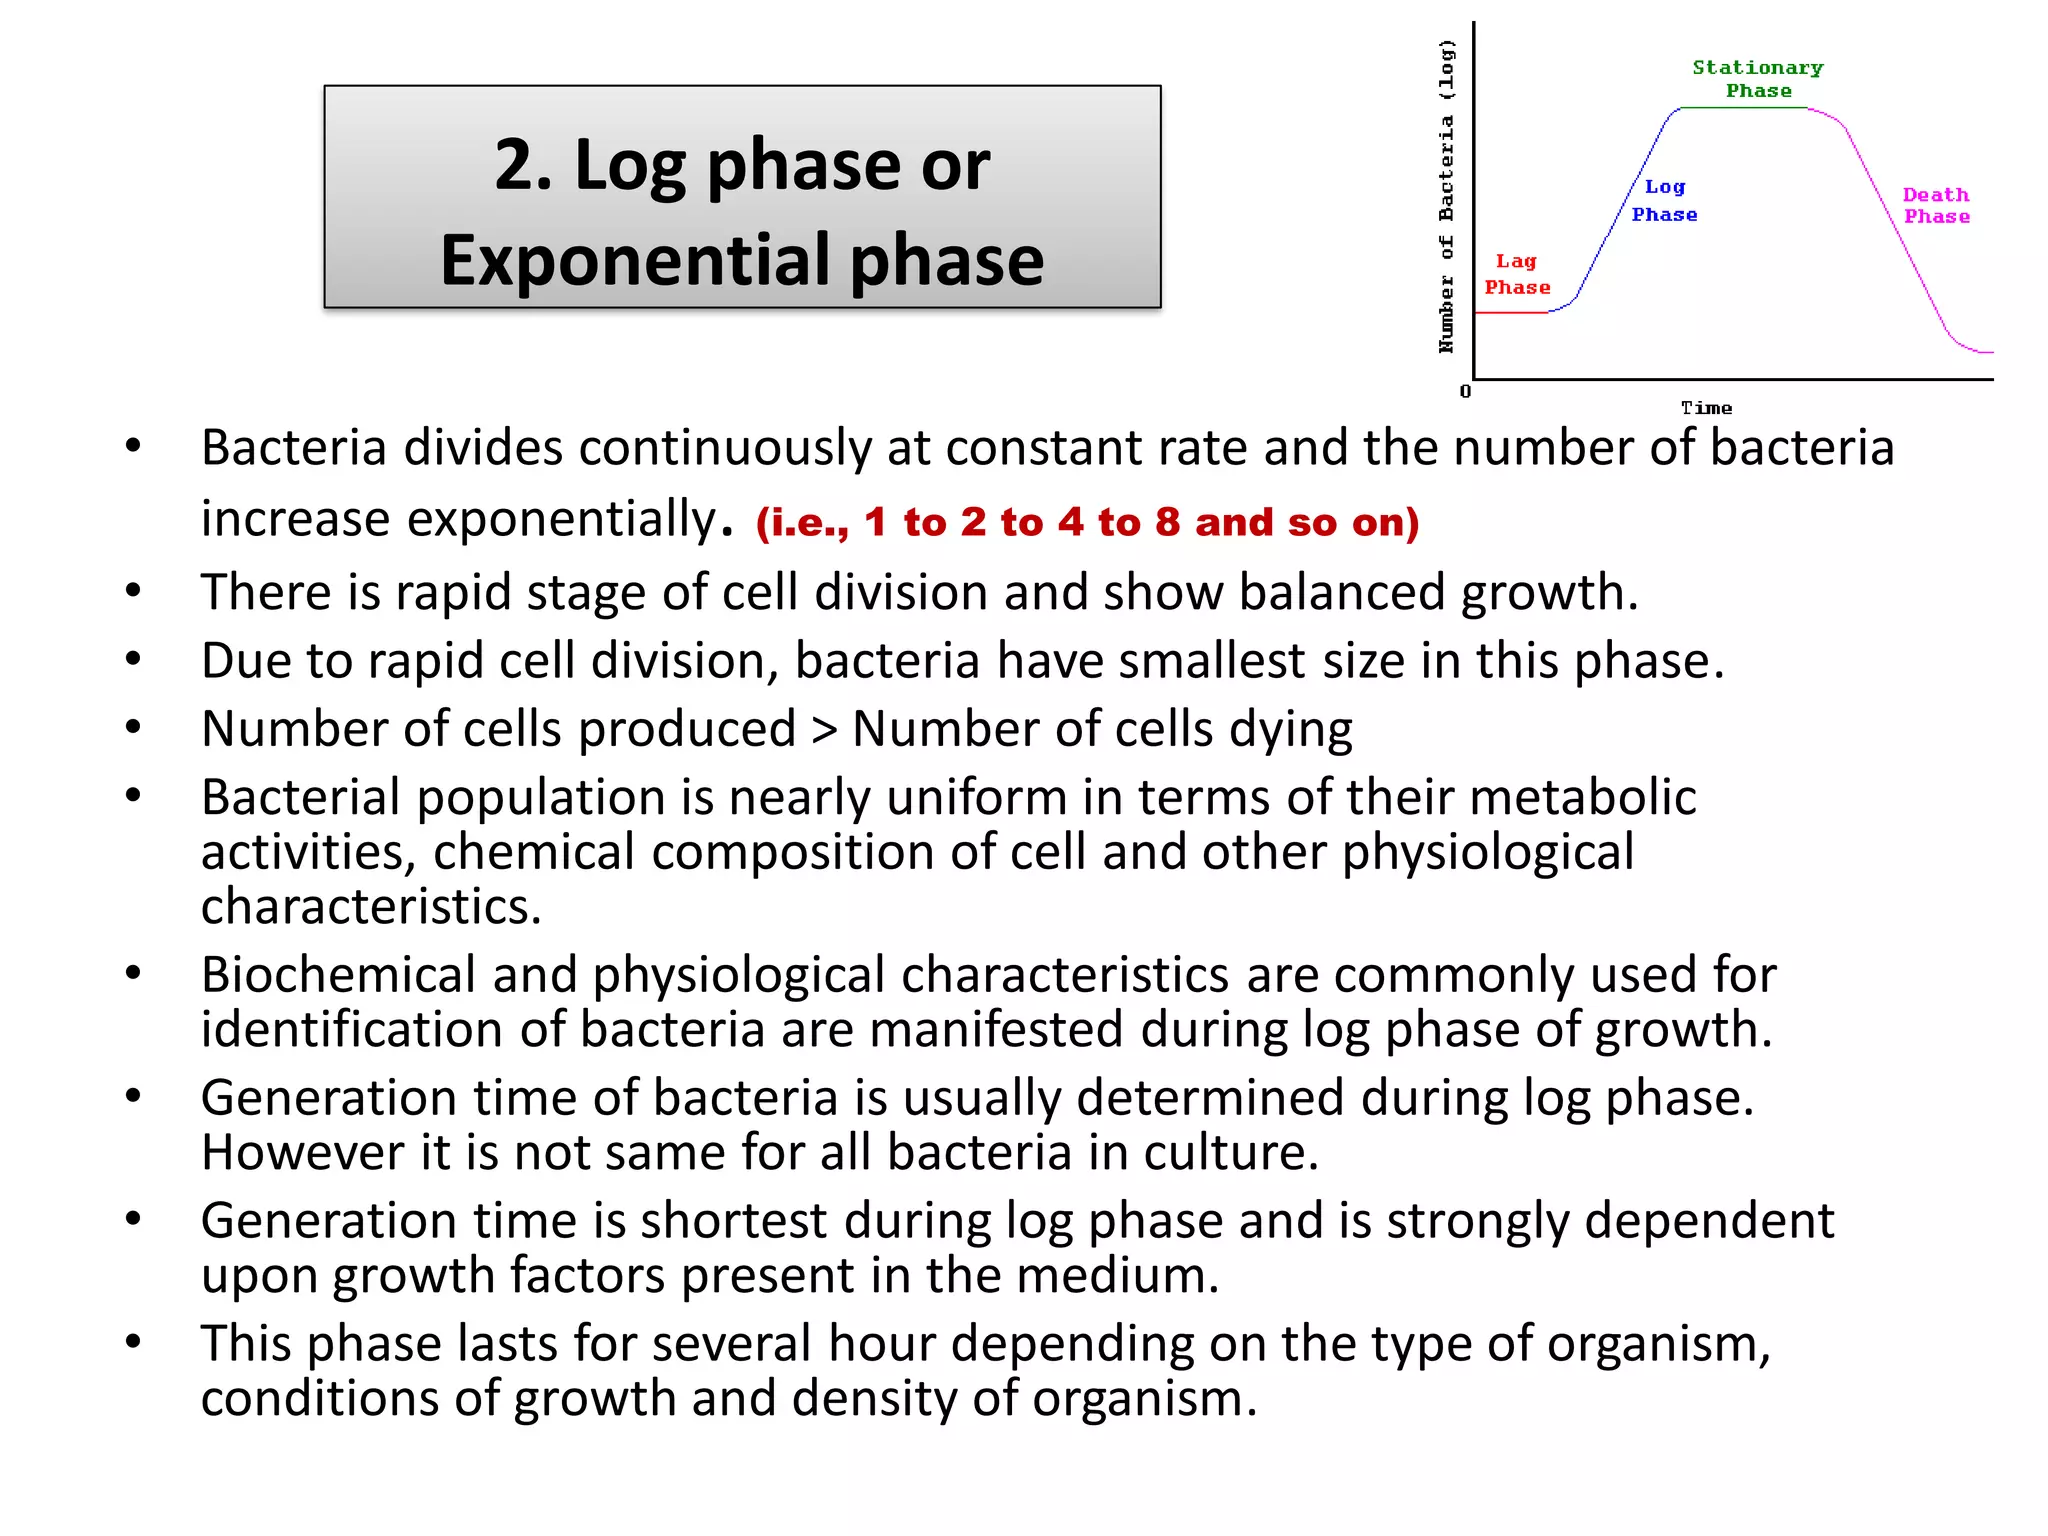
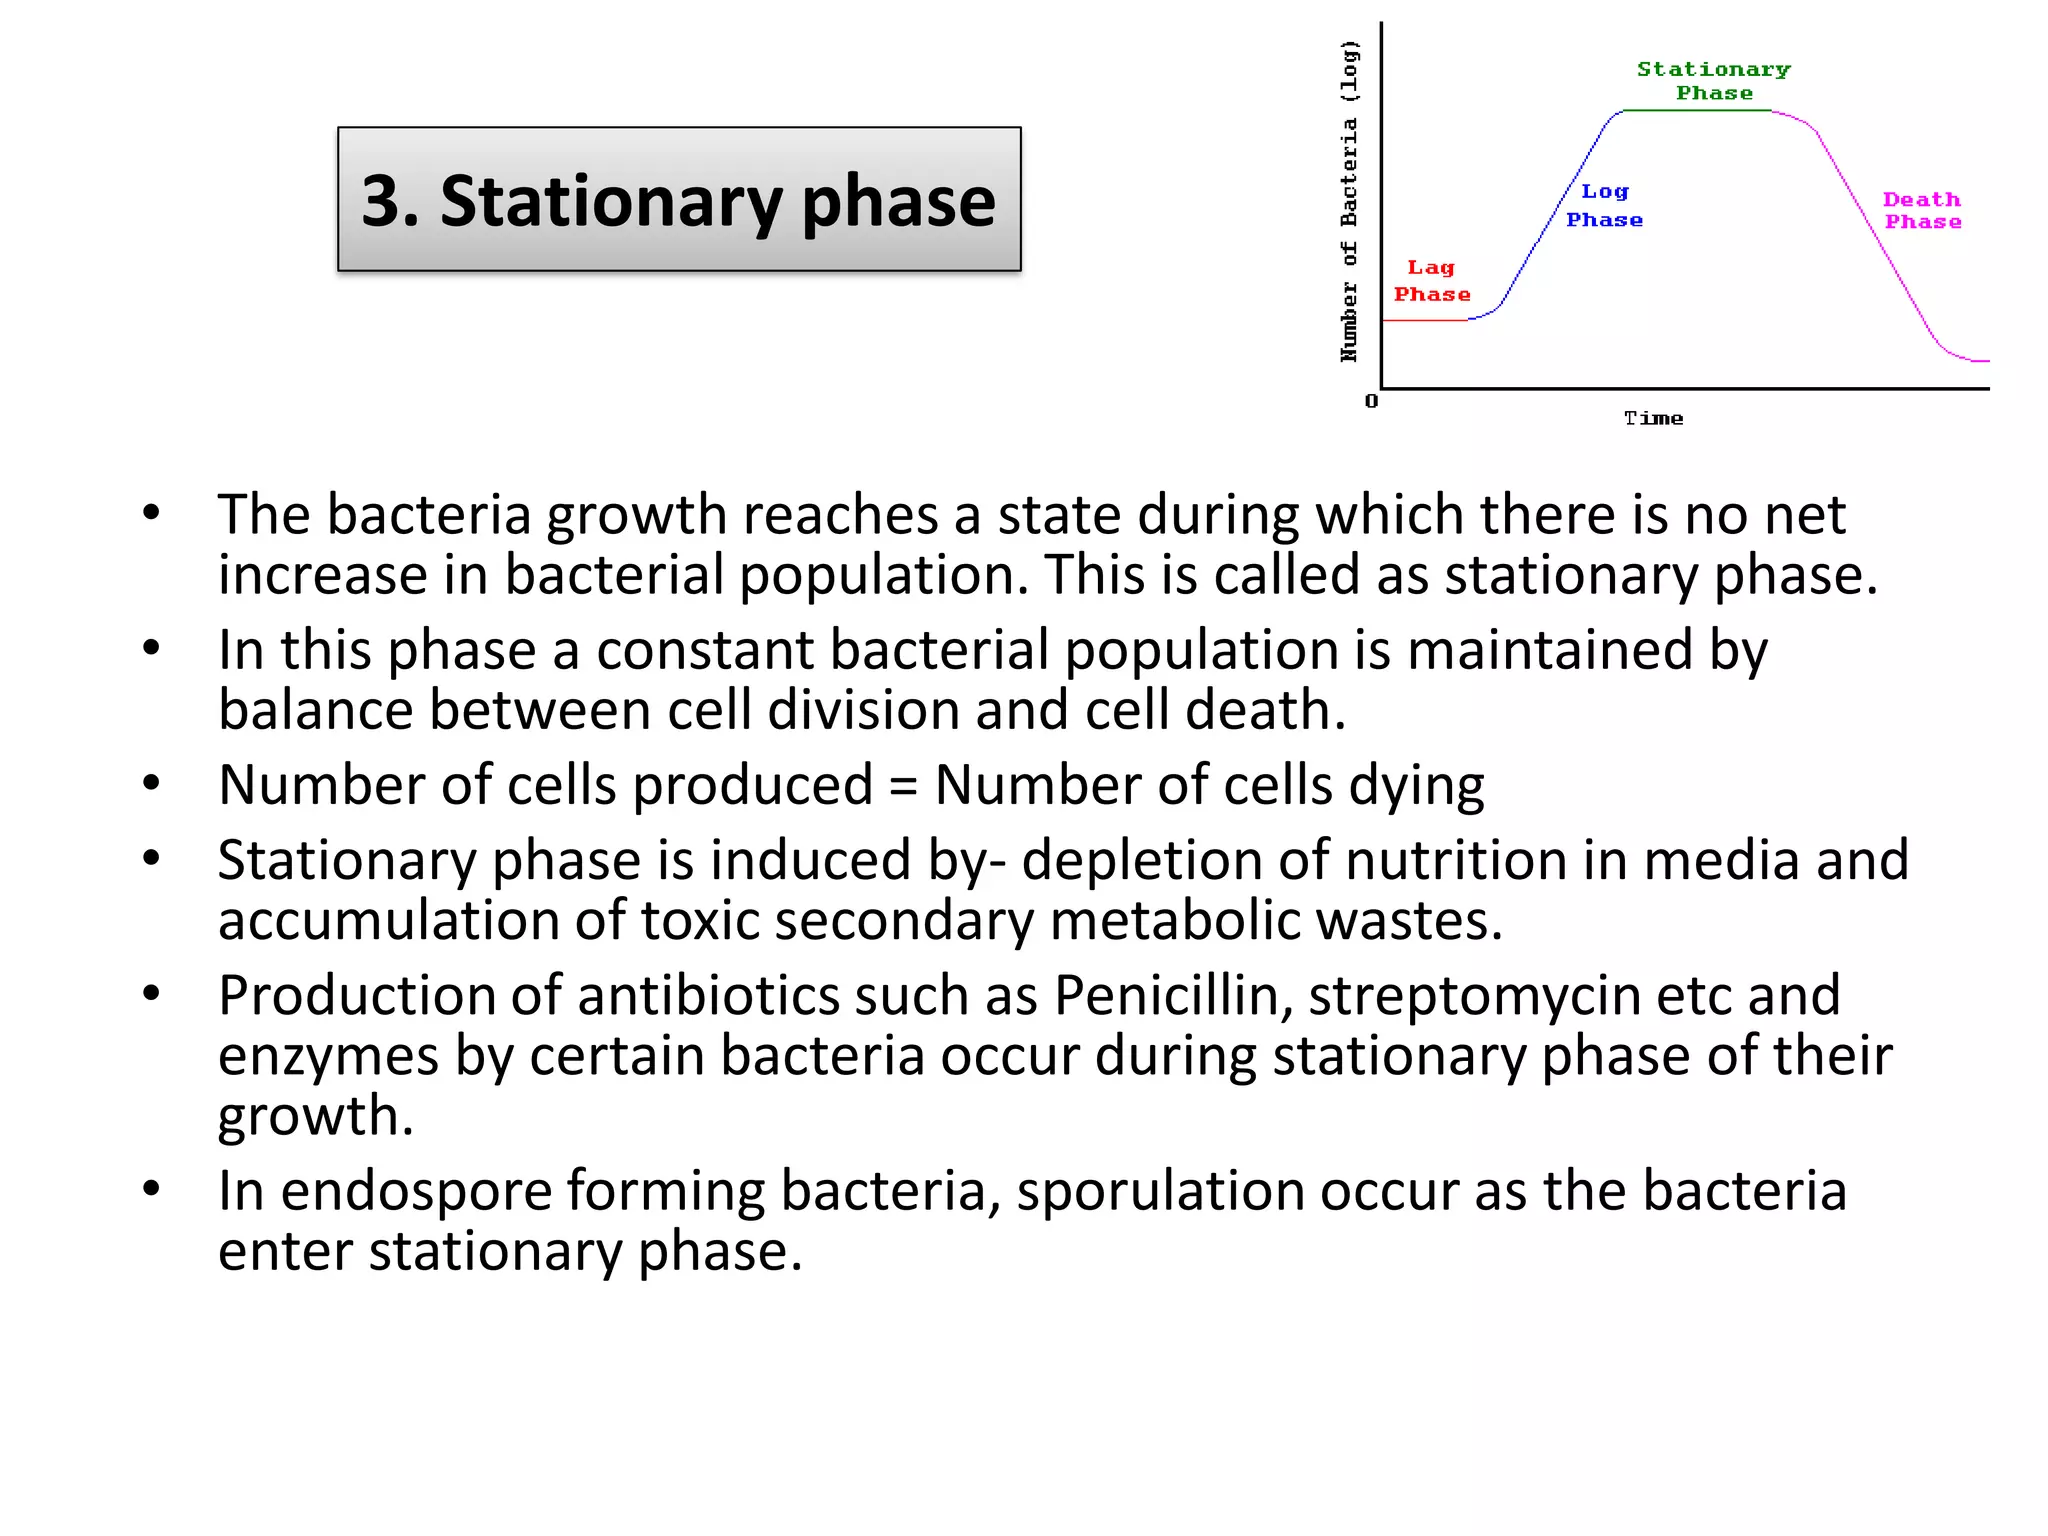
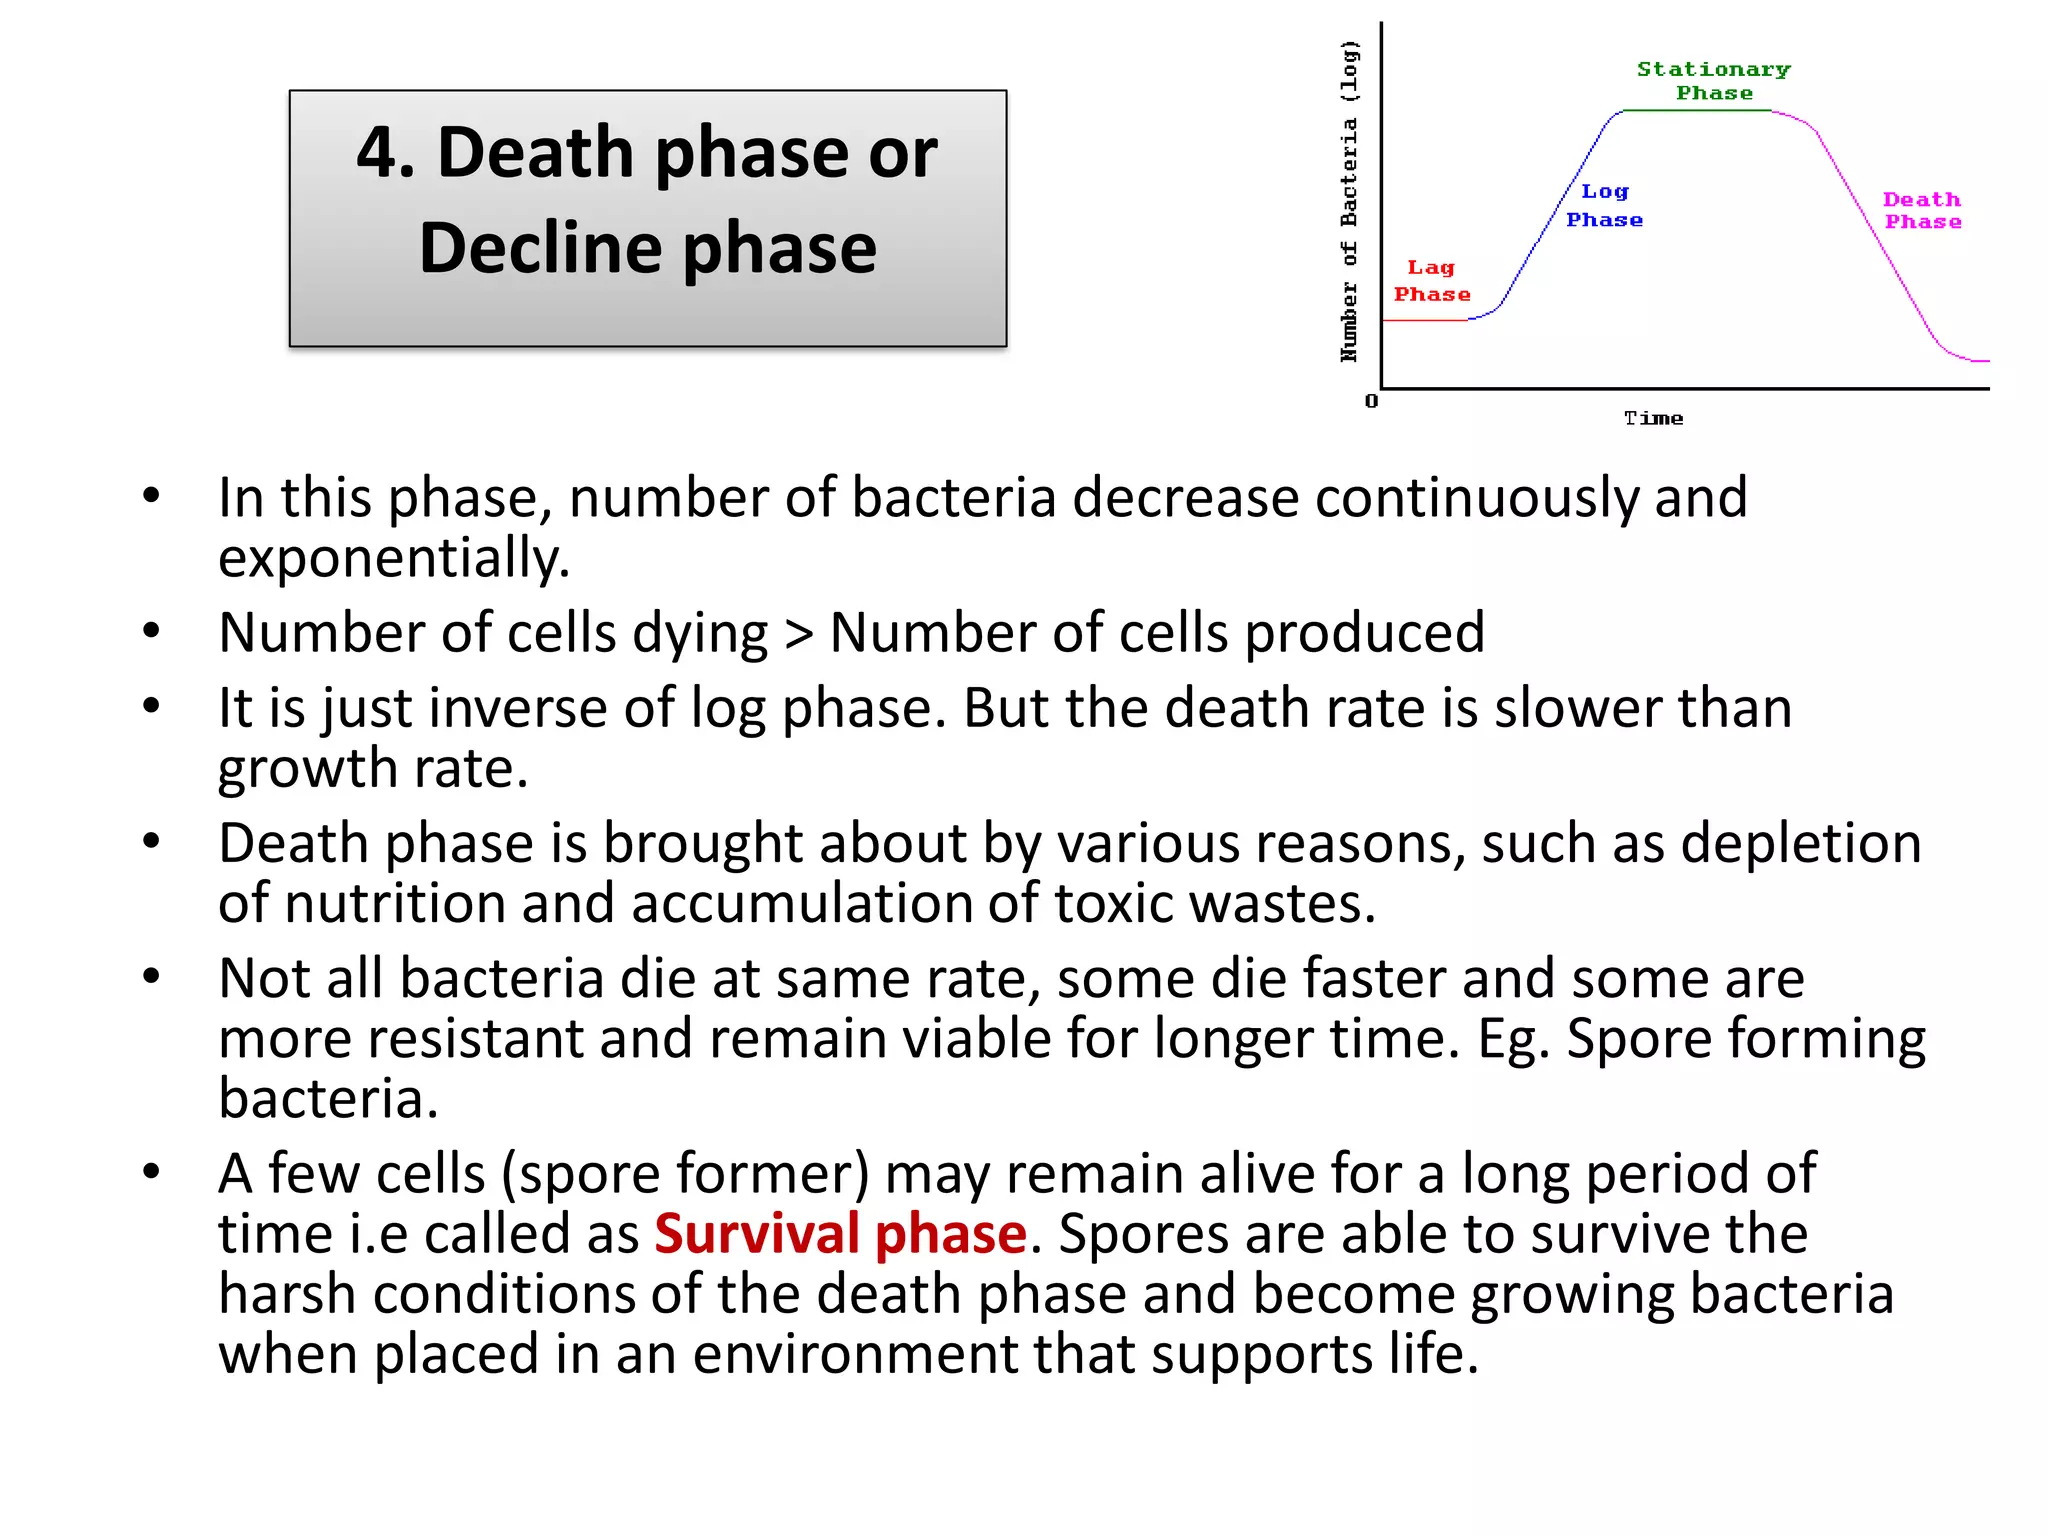
Bacterial growth curve consists of four phases:
1. Lag phase where bacteria adjust to new environment and do not divide.
2. Exponential or log phase where bacteria divide rapidly and population increases exponentially.
3. Stationary phase where growth rate equals death rate resulting in constant population size.
4. Decline or death phase where population decreases as number of dying cells exceeds reproducing cells due to nutrient depletion and waste accumulation.
2. Introduction
• Bacteria are prokaryotic organisms
• Replicate by the asexual process of binary fission
• Reproduce rapidly at an exponential rate under
favorable conditions.
• When grown in culture media, a predictable
pattern of growth in a bacterial population
occurs.
• This pattern can be graphically represented as the
number of living cells in a population over time
and is known as a bacterial growth curve.
3. • Bacteria require certain conditions for growth,
and these conditions are not the same for all
bacteria.
• Factors such as oxygen, pH, temperature, and
light influence microbial growth.
• Additional factors include osmotic pressure,
atmospheric pressure, and moisture availability.
• A bacterial population's generation time, or time
it takes for a population to double, varies
between species and depends on how well
growth requirements are met.
Introduction
4. Some terms used in bacterial growth curve
• Population growth of bacteria: The
growth is defined as an increase in
number of microbial cell in a population
which can be measured as an increased
cell mass.
• Growth rate is the change in cell number
or cell mass per unit time. So during cell
division all the cellular constituent
doubles.
• The pattern of population increase is
referred to as exponential growth.
Generation time:
The time interval for the formation of
two daughter cell from one is called
generation time or doubling time.
Generation time vary widely among
organism.
Let suppose, No is the initial population of
certain bacteria.
The population of bacteria after 1
generation (N1)= 2 x No
Similarly, after 2nd generation (N2) = 2 x 2 x
No=2^2No
After 3rd generation (N3)= 2^3 x No
After ‘n’ generation (Nn)= 2^n x No
Nn= 2^nNo— this equation can be
expressed in terms of generation time
No= initial population
Nt= population after time ‘t’
n= number of generation after time ‘t’
Therefore, Nt= No x 2^n
Taking log on both side
Log Nt = log No + nlog2
n= (logNt- logNo)/log2
n= (logNt-logNo)/0.301. this is the
required equation to calculate number
of generation.
5. Bacterial growth curve obtained in laboratory optimal conditions
• In nature, bacteria do not
experience perfect environmental
conditions for growth.
• As such, the species that populate
an environment change over time.
In a laboratory, however, optimal conditions
can be met by growing bacteria in a closed
culture environment.
It is under these conditions that the curve
pattern of bacterial growth can be observed.
6. Bacterial growth curve
• The bacterial growth curve represents the number of live
cells in a bacterial population over a period of time.
• In higher organism growth refers as increase in size and
volume of organism but in bacteria growth refers as
increase in number.
• When fresh liquid medium is inoculated with a given
number of bacteria and incubated for sufficient period of
time, it gives a characteristic growth pattern of bacteria.
• If the bacterial population is measured periodically and log
of number of viable bacteria is plotted in a graph against
time, it gives a characteristic growth curve which is known
as growth curve or growth cycle.
7. Different phases of bacterial growth curve
• The growth curve is hyperbolic due to exponential
bacterial growth pattern.
• Four characteristic phases of the growth cycle are
recognized.
• Lag phase
• Log phase or exponential phase
• Stationary phase
• Death phase or decline phase
Survival phase
9. 1. Lag phase
• When bacteria is inoculated into new fresh media, it do not divide
immediately.
• Bacteria takes some time to adjust to the new environment. The
time period in which bacteria is metabolically active but do not
divide is called as lag phase.
• lag phase is characterized by the period during which there is no
increase in number of cell.
• Phase of intense metabolic activity, size of bacteria increase
continuously so the bacteria have largest size at the end of lag
phase.
• It is the phase of adjustment necessary for the synthesis of
enzymes and co-enzymes for physiological activities.
• At the end of lag phase, bacteria become fully prepared for cell
division.
10. • The length of the lag phase is apparently dependent on a wide
variety of factors
• the size of the inoculum;
• time necessary to recover from physical damage or shock in the
transfer;
• time required for synthesis of essential coenzymes or division
factors; and
• time required for synthesis of new (inducible) enzymes that are
necessary to metabolize the substrates present in the medium.
• Duration of lag phase varies according to conditions and species of
bacteria.
– If the culture organism is taken from old culture, the duration will be
longer but if the culture is fresh, duration is short.
– Similarly if the culture media is different from the previous culture
then duration is long because bacteria takes some more time to adjust
in the new media.
1. Lag phase
11. 2. Log phase or
Exponential phase
• Bacteria divides continuously at constant rate and the number of bacteria
increase exponentially. (i.e., 1 to 2 to 4 to 8 and so on)
• There is rapid stage of cell division and show balanced growth.
• Due to rapid cell division, bacteria have smallest size in this phase.
• Number of cells produced > Number of cells dying
• Bacterial population is nearly uniform in terms of their metabolic
activities, chemical composition of cell and other physiological
characteristics.
• Biochemical and physiological characteristics are commonly used for
identification of bacteria are manifested during log phase of growth.
• Generation time of bacteria is usually determined during log phase.
However it is not same for all bacteria in culture.
• Generation time is shortest during log phase and is strongly dependent
upon growth factors present in the medium.
• This phase lasts for several hour depending on the type of organism,
conditions of growth and density of organism.
12. 3. Stationary phase
• The bacteria growth reaches a state during which there is no net
increase in bacterial population. This is called as stationary phase.
• In this phase a constant bacterial population is maintained by
balance between cell division and cell death.
• Number of cells produced = Number of cells dying
• Stationary phase is induced by- depletion of nutrition in media and
accumulation of toxic secondary metabolic wastes.
• Production of antibiotics such as Penicillin, streptomycin etc and
enzymes by certain bacteria occur during stationary phase of their
growth.
• In endospore forming bacteria, sporulation occur as the bacteria
enter stationary phase.
13. 4. Death phase or
Decline phase
• In this phase, number of bacteria decrease continuously and
exponentially.
• Number of cells dying > Number of cells produced
• It is just inverse of log phase. But the death rate is slower than
growth rate.
• Death phase is brought about by various reasons, such as depletion
of nutrition and accumulation of toxic wastes.
• Not all bacteria die at same rate, some die faster and some are
more resistant and remain viable for longer time. Eg. Spore forming
bacteria.
• A few cells (spore former) may remain alive for a long period of
time i.e called as Survival phase. Spores are able to survive the
harsh conditions of the death phase and become growing bacteria
when placed in an environment that supports life.