Downloaded 397 times


![Limitation of log or exponential phase
Exhaustion of nutrition
Accumulation of toxic metabolites end
products
Rise in cell density
Change in PH
[Log phase is the time when cells are most
active metabolically and is preferred for
industrial purpose]](https://image.slidesharecdn.com/growthcurves-170226153721/75/Growth-curves-8-2048.jpg)


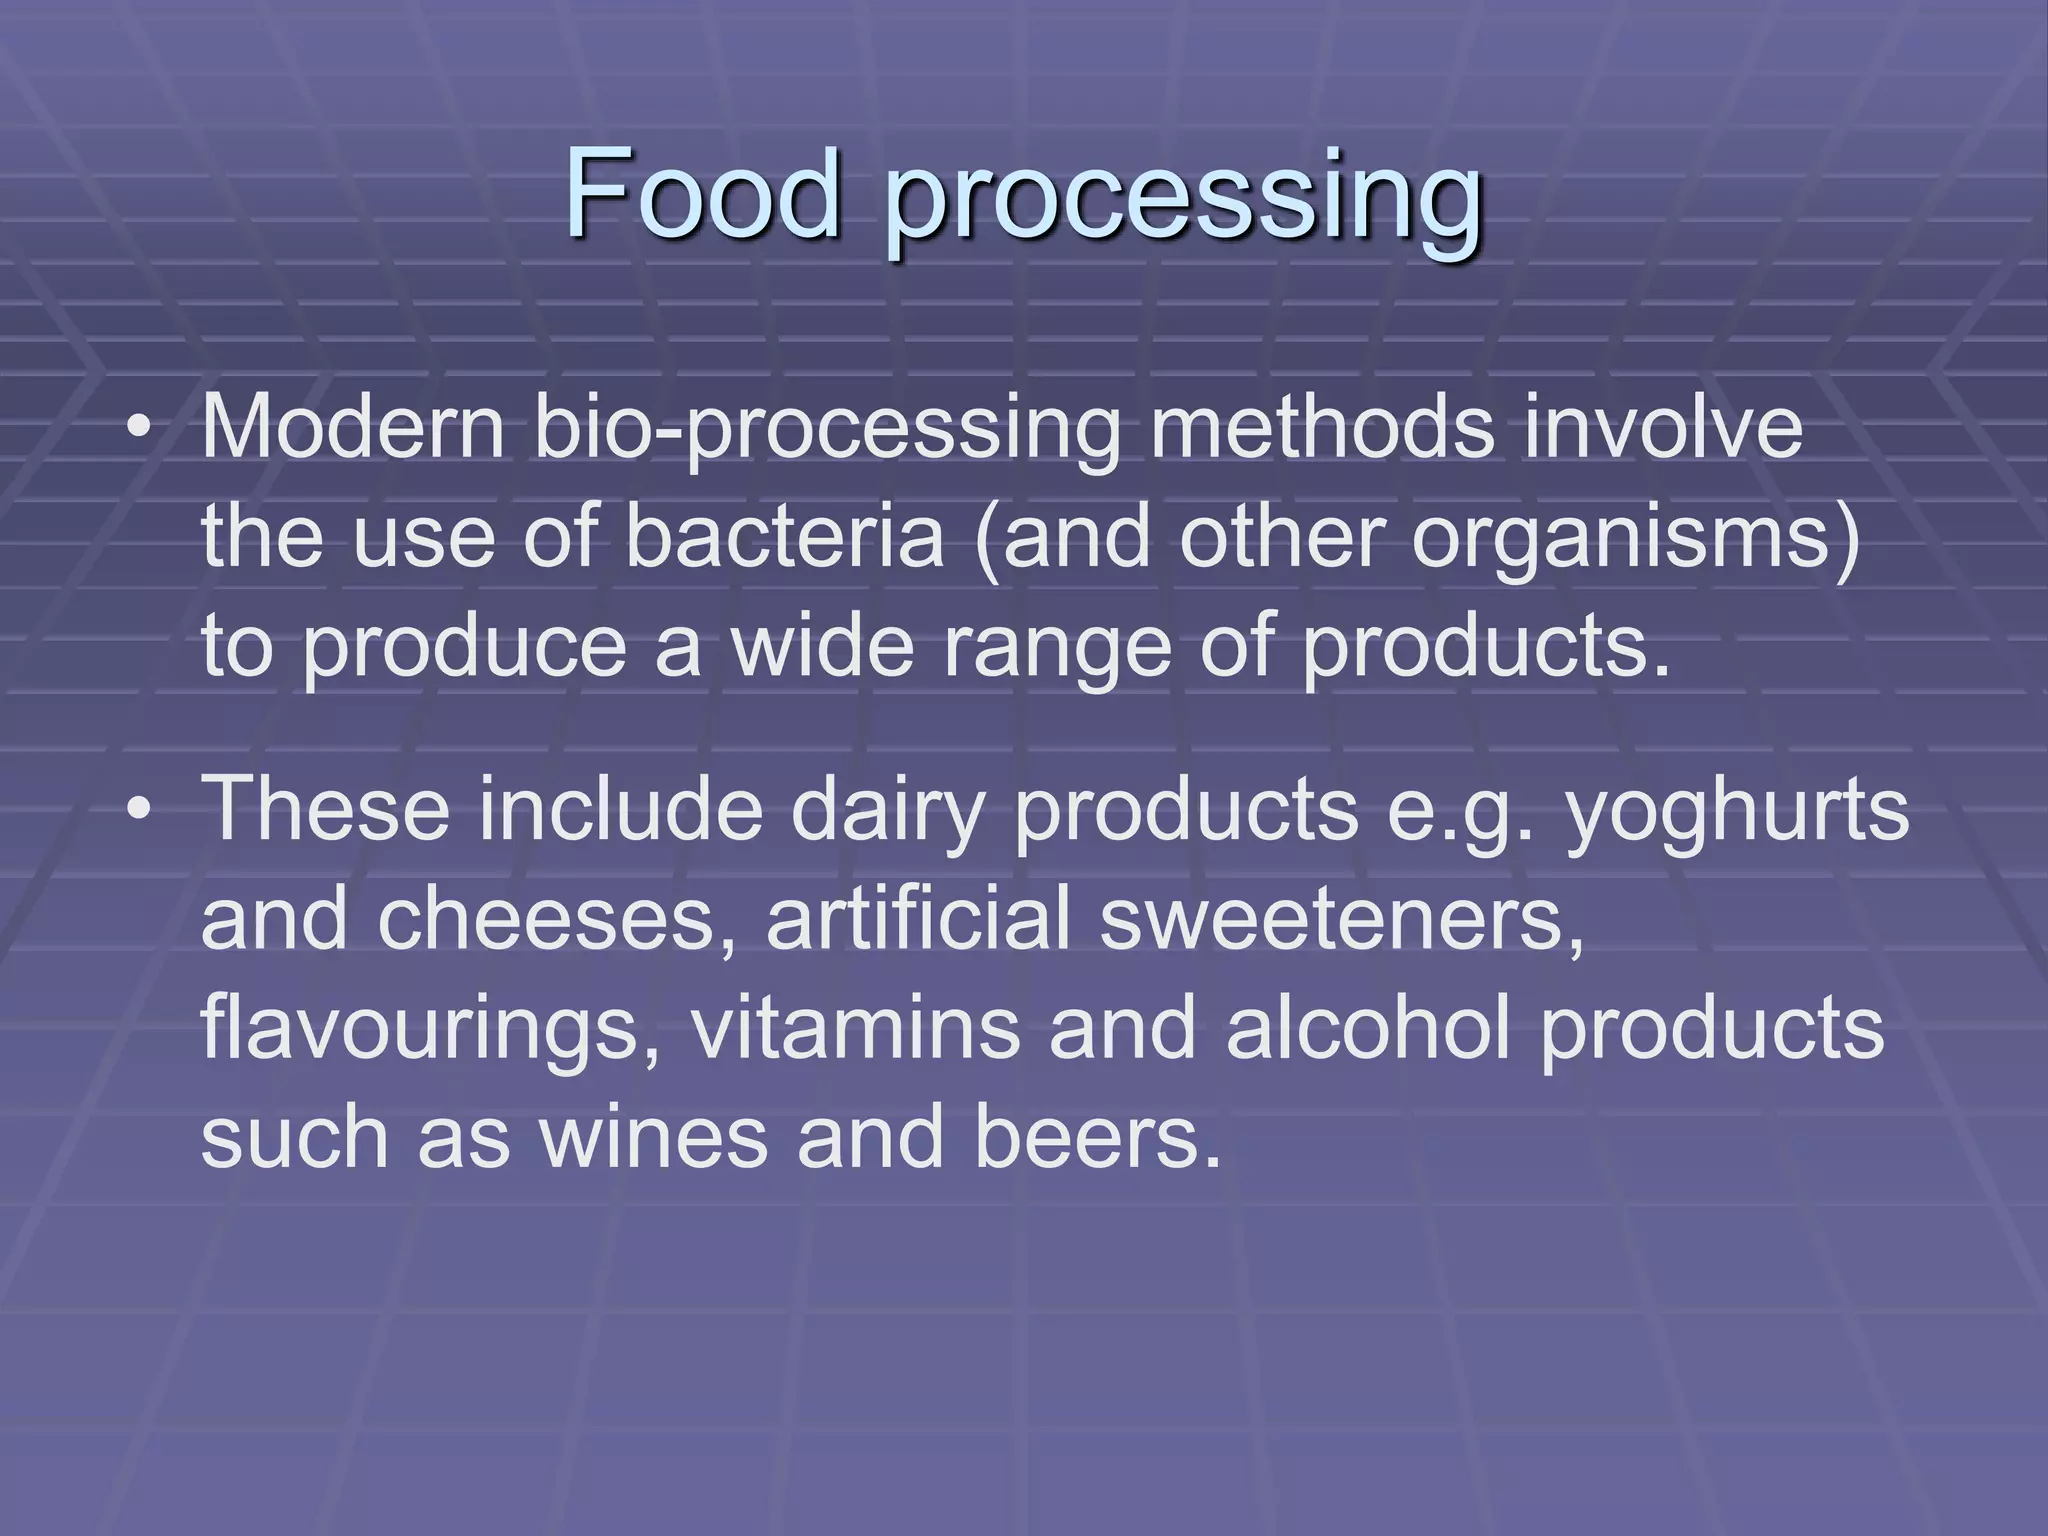


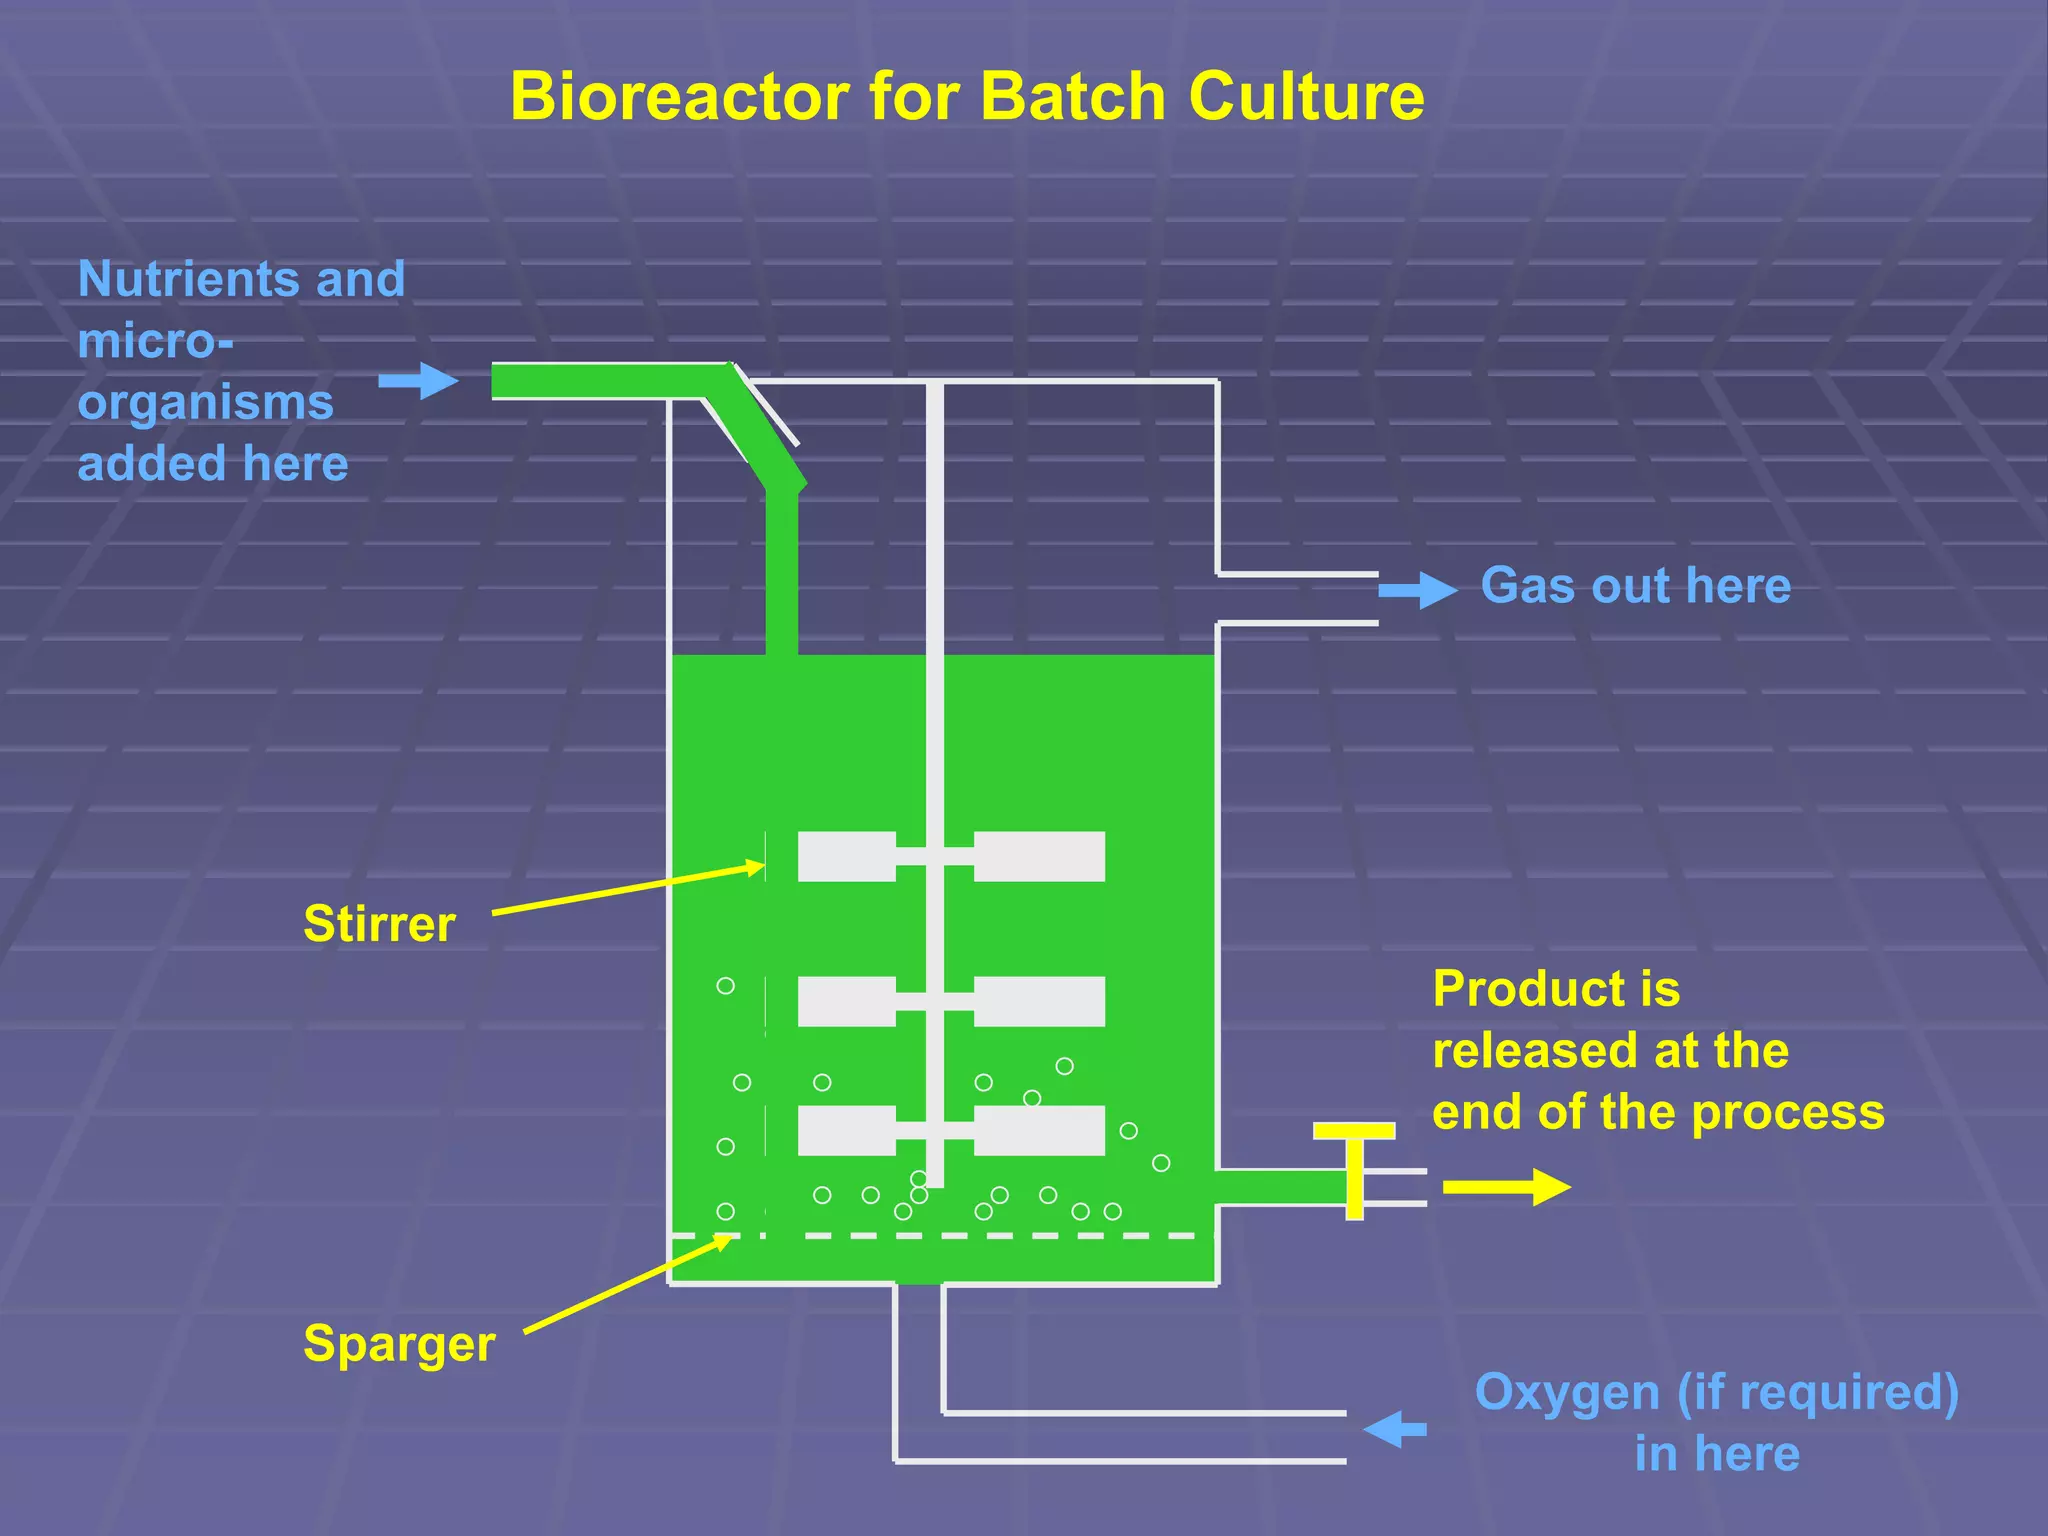


This document discusses the growth curves of microorganisms like bacteria and how their numbers are represented using a logarithmic scale. It then describes the four phases of bacterial growth - lag, log (exponential), stationary, and death phase. The log phase is when bacteria grow and divide most rapidly. The document also differentiates between batch and continuous culture methods for food processing using bioreactors, noting that continuous culture maintains bacteria in the log phase for ongoing production.


