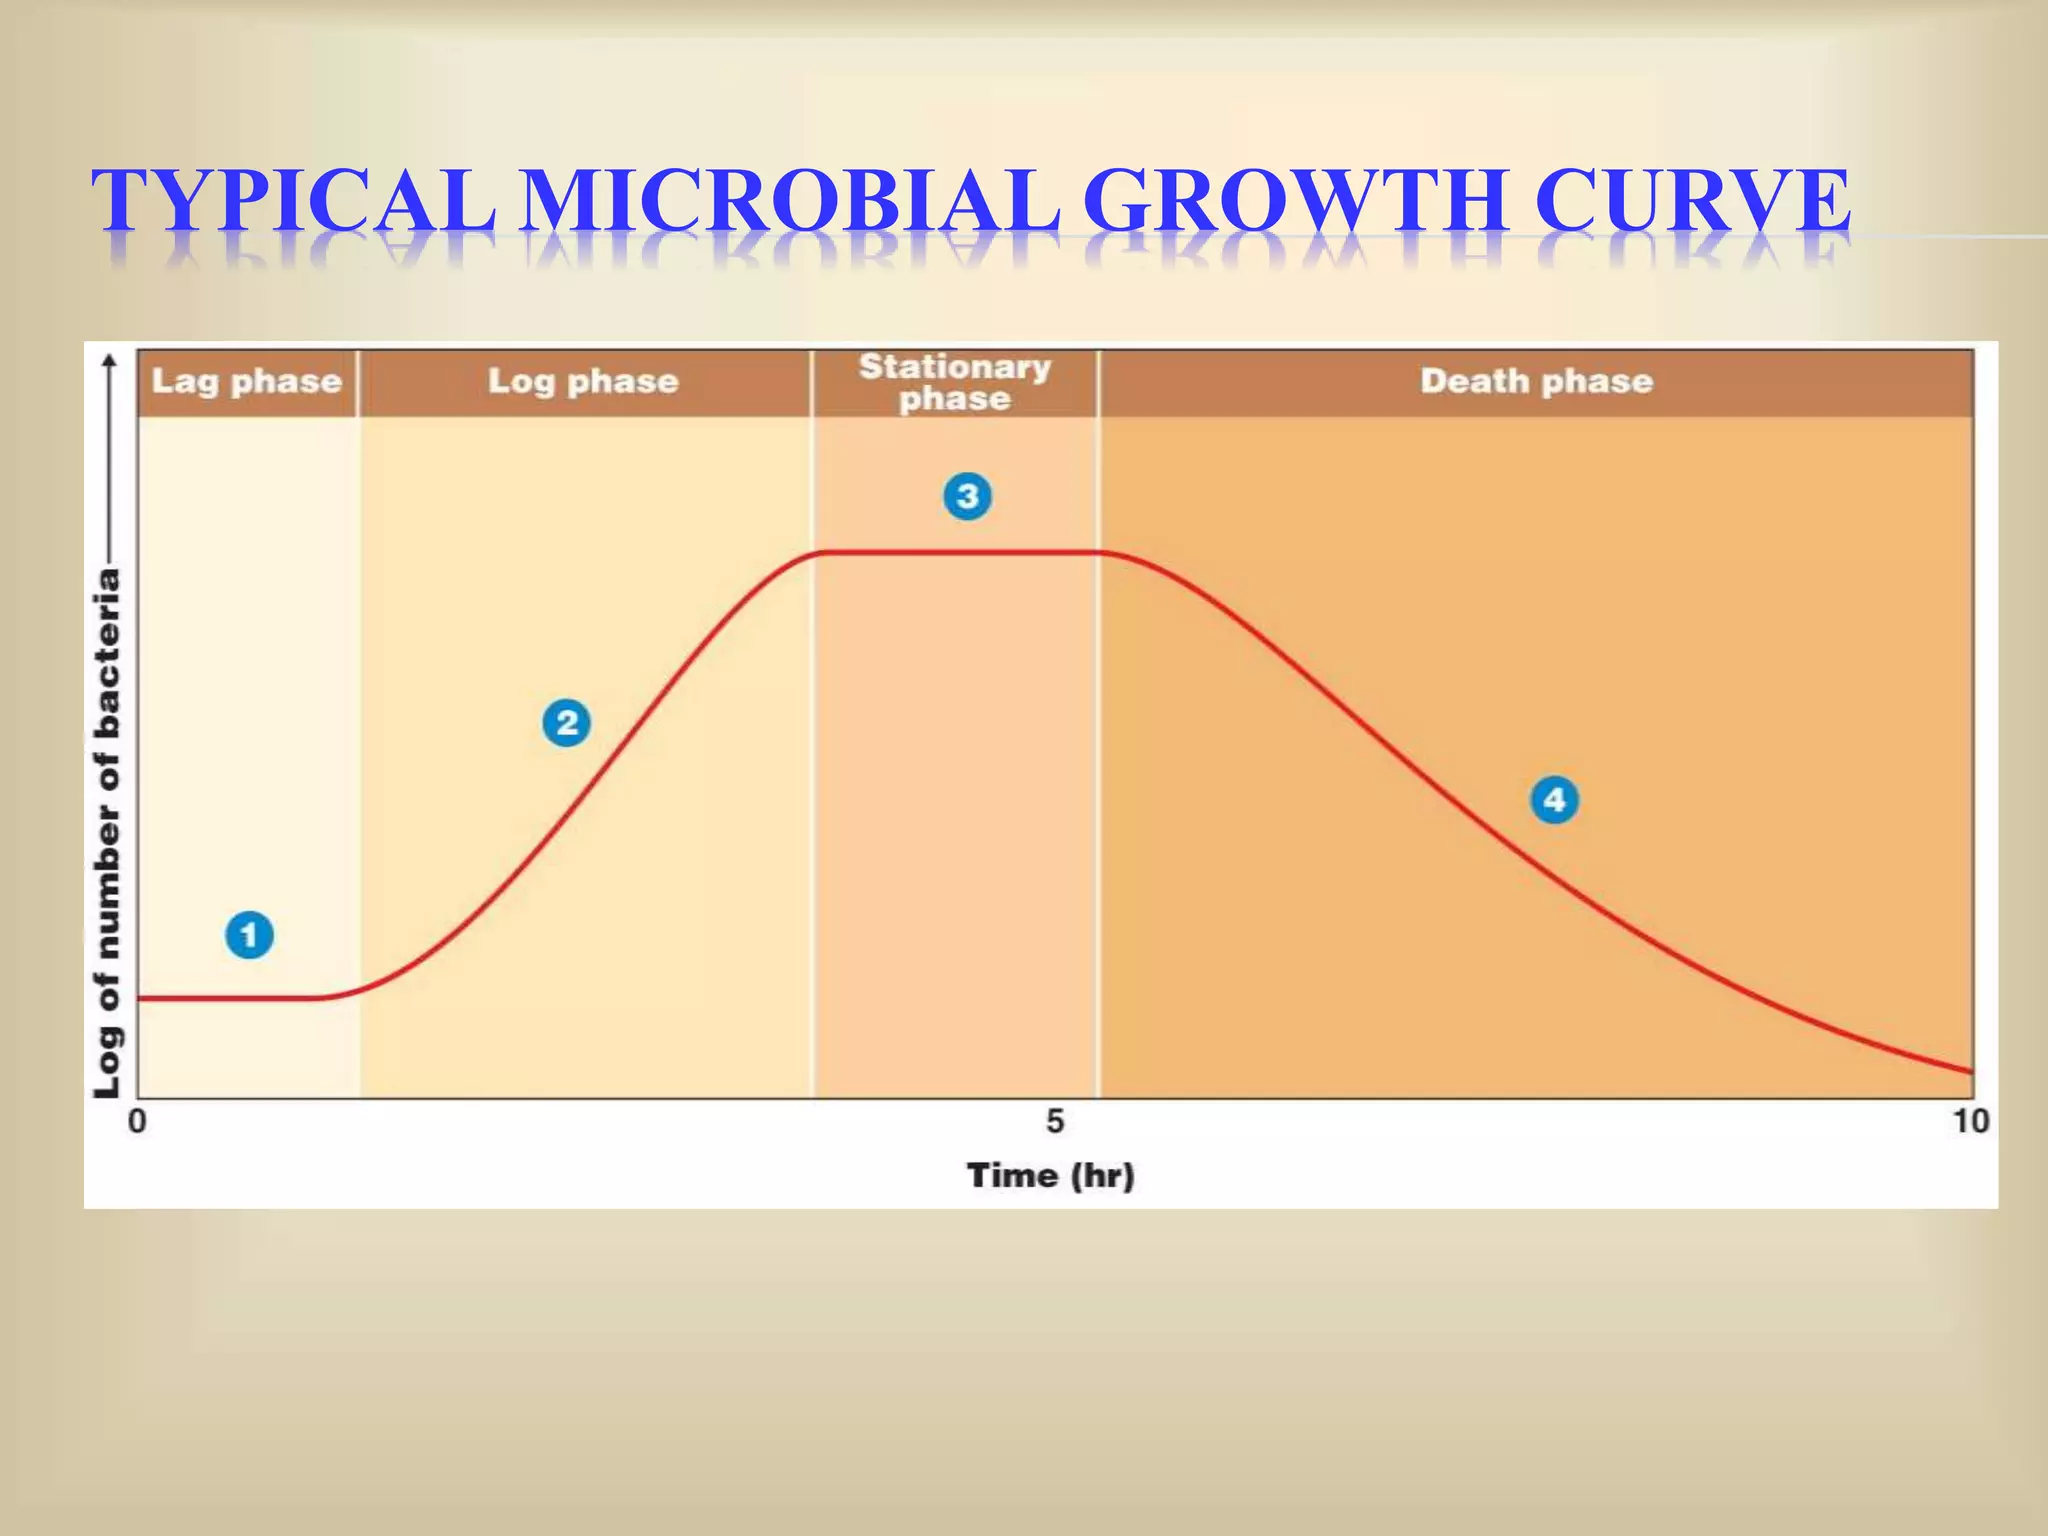
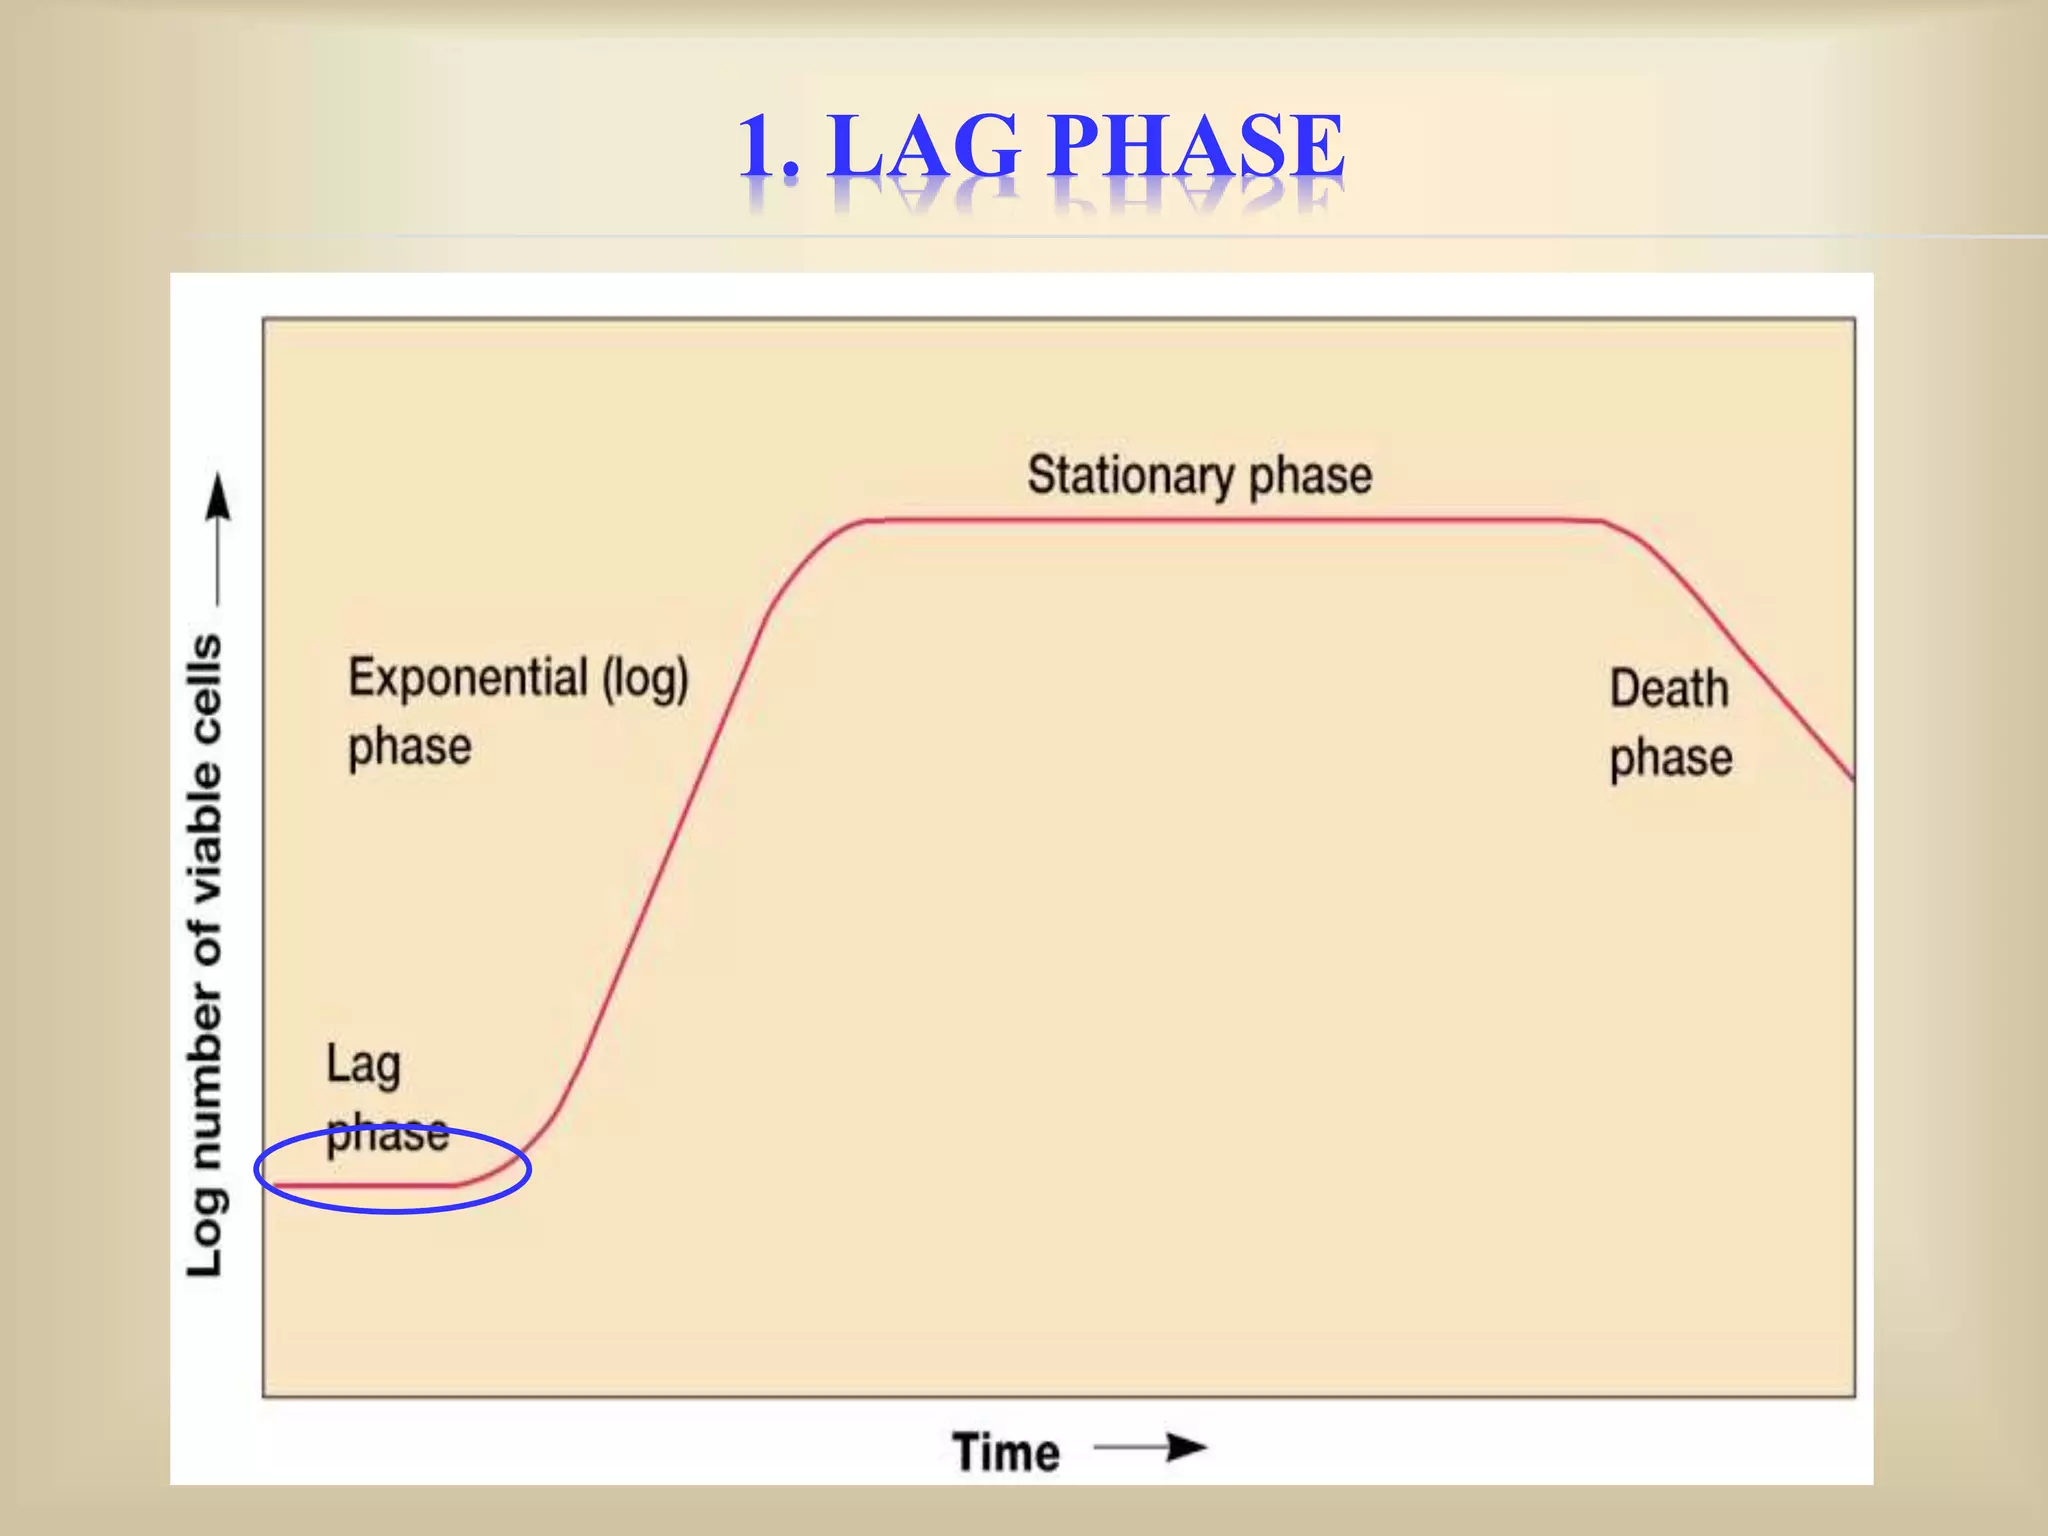
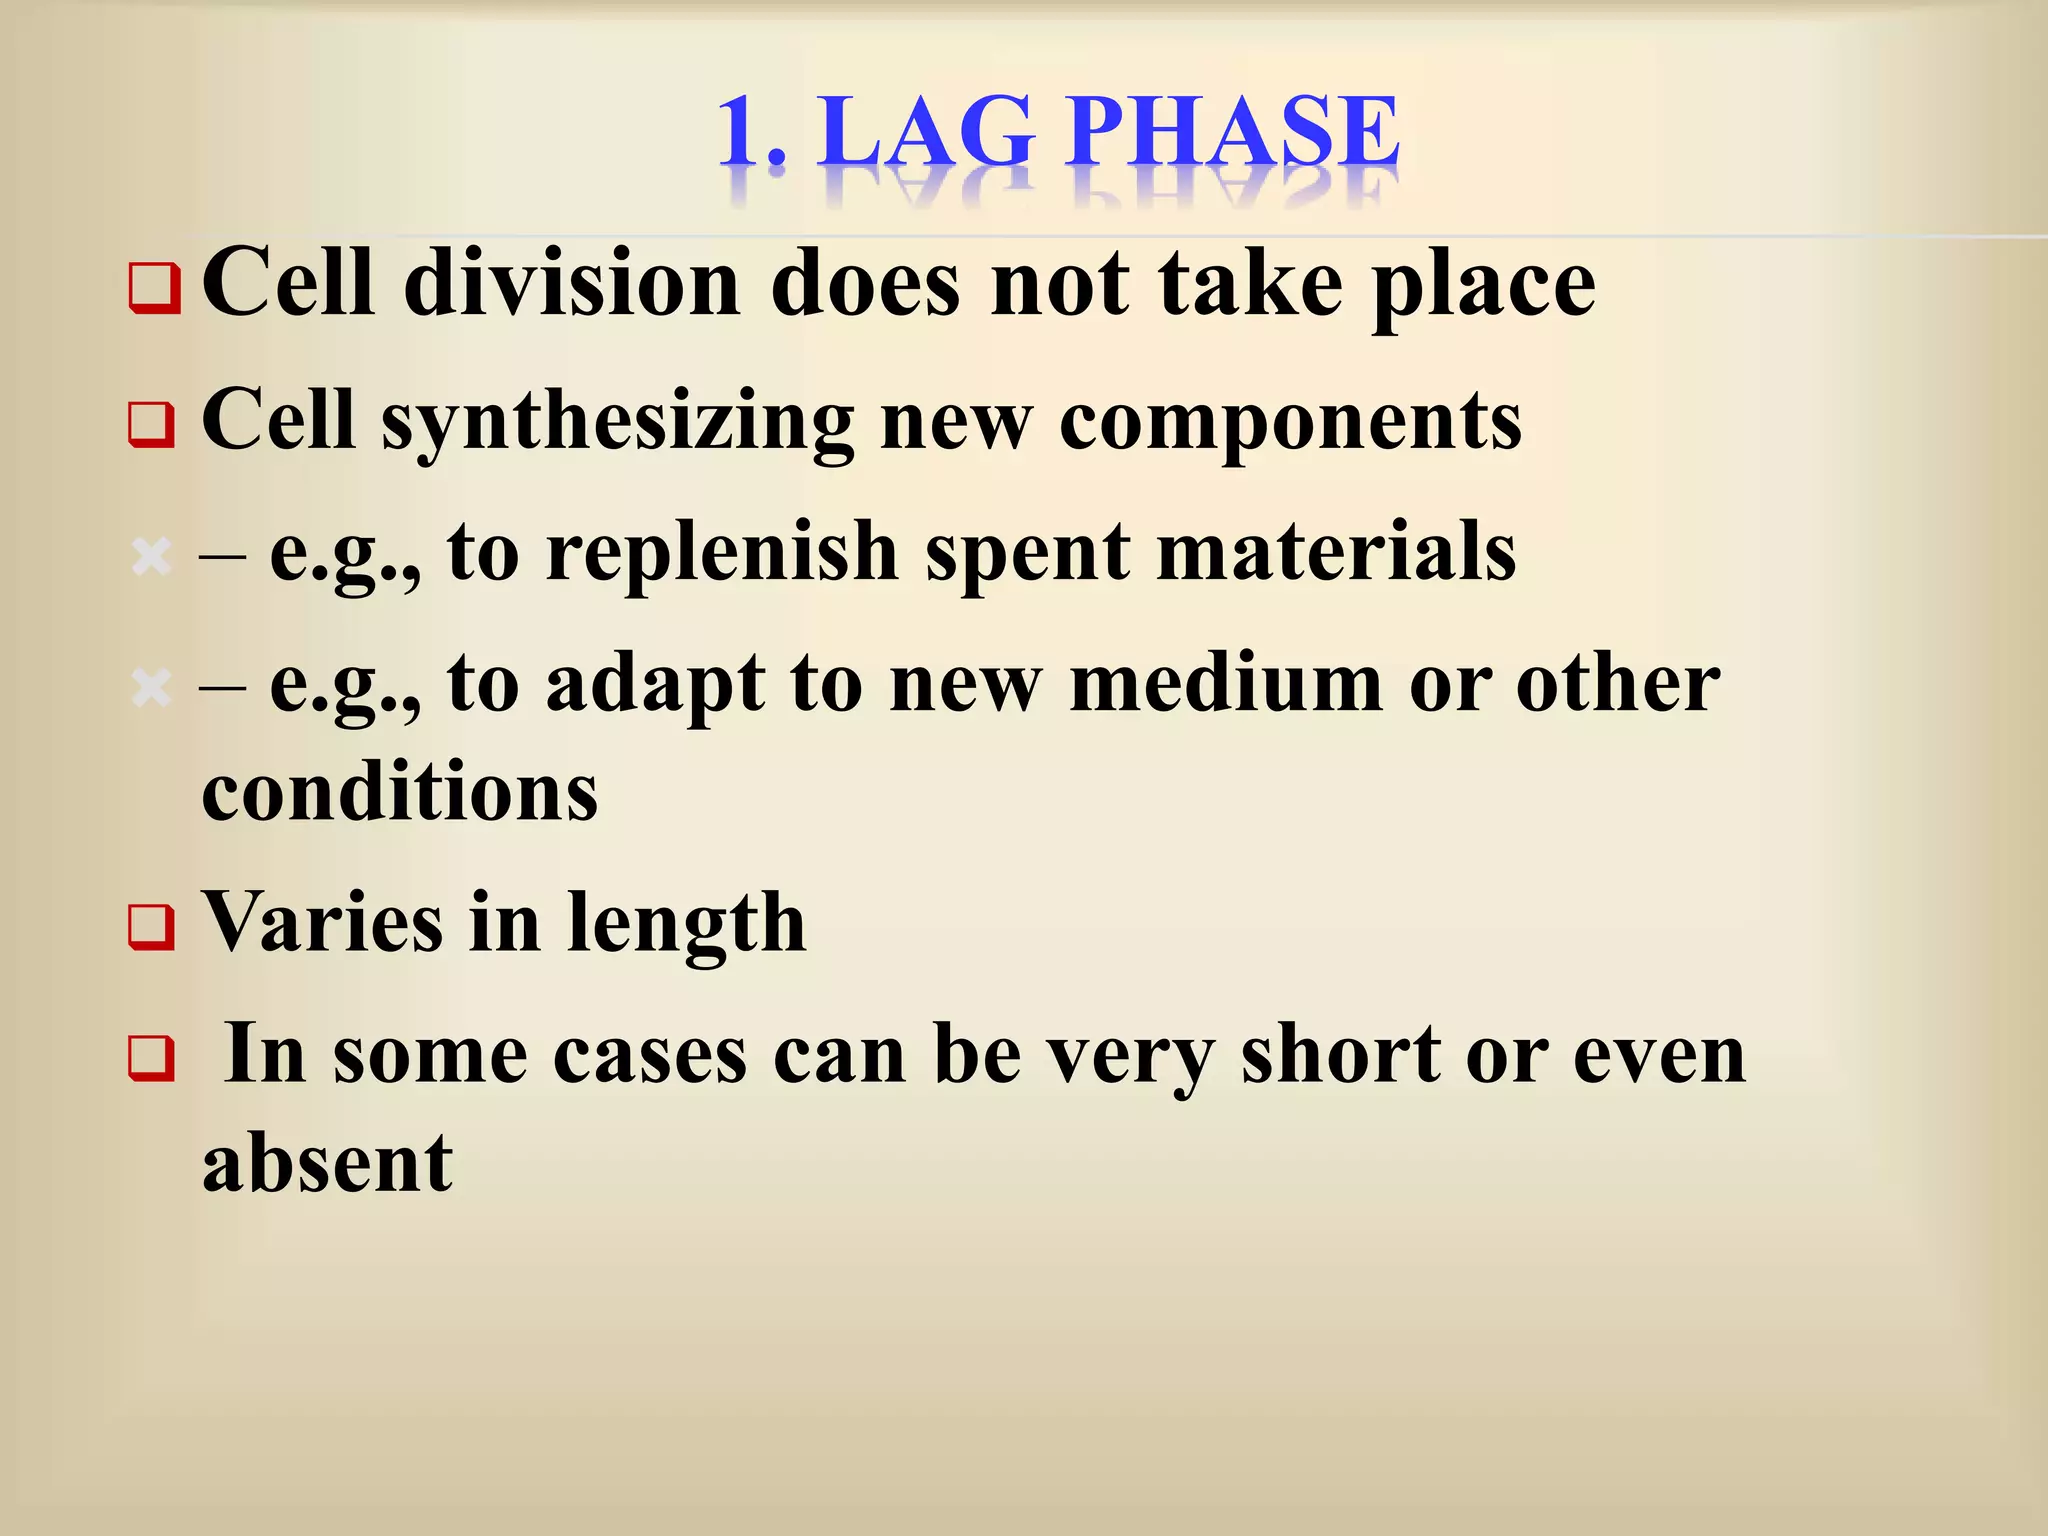
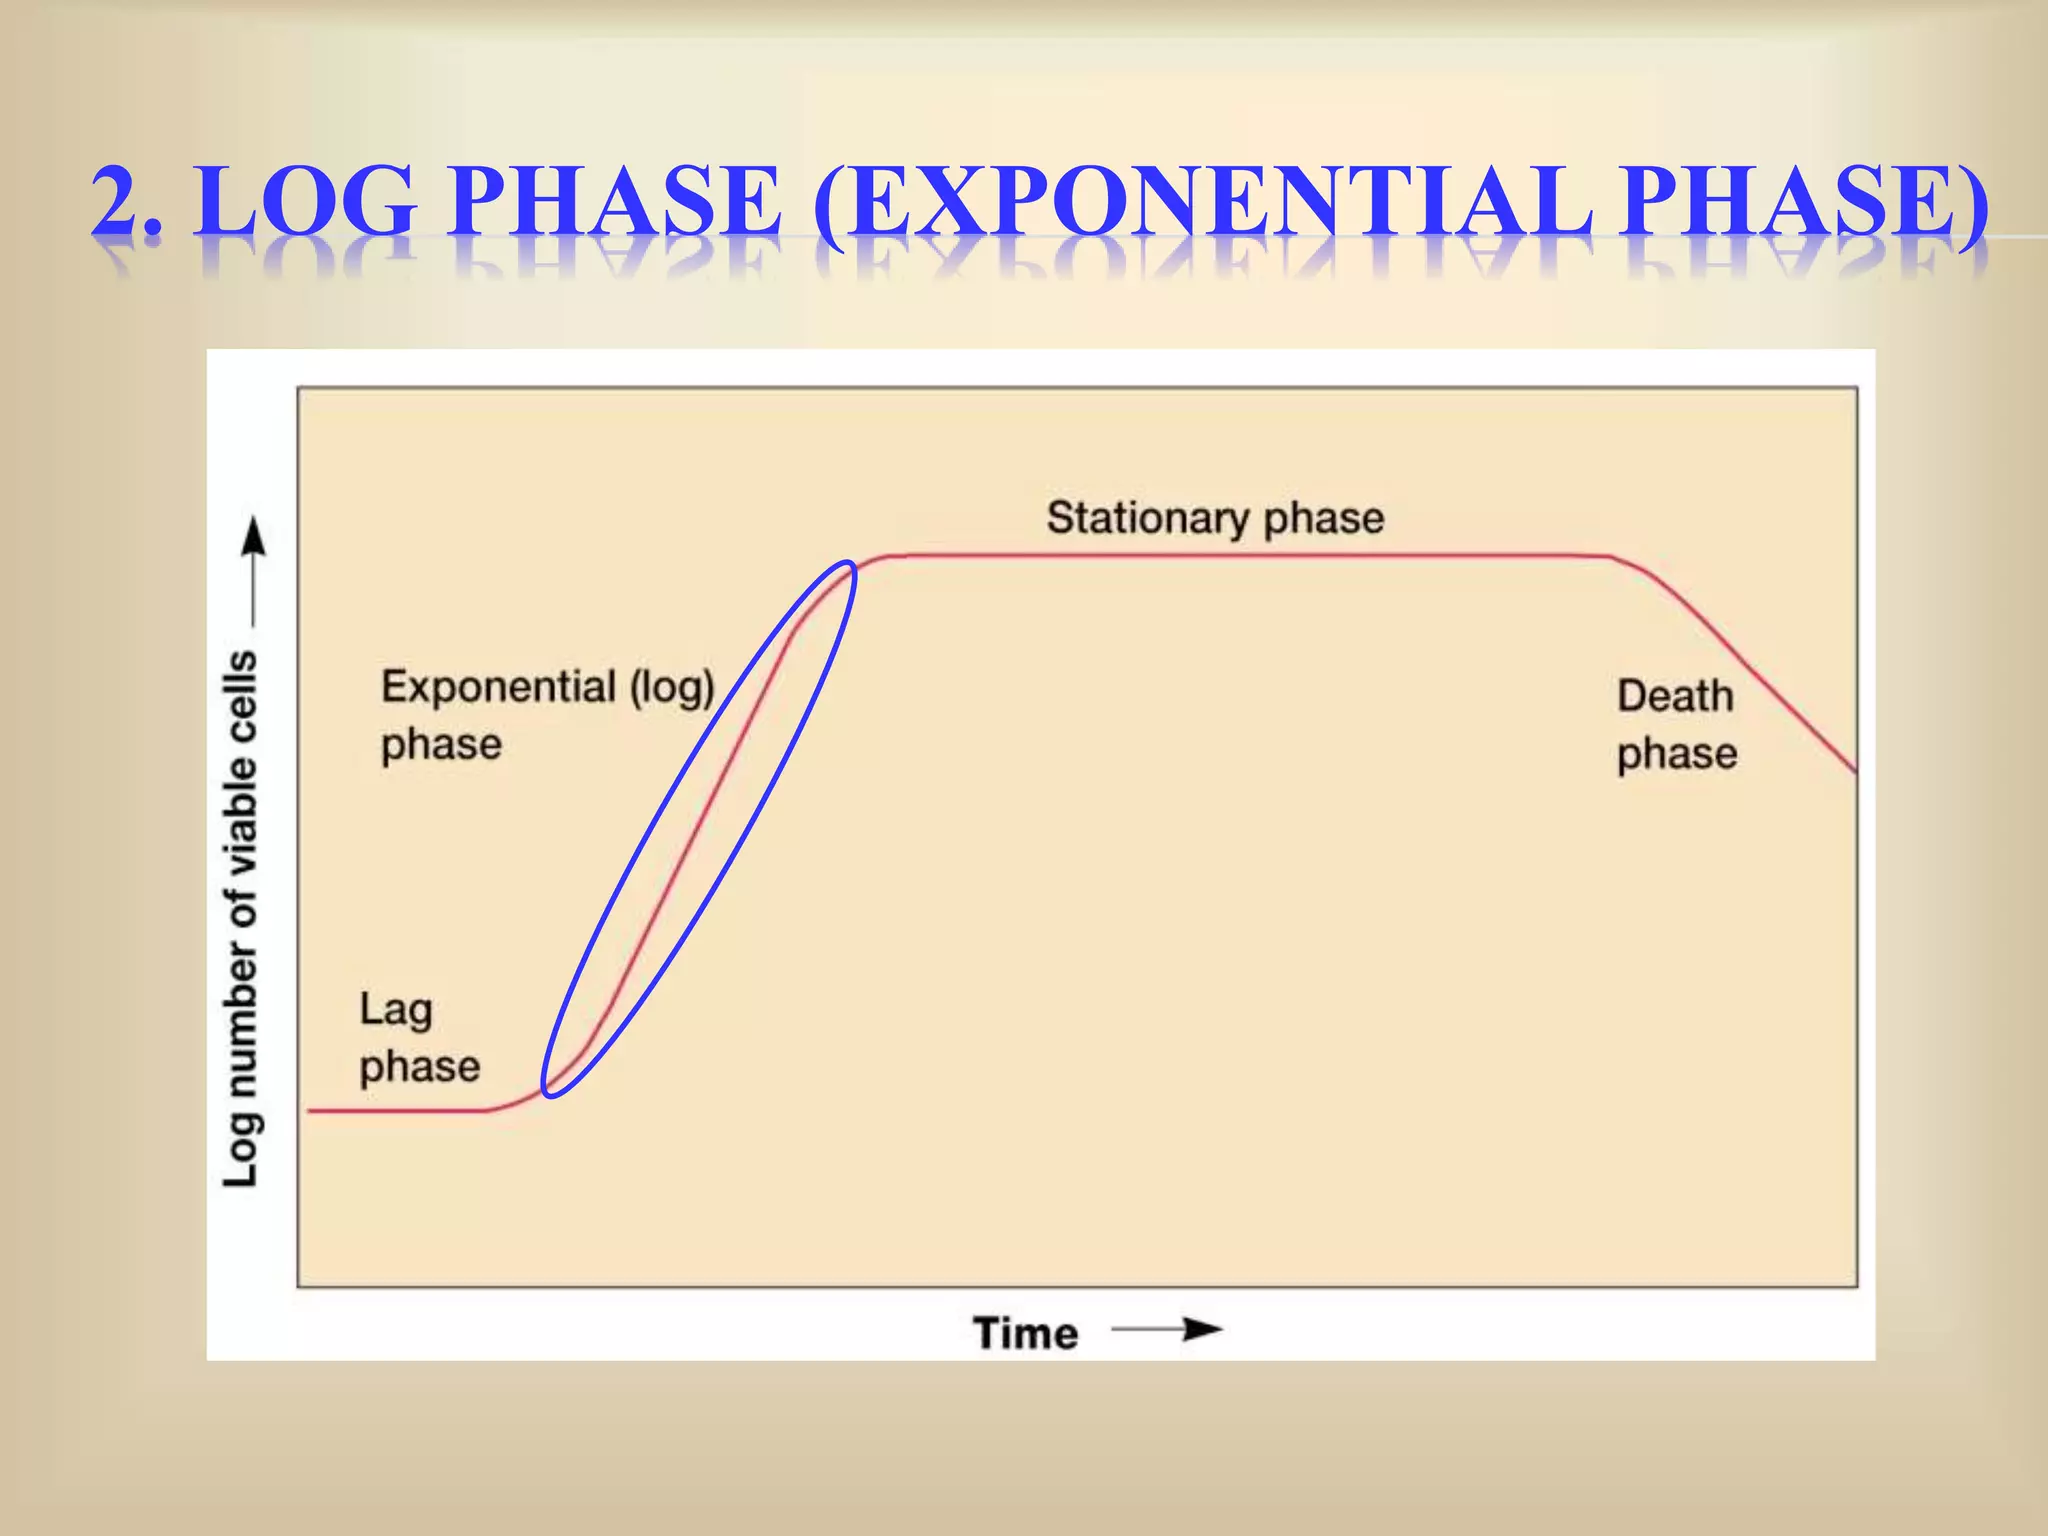
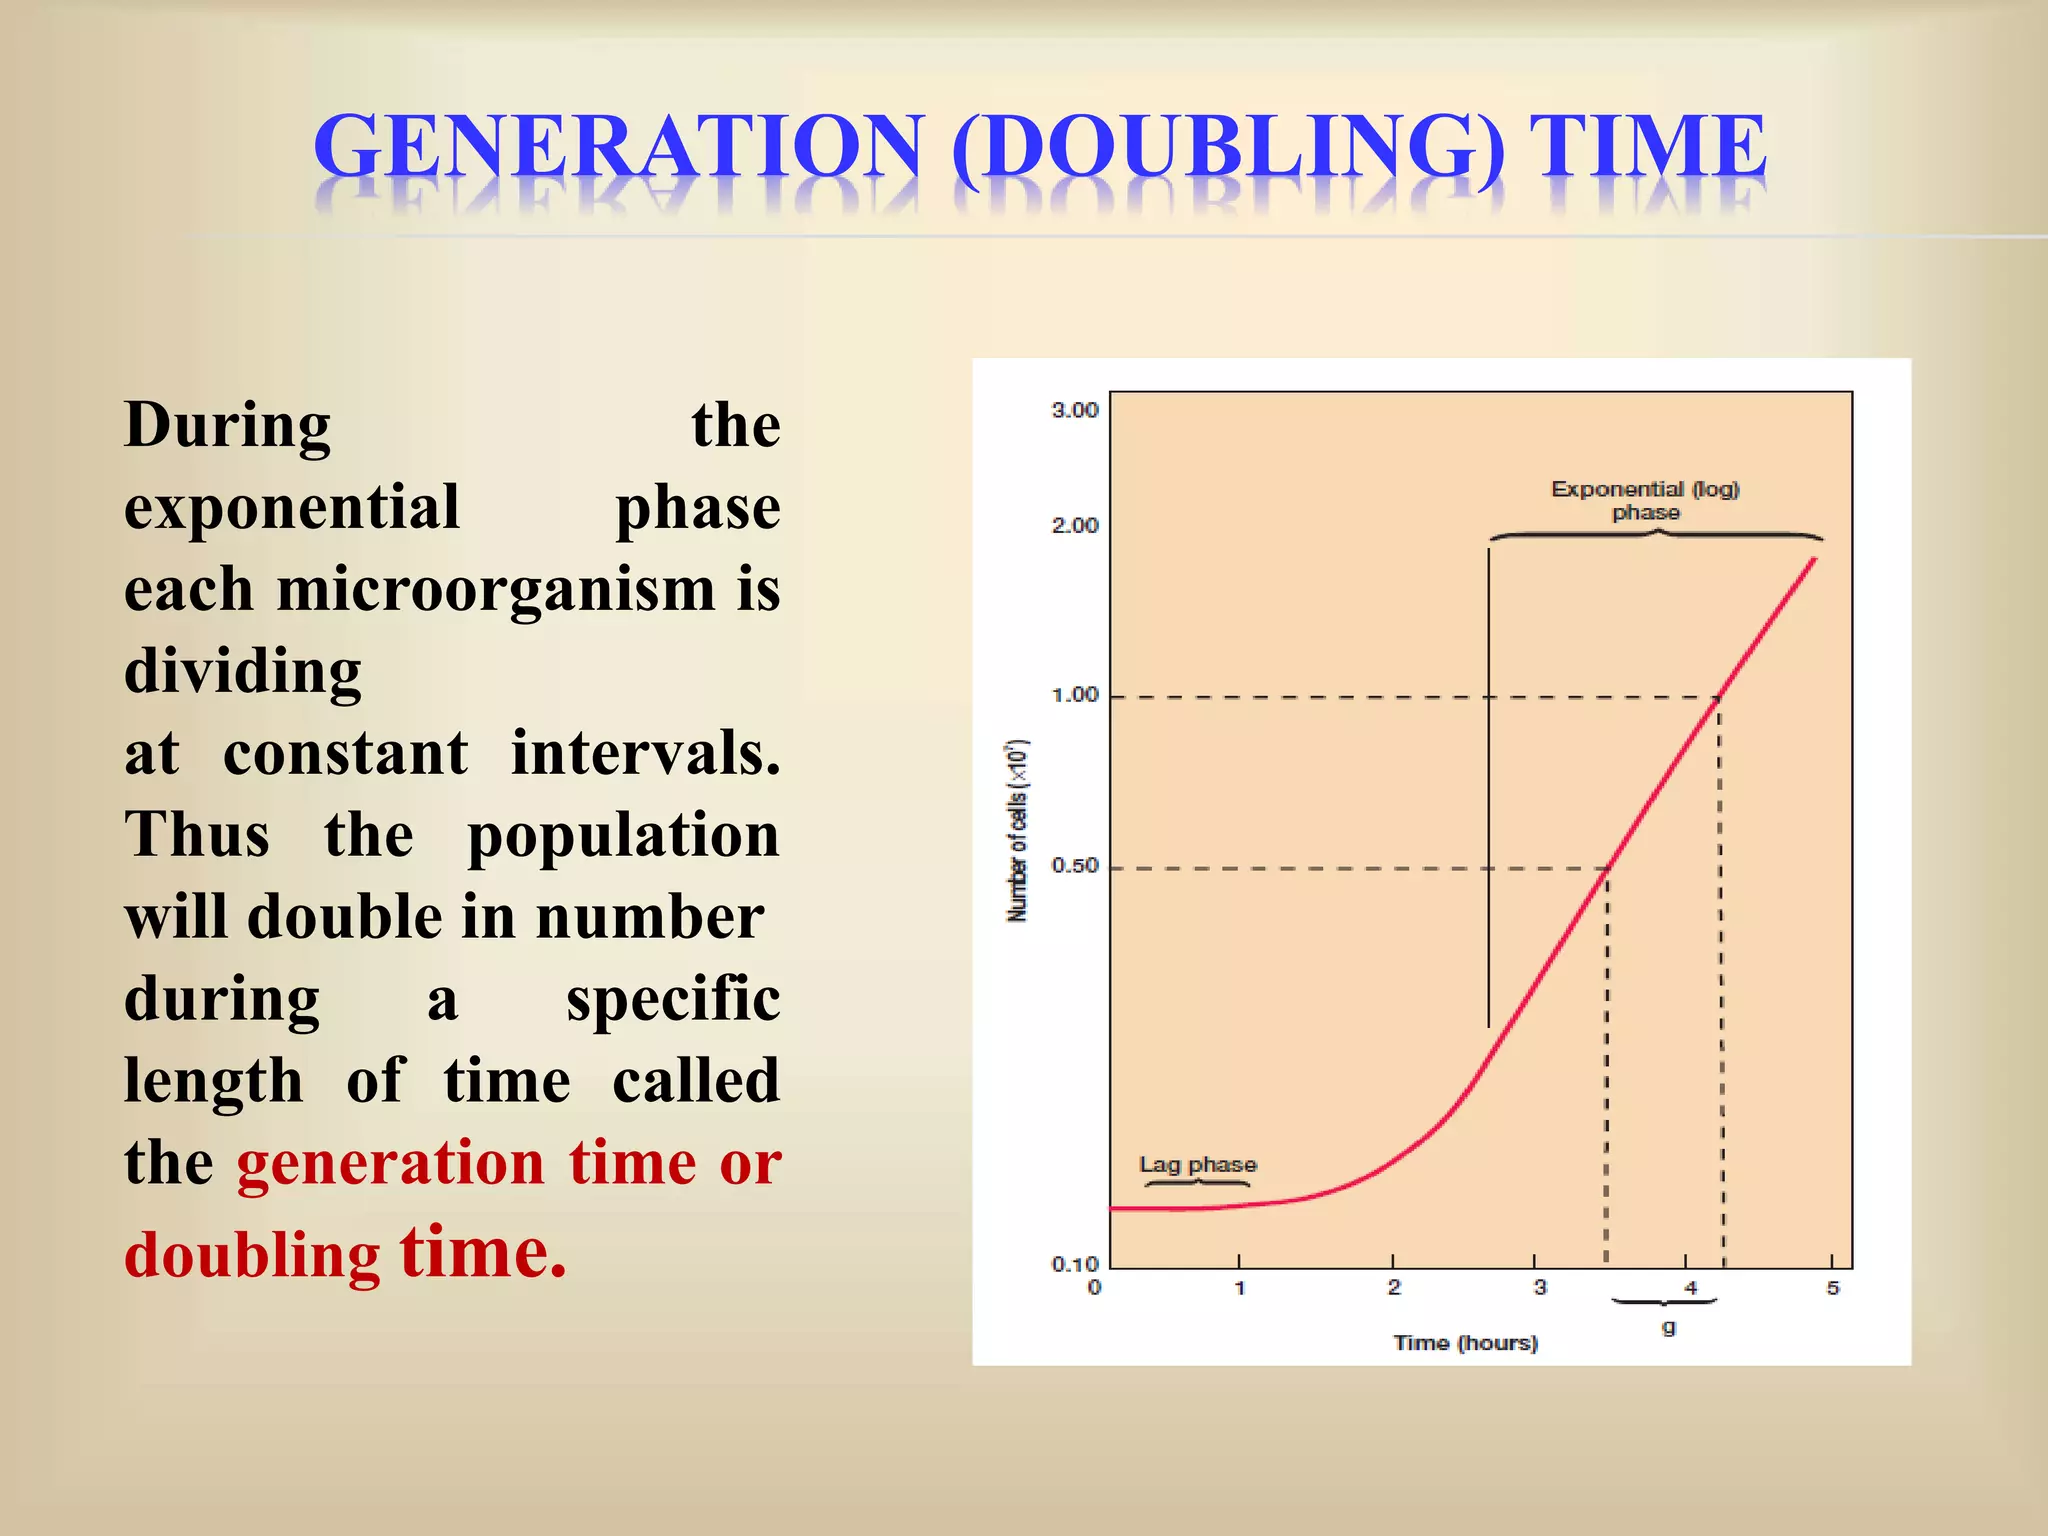
The document discusses bacterial growth curves. It explains that bacterial growth is defined as an increase in cellular constituents that can result in increased cell number or size. The growth of bacteria reproducing by binary fission can be plotted on a curve with four phases: 1) Lag phase where cells adapt to new conditions, 2) Log or exponential phase where growth is maximal, 3) Stationary phase where growth balances with death due to nutrient depletion or waste accumulation, and 4) Death phase where cells begin dying off. The generation time, growth rate, and growth curve mathematics are also explained.
Direct methods of measurement of microbial growth includes various methods of enumeration of both viable and non viable cell also includes growth curve. Helpful for UG and PG programs of microbiology
When fresh liquid medium is inoculated with a given number of bacteria and incubated for sufficient period of time, it gives a characteristic growth pattern of bacteria.
If the bacterial population is measured periodically and log of number of viable bacteria is plotted in a graph against time, it gives a characteristic growth curve which is known as growth curve or growth cycle.
Definition of bacterial growth
Modes of multiplication in bacteria
List the salient features of bacterial growth curve.
Concepts of generation time and growth curve
Calculations of generation time
This PPT is meant for undergraduate students to clear the concepts of Microbial metabolism.
The presentation includes the basics of catabolism and anabolism
GROWTH OF BACTERIA CANNOT BE MEASURED DIRECTLY BY SEEING THEM AS THEY ARE MICROSCOPIC STRUCTURES THEREFORE WE HAVE TO USE SEVERAL METHODS WHICH ARE DESCRIBED IN THIS PRESENTATION
Growth of bacteria is affected by many factors such as nutrition concentration and other environmental factors.
Some of the important factors affecting bacterial growth are:
Nutrition concentration
Temperature
Gaseous concentration
pH
Ions and salt concentration
Available water
Bacteria are microscopic, single-celled organisms that thrive in diverse environments. These organisms can live in soil, the ocean and inside the human gut. Humans' relationship with bacteria is complex. Sometimes bacteria lend us a helping hand, such as by curdling milk into yogurt or helping with our digestion
MICROBIAL GROWTH, REPRODUCTION AND CONTROLPeterKenneth3
Microbial growth is defined as an increase in the number of cells. A microbial cell has a lifespan and a species is maintained only as a result of continued growth of its population. Growth is the ultimate process in the life of a cell – one cell becoming two and subsequently leading to an increase in the number in a population of microorganisms.
In microbiology, growth is synonymous to reproduction. This unit examines the term growth, binary fission, the mode of cell division in prokaryotic cells, stages in the growth curve and the mathematics of growth.
Definition of Growth
Growth is defined as an increase in the number of cells in a population of microorganisms. It is an increase in cellular constituents leading to arise in cell number when microorganisms reproduce by processes like binary fission or budding.
The Prokaryotic Cell Cycle
A prokaryotic cell cycle is the complete sequence of events from the formation of a new cell through the next division. Most prokaryotes reproduce by binary fission, budding or fragmentation.
Binary Fission
Binary fission is a form of asexual reproduction process. In which a single cell divides into two cells after developing a transverse septum(cross wall).Binary fission is a simple type of cell division and the processes involved are: the cell elongates, replicates its
chromosomes and separates the newly formed DNA molecules so that there is a chromosome in each half of the cell. A septum is formed at mid cell; divide the parent cell into two progeny cells and each having its own chromosome and a copy or complement of other cellular constituents.
Deep Behavioral Phenotyping in Systems Neuroscience for Functional Atlasing a...Ana Luísa Pinho
Functional Magnetic Resonance Imaging (fMRI) provides means to characterize brain activations in response to behavior. However, cognitive neuroscience has been limited to group-level effects referring to the performance of specific tasks. To obtain the functional profile of elementary cognitive mechanisms, the combination of brain responses to many tasks is required. Yet, to date, both structural atlases and parcellation-based activations do not fully account for cognitive function and still present several limitations. Further, they do not adapt overall to individual characteristics. In this talk, I will give an account of deep-behavioral phenotyping strategies, namely data-driven methods in large task-fMRI datasets, to optimize functional brain-data collection and improve inference of effects-of-interest related to mental processes. Key to this approach is the employment of fast multi-functional paradigms rich on features that can be well parametrized and, consequently, facilitate the creation of psycho-physiological constructs to be modelled with imaging data. Particular emphasis will be given to music stimuli when studying high-order cognitive mechanisms, due to their ecological nature and quality to enable complex behavior compounded by discrete entities. I will also discuss how deep-behavioral phenotyping and individualized models applied to neuroimaging data can better account for the subject-specific organization of domain-general cognitive systems in the human brain. Finally, the accumulation of functional brain signatures brings the possibility to clarify relationships among tasks and create a univocal link between brain systems and mental functions through: (1) the development of ontologies proposing an organization of cognitive processes; and (2) brain-network taxonomies describing functional specialization. To this end, tools to improve commensurability in cognitive science are necessary, such as public repositories, ontology-based platforms and automated meta-analysis tools. I will thus discuss some brain-atlasing resources currently under development, and their applicability in cognitive as well as clinical neuroscience.
THE IMPORTANCE OF MARTIAN ATMOSPHERE SAMPLE RETURN.Sérgio Sacani
The return of a sample of near-surface atmosphere from Mars would facilitate answers to several first-order science questions surrounding the formation and evolution of the planet. One of the important aspects of terrestrial planet formation in general is the role that primary atmospheres played in influencing the chemistry and structure of the planets and their antecedents. Studies of the martian atmosphere can be used to investigate the role of a primary atmosphere in its history. Atmosphere samples would also inform our understanding of the near-surface chemistry of the planet, and ultimately the prospects for life. High-precision isotopic analyses of constituent gases are needed to address these questions, requiring that the analyses are made on returned samples rather than in situ.
(May 29th, 2024) Advancements in Intravital Microscopy- Insights for Preclini...Scintica Instrumentation
Intravital microscopy (IVM) is a powerful tool utilized to study cellular behavior over time and space in vivo. Much of our understanding of cell biology has been accomplished using various in vitro and ex vivo methods; however, these studies do not necessarily reflect the natural dynamics of biological processes. Unlike traditional cell culture or fixed tissue imaging, IVM allows for the ultra-fast high-resolution imaging of cellular processes over time and space and were studied in its natural environment. Real-time visualization of biological processes in the context of an intact organism helps maintain physiological relevance and provide insights into the progression of disease, response to treatments or developmental processes.
In this webinar we give an overview of advanced applications of the IVM system in preclinical research. IVIM technology is a provider of all-in-one intravital microscopy systems and solutions optimized for in vivo imaging of live animal models at sub-micron resolution. The system’s unique features and user-friendly software enables researchers to probe fast dynamic biological processes such as immune cell tracking, cell-cell interaction as well as vascularization and tumor metastasis with exceptional detail. This webinar will also give an overview of IVM being utilized in drug development, offering a view into the intricate interaction between drugs/nanoparticles and tissues in vivo and allows for the evaluation of therapeutic intervention in a variety of tissues and organs. This interdisciplinary collaboration continues to drive the advancements of novel therapeutic strategies.
Richard's aventures in two entangled wonderlandsRichard Gill
Since the loophole-free Bell experiments of 2020 and the Nobel prizes in physics of 2022, critics of Bell's work have retreated to the fortress of super-determinism. Now, super-determinism is a derogatory word - it just means "determinism". Palmer, Hance and Hossenfelder argue that quantum mechanics and determinism are not incompatible, using a sophisticated mathematical construction based on a subtle thinning of allowed states and measurements in quantum mechanics, such that what is left appears to make Bell's argument fail, without altering the empirical predictions of quantum mechanics. I think however that it is a smoke screen, and the slogan "lost in math" comes to my mind. I will discuss some other recent disproofs of Bell's theorem using the language of causality based on causal graphs. Causal thinking is also central to law and justice. I will mention surprising connections to my work on serial killer nurse cases, in particular the Dutch case of Lucia de Berk and the current UK case of Lucy Letby.
Comparing Evolved Extractive Text Summary Scores of Bidirectional Encoder Rep...University of Maribor
Slides from:
11th International Conference on Electrical, Electronics and Computer Engineering (IcETRAN), Niš, 3-6 June 2024
Track: Artificial Intelligence
https://www.etran.rs/2024/en/home-english/
Introduction:
RNA interference (RNAi) or Post-Transcriptional Gene Silencing (PTGS) is an important biological process for modulating eukaryotic gene expression.
It is highly conserved process of posttranscriptional gene silencing by which double stranded RNA (dsRNA) causes sequence-specific degradation of mRNA sequences.
dsRNA-induced gene silencing (RNAi) is reported in a wide range of eukaryotes ranging from worms, insects, mammals and plants.
This process mediates resistance to both endogenous parasitic and exogenous pathogenic nucleic acids, and regulates the expression of protein-coding genes.
What are small ncRNAs?
micro RNA (miRNA)
short interfering RNA (siRNA)
Properties of small non-coding RNA:
Involved in silencing mRNA transcripts.
Called “small” because they are usually only about 21-24 nucleotides long.
Synthesized by first cutting up longer precursor sequences (like the 61nt one that Lee discovered).
Silence an mRNA by base pairing with some sequence on the mRNA.
Discovery of siRNA?
The first small RNA:
In 1993 Rosalind Lee (Victor Ambros lab) was studying a non- coding gene in C. elegans, lin-4, that was involved in silencing of another gene, lin-14, at the appropriate time in the
development of the worm C. elegans.
Two small transcripts of lin-4 (22nt and 61nt) were found to be complementary to a sequence in the 3' UTR of lin-14.
Because lin-4 encoded no protein, she deduced that it must be these transcripts that are causing the silencing by RNA-RNA interactions.
Types of RNAi ( non coding RNA)
MiRNA
Length (23-25 nt)
Trans acting
Binds with target MRNA in mismatch
Translation inhibition
Si RNA
Length 21 nt.
Cis acting
Bind with target Mrna in perfect complementary sequence
Piwi-RNA
Length ; 25 to 36 nt.
Expressed in Germ Cells
Regulates trnasposomes activity
MECHANISM OF RNAI:
First the double-stranded RNA teams up with a protein complex named Dicer, which cuts the long RNA into short pieces.
Then another protein complex called RISC (RNA-induced silencing complex) discards one of the two RNA strands.
The RISC-docked, single-stranded RNA then pairs with the homologous mRNA and destroys it.
THE RISC COMPLEX:
RISC is large(>500kD) RNA multi- protein Binding complex which triggers MRNA degradation in response to MRNA
Unwinding of double stranded Si RNA by ATP independent Helicase
Active component of RISC is Ago proteins( ENDONUCLEASE) which cleave target MRNA.
DICER: endonuclease (RNase Family III)
Argonaute: Central Component of the RNA-Induced Silencing Complex (RISC)
One strand of the dsRNA produced by Dicer is retained in the RISC complex in association with Argonaute
ARGONAUTE PROTEIN :
1.PAZ(PIWI/Argonaute/ Zwille)- Recognition of target MRNA
2.PIWI (p-element induced wimpy Testis)- breaks Phosphodiester bond of mRNA.)RNAse H activity.
MiRNA:
The Double-stranded RNAs are naturally produced in eukaryotic cells during development, and they have a key role in regulating gene expression .
Professional air quality monitoring systems provide immediate, on-site data for analysis, compliance, and decision-making.
Monitor common gases, weather parameters, particulates.
2. BACTERIAL GROWTH CURVE
Increase in cellular constituents that may
result in:
– increase in cell number
• e.g., when microorganisms reproduce by budding
or binary fission
– increase in cell size
• e.g., coenocytic microorganisms have nuclear divisions that are
not accompanied by cell n divisions
• microbiologists usually study population growth rather than
growth of individual cells
3. BACTERIAL GROWTH
Definition: Growth may be defined as an increase in
cellular constituents. It leads to a rise in cell number
when microorganisms reproduce by processes like
budding or binary fission.
4. The growth of microorganisms reproducing by
binary fission can be plotted as the logarithm
of the number of viable cells versus the
incubation time
The resulting curve has four distinct phases
1. Lag Phase (Adaptation Phase)
2. Log Phase (Exponential Phase)
3. Stationary Phase (idio phase)
4. Death Phase (Decline phase)
7. 1. LAG PHASE
Cell division does not take place
Cell synthesizing new components
– e.g., to replenish spent materials
– e.g., to adapt to new medium or other
conditions
Varies in length
In some cases can be very short or even
absent
9. 2. LOG PHASE (EXPONENTIAL PHASE)
Microorganisms are growing and dividing
at the maximal rate
The population is most uniform in terms of
chemical and physiological properties
Exponential growth is balanced growth.
12. 3. STATIONARY PHASE( IDIO PHASE)
Usually is attained by bacteria at a population
level of around 109 cells per ml.
Microbial populations enter the stationary
phase for several reasons.
1.Nutrient limitation (Starvation):The more important
changes are in gene expression and physiology.
Starving bacteria frequently produce a variety of
starvation proteins, which make the cell much more
resistant to damage in a variety of ways.
2.O2 availability
3.Accumulation of toxic waste products
4.Critical population level is reached
13. STARVATION RESPONSES
Morphological changes
– e.g., endospore formation,
decrease in size,
protoplast shrinkage,
nucleoid condensation
Production of starvation proteins long-term
survival increased virulence
15. 4. DEATH PHASE (DECLINE PHASE)
Cells dying, usually at exponential rate
e.g. environmental changes like nutrient
deprivation and the buildup of toxic wastes lead
Death
– irreversible loss of ability to reproduce
In some cases, death rate slows due to
accumulation of resistant cells
16. THE MATHEMATICS OF GROWTH
Generation (doubling) time:
time required for the population to double in size
Mean growth rate constant:
number of generations per unit time usually
expressed as generations per hour
17. 1--->2 --->4--->8--->16--->32--->64--->128
2--->2¹--->2²--->2³-------------
Assume that a culture tube is inoculated with one cell that divides every 20 minutes
The population will be 2 cells after 20 minutes, 4 cells after 40 minutes, and so
forth. Because the population is doubling every generation, the increase in
population is always 2n where n is the no of generation.
Let N0 = the initial population number N
t = the population at time t
n = the number of generations in time t
Nt = N0 x 2n.
Solving for n, the number of generations, where all logarithms are to the base 10,
log Nt= log N0+ n · log 2, and
n = log Nt - log N0 = log Nt - log N0
log 2 0.301
The rate of growth during the exponential phase in a batch culture can be
expressed in terms of the mean growth rate constant (k).
This is the number of generations per unit time, often expressed as the generations
per hour.
k = n = log Nt - log N0
t 0.301 x t
18. GENERATION (DOUBLING) TIME
During the
exponential phase
each microorganism is
dividing
at constant intervals.
Thus the population
will double in number
during a specific
length of time called
the generation time or
doubling time.
21. The time it takes a population to double in size—that is, the
mean generation time or mean doubling time (g), can now be
calculated. If the population doubles (t g), then
Nt= 2 N0.
Substitute 2N0 into the mean growth rate equation and solve for
R
R= log2N0- log N0 = log2 + log N0
0.301 g 0.301 g
k= 1/g
The mean generation time is the reciprocal of the mean growth
rate constant. So
g=1/R
The mean generation time (g) can be determined directly from a
semilogarithmic plot of the growth data.
growth rate constant calculated from the g value.
The generation time also may be calculated directly from the
previous equations.
22. 1. Lag-phase: a period of adaptation of inoculated cells to the new
environment; the number of live cells usually decreases,
2. Acceleration phase: cell begin to multiply at an increasing rate,
3. Exponential phase: the number of cells rises exponentially with
time,
4. Deceleration phase: multiplication rate decreases,
5. Stationary phase: multiplication rate is in equilibrium with
death rate,
6. Death phase: which may be subdivided into accelerated death
phase, exponential death phase and death declination phase.
24. 1. The most common mode of cell division in bacteria is
a) Binary fission
b) Transverse binary fission
c) Longitudinal binary fission
d) None of these
2. Physiologically the cells are active and are synthesizing new protoplasm in
which stage of the growth in bacteria
a) Log phase
b) Lag phase
c) Stationary phase
d) None of these
Multiple Choice Questions
25. 3. The most active stage in the sigmoid curve of bacteria in which maximum
growth is attained
a) Lag phase
b) Stationary phase
c) Decline phase
d) Log phase
4. Log-phase is also known as
a) Death phase
b) Exponential phase
c) Lag-phase
d) None
5. The no. of generations per hour in a bacteria is
a) Growth rate
b) Generation time
c) Sigmoid curve
d) None of these
26. 6. A culture of bacteria produces 5 generations in 2 hours. What is the
generation time for this bacterium under those conditions.
a) 15 minutes
b) 24 minutes
c) 30 minutes
d) 75 hours
7. The no. of generations per hour in a bacteria is
a) Growth rate
b) Generation time
c) Sigmoid curve
d) None of these
8. The reproduction rate is equal to death rate in which stage
a) Decline phase
b) Stationary phase
c) Lag phase
d) Log phase
27. 9. If a single bacterium replicated every 30 minutes, how many bacteria would
be present in 2 hours?
a) 16
b) 32
c) 8
d) 4
10. During the lag phase:
a) cells are growing in number.
b) cells are engaged in intense enzymatic activity.
c) changes in pH occur.
d) nutrients are depleted.
e) cells are decreasing in number.
28. REFERENCES
Prescott, L.M., Harley, J.P., Klein, D.A. (2002). Microbiology. Fifth Edition.
Wm. C. Brown Pub. Dubuque, Iowa. pp. 112-125.
Pelczar, M.J., Chan, E.C.S., Krieg, N.R.(1993) Introduction to Microbiology
. Fifth Edition. Tata Mc-Graw – Hill Edition.pp-119-132
Ingraham, J.L. and Ingraham C. A(2008) Introduction to Microbiology.
Third Edition
Modi H.A. (2014) A handbook of Elementary Microbiology .Shanti
Prakashan. pp-203-216
26-02-2021