Download as PDF, PPTX


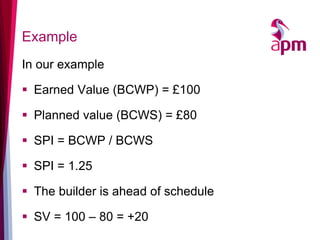
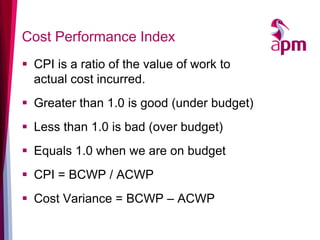
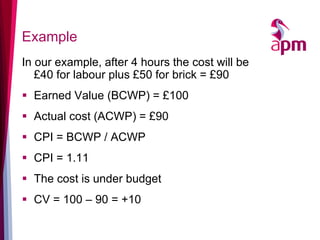
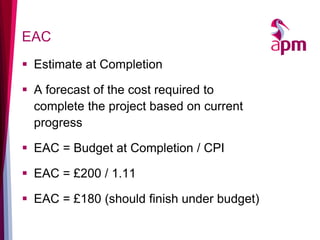
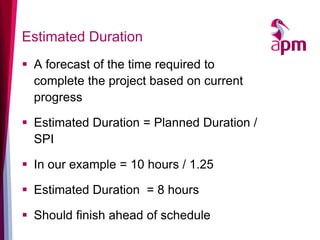
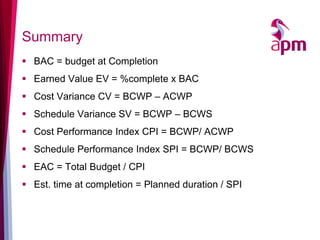
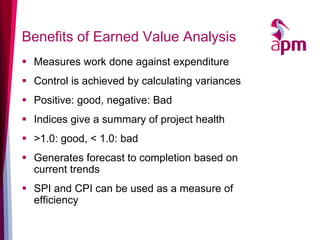
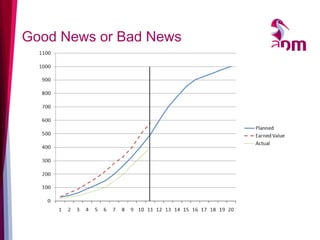
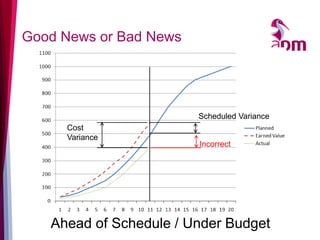
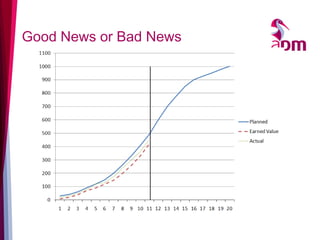

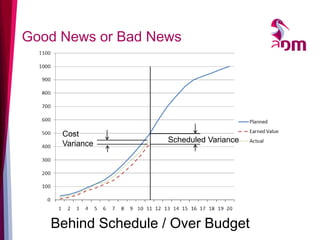
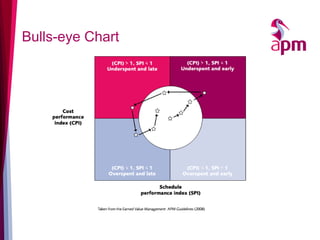
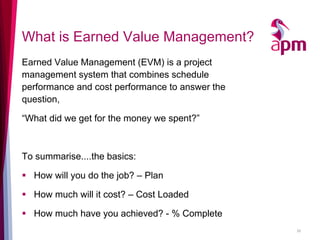


The document outlines the principles and applications of Earned Value Management (EVM), which integrates cost and schedule metrics to assess project performance. Key metrics include Earned Value (EV), Actual Cost (AC), and Planned Value (PV), alongside variance and performance indices such as Schedule Performance Index (SPI) and Cost Performance Index (CPI). EVM enables project teams to make informed decisions regarding financial and scheduling aspects, ultimately aiding in efficient resource utilization and project control.


