Downloaded 408 times


![Earned Value Management (EVM)
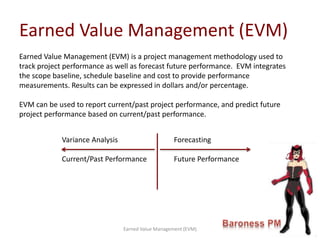
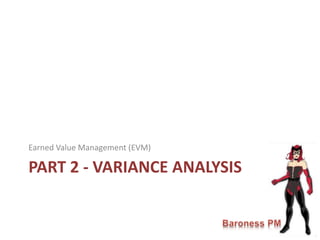
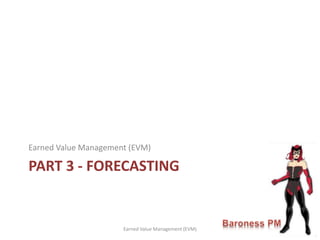
We can also use EVM to forecast future project spending. Estimate at
Completion (EAC) can be calculated using the 3 following methods:
Project will continue to perform at the budgeted rate
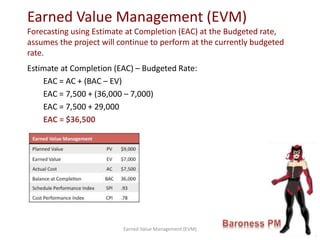
EAC = AC + (BAC – EV)
Budgeted Rate
Current CPI
Current
CPI & SPI
Project will continue to perform at the current CPI:
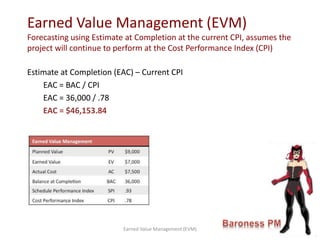
EAC = BAC / CPI
Project will continue to perform at the current
CPI & SPI:
EAC = AC + [(BAC – EV) / (CPI * SPI)]
Earned Value Management (EVM)
Estimate at Completion (EAC)](https://image.slidesharecdn.com/baronesspmearnedvaluemanagement-140309162709-phpapp02/85/Track-Project-Performance-Earned-Value-Management-11-320.jpg)
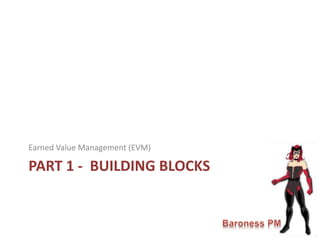
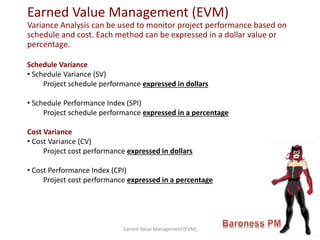
![Estimate at Completion (EAC) – Current CPI & SPI
EAC = AC + [(BAC – EV) / (CPI * SPI)]
EAC = 7,500 + [(36,000 – 7,000) / (.78 * .93)]
EAC = 7,500 + [29,000 / .7254]
EAC = 7,500 + 39,977.94
EAC = 47,477.94
Earned Value Management (EVM)
Forecasting using Estimate at Completion at the current CPI & SPI,
assumes the project will continue to perform at the Cost Performance
Index (CPI) and Schedule Performance Index (SPI)
Earned Value Management (EVM)](https://image.slidesharecdn.com/baronesspmearnedvaluemanagement-140309162709-phpapp02/85/Track-Project-Performance-Earned-Value-Management-14-320.jpg)
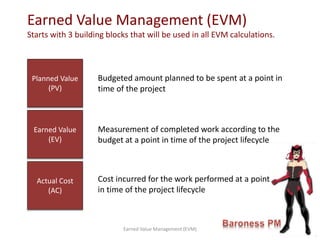
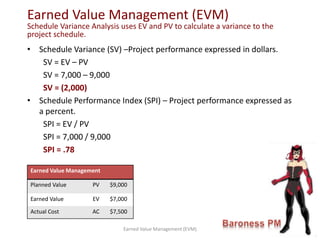
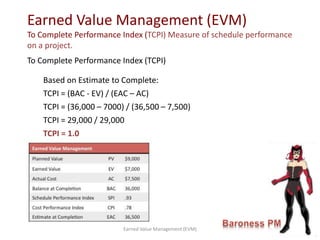
![To Complete Performance Index (TCPI)
Based on Balance at Completion:
TCPI = [(BAC – EV) / (BAC - AC)]
TCPI = [(36,000 – 7,000) / (36,000 – 7,500)]
TCPI = (29,000) / (28,500)
TCPI = 1.01
Earned Value Management (EVM)
Earned Value Management (EVM)
To Complete Performance Index (TCPI) Measure of schedule performance
on a project.](https://image.slidesharecdn.com/baronesspmearnedvaluemanagement-140309162709-phpapp02/85/Track-Project-Performance-Earned-Value-Management-15-320.jpg)
![Earned Value Management (EVM)
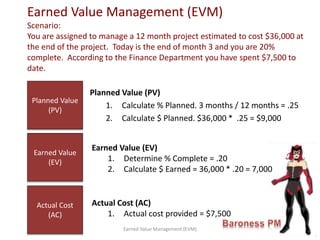
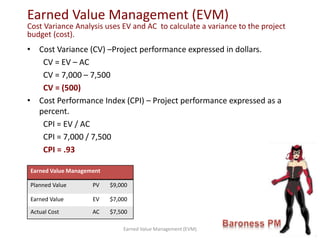
Earned Value Management – Quick Reference
Name Description Equation
Planned Value PV Budgeted amount planned to be spent Budgeted Rate * % Planned
Earned Value EV Measurement of completed work according to
the budget
% Complete * BAC
Actual Cost AC Cost incurred for the work performed
Budget at Completion BAC Total Planned Value for the project
Cost Variance CV The difference in budgeted amount and actual
spend at a given time.
CV = EV - PV
Schedule Variance SV The difference in Planned value and earned
value indicating if the project is ahead or
behind schedule
SV = EV - PV
Variance at Completion VAC The difference between the planned budget at
completion and estimate to complete
VAC = BAC - EAC
Cost Performance Index CPI Measurement of Cost efficiency expressed as a
percentage
CPI = EV / PV
Schedule Performance Index SPI Measurement of schedule efficiency expressed
as a percentage
SPI = EV / PV
Estimate at Completion EAC Estimated cost to complete the project
Based on current CPI
Based on budgeted rate
Based on current CPI & SPI
EAC = BAC/CPI
EAC = AC + (BAC – EV)
EAC = AC + [(BAC – EV) / (CPI * SPI)]
Estimate to Complete ETC Expected cost to complete work remaining ETC = EAC - AC
To Complete Performance Index TCPI Measurement of performance required to
meet the project goals. Expressed as a
percentage.
EAC = AC + [(BAC – EV) / (CPI * SPI)]
TCPI = [(BAC – EV) / (BAC - AC)]](https://image.slidesharecdn.com/baronesspmearnedvaluemanagement-140309162709-phpapp02/85/Track-Project-Performance-Earned-Value-Management-20-320.jpg)

Earned Value Management (EVM) is a project management methodology that tracks project performance and forecasts future performance. It integrates the scope baseline, schedule baseline, and cost to provide performance measurements. EVM uses three building blocks - planned value, earned value, and actual cost - to calculate variances and performance indexes that measure project schedule and cost. Variance analysis and forecasting allow project managers to monitor current performance and predict future outcomes.


