Downloaded 12 times


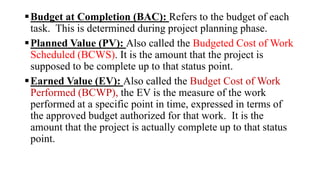
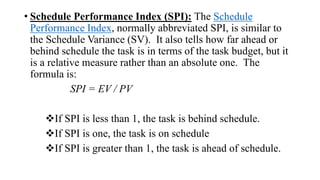
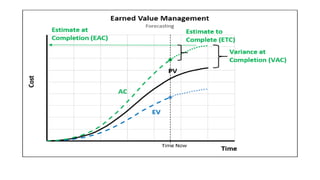
![• Estimate at Completion (EAC): The EAC is the full task or project cost
expected at completion (the new project budget).
It is based on how you expect the future of the performance of the project
to be:
Future performance will be based on the budgeted cost:
EAC = AC + (BAC – EV)
Future cost performance will be based on past cost performance:
EAC = AC + [(BAC – EV) / CPI]
Future cost performance will be influenced by past schedule
performance
EAC = AC + [(BAC -EV) / (CPI x SPI)]
You could also use a combination of the past schedule or cost performance
to extrapolate the final project cost, where
EAC = AC + [(BAC -EV) / (0.8·CPI x 0.2·SPI)]
A new estimate is produced
EAC = AC + ETC](https://image.slidesharecdn.com/projectmonitoringevm-200223170604/85/Project-monitoring-Earned-Value-Analysis-21-320.jpg)
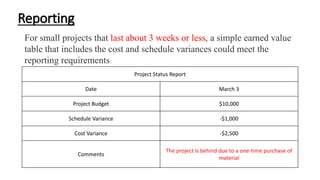
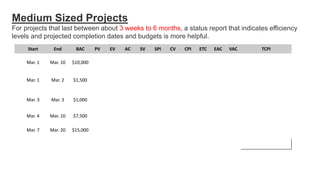


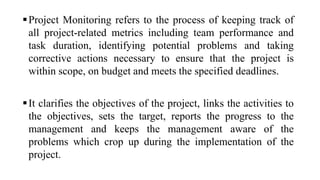
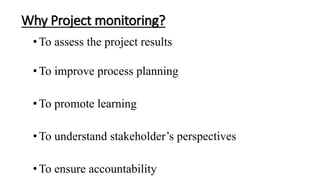
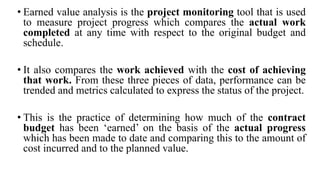
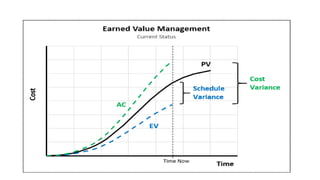
Project monitoring refers to tracking project metrics like team performance, task duration, and identifying potential problems to ensure a project is on schedule, budget, and scope. It clarifies objectives, links activities to objectives, reports progress to management, and alerts managers to issues. Project monitoring assesses results, improves planning, promotes learning, ensures accountability, and answers questions about task progress, unforeseen consequences, team performance, needed changes, and impact on results. Earned value analysis is a monitoring tool that compares planned, actual, and earned values to measure progress and performance through metrics like schedule and cost variances, and indexes. Regular reporting keeps stakeholders informed of project status.