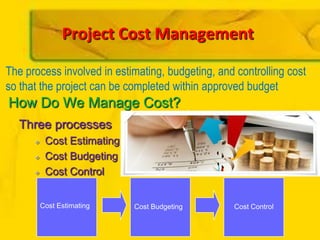
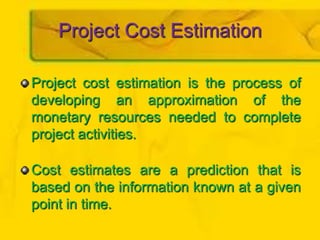
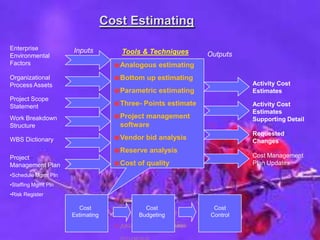
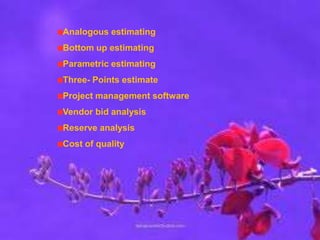
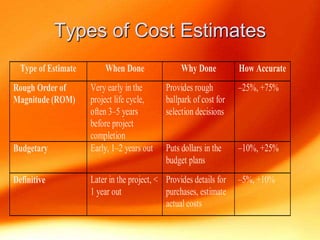
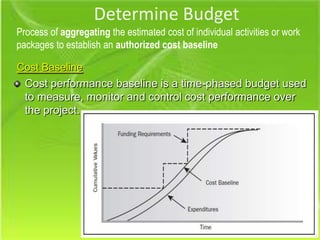
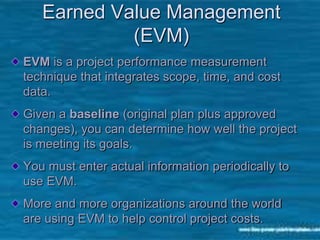
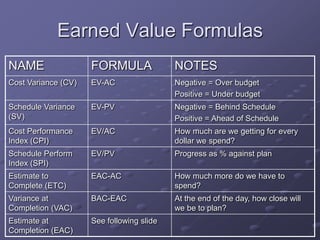
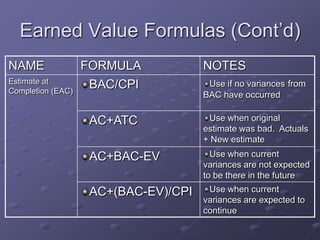
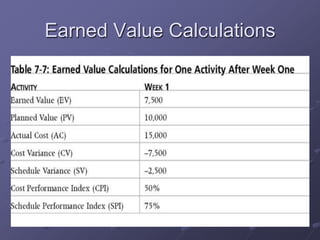
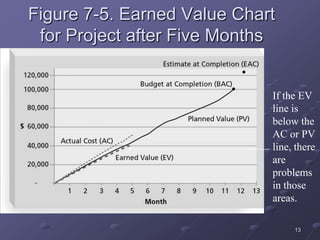
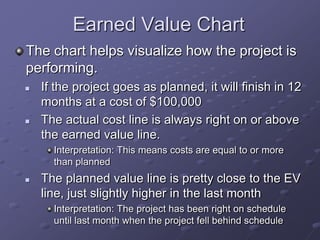
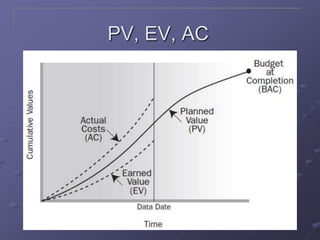
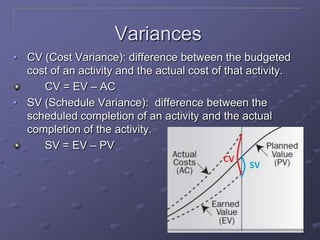
How Do We Manage Cost?
Three processes
 Cost Estimating
 Cost Budgeting
 Cost Control
Cost Estimating Cost Budgeting Cost Control
The process involved in estimating, budgeting, and controlling cost
so that the project can be completed within approved budget
Project Cost Management
Project Cost Estimation
Project cost estimation is the process of
developing an approximation of the
monetary resources needed to complete
project activities.
Cost estimates are a prediction that is
based on the information known at a given
point in time.
Cost Estimating
Enterprise
Environmental
Factors
Organizational
Process Assets
Project Scope
Statement
Analogous estimating
Bottom up estimating
Parametric estimating
Three- Points estimate
Project management
software
Vendor bid analysis
Reserve analysis
Cost of quality
Inputs
OutputsTools & Techniques
Work Breakdown
Structure
WBS Dictionary
Cost
Estimating
Cost
Budgeting
Cost
Control
Project
Management Plan
•Schedule Mgmt Pln
•Staffing Mgmt Pln
•Risk Register
Activity Cost
Estimates
Activity Cost
Estimates
Supporting Detail
Requested
Changes
Cost Management
Plan Updates
Analogous estimating
Bottom up estimating
Parametric estimating
Three- Points estimate
Project management software
Vendor bid analysis
Reserve analysis
Cost of quality
Types of Cost Estimates
Type of Estimate When Done Why Done How Accurate
Rough Order of
Magnitude (ROM)
Very early in the
project life cycle,
often 3–5 years
before project
completion
Provides rough
ballpark of cost for
selection decisions
–25%, +75%
Budgetary Early, 1–2 years out Puts dollars in the
budget plans
–10%, +25%
Definitive Later in the project, <
1 year out
Provides details for
purchases, estimate
actual costs
–5%, +10%
6www.ciklum.net
Cost Baseline
Cost performance baseline is a time-phased budget used
to measure, monitor and control cost performance over
the project.
Determine Budget
Process of aggregating the estimated cost of individual activities or work
packages to establish an authorized cost baseline
Cost control:
Cost control: controlling changes to the project budget
.
Earned value management is an important tool for cost
control
8
Earned Value Management
(EVM)
EVM is a project performance measurement
technique that integrates scope, time, and cost
data.
Given a baseline (original plan plus approved
changes), you can determine how well the project
is meeting its goals.
You must enter actual information periodically to
use EVM.
More and more organizations around the world
are using EVM to help control project costs.
9www.ciklum.net
Earned Value Management
Planned Value, Earned Value, Actual Costs
Variances
Performance Indices
Earned Value Formulas
NAME FORMULA NOTES
Cost Variance (CV) EV-AC Negative = Over budget
Positive = Under budget
Schedule Variance
(SV)
EV-PV Negative = Behind Schedule
Positive = Ahead of Schedule
Cost Performance
Index (CPI)
EV/AC How much are we getting for every
dollar we spend?
Schedule Perform
Index (SPI)
EV/PV Progress as % against plan
Estimate to
Complete (ETC)
EAC-AC How much more do we have to
spend?
Variance at
Completion (VAC)
BAC-EAC At the end of the day, how close will
we be to plan?
Estimate at
Completion (EAC)
See following slide
Earned Value Formulas (Cont’d)
NAME FORMULA NOTES
Estimate at
Completion (EAC)
BAC/CPI Use if no variances from
BAC have occurred
AC+ATC Use when original
estimate was bad. Actuals
+ New estimate
AC+BAC-EV Use when current
variances are not expected
to be there in the future
AC+(BAC-EV)/CPI Use when current
variances are expected to
continue
Earned Value Calculations
13
Figure 7-5. Earned Value Chart
for Project after Five Months
If the EV
line is
below the
AC or PV
line, there
are
problems
in those
areas.
Earned Value Chart
The chart helps visualize how the project is
performing.
 If the project goes as planned, it will finish in 12
months at a cost of $100,000
 The actual cost line is always right on or above
the earned value line.
Interpretation: This means costs are equal to or more
than planned
 The planned value line is pretty close to the EV
line, just slightly higher in the last month
Interpretation: The project has been right on schedule
until last month when the project fell behind schedule
PV, EV, AC
Variances
• CV (Cost Variance): difference between the budgeted
cost of an activity and the actual cost of that activity.
CV = EV – AC
• SV (Schedule Variance): difference between the
scheduled completion of an activity and the actual
completion of the activity.
SV = EV – PV
1
7www.ciklum.net
Performance Indices
• CPI (Cost Performance Index): The cost-efficiency factor
representing the relationship between the actual costs
expended and the value of the physical work performed.
CPI = EV/AC
• SPI (Schedule Performance Index): The schedule
efficiency ratio of earned value accomplished against the
planned value. The SPI describes what portion of the
planned schedule was actually accomplished.
SPI = EV/PV
1
8www.ciklum.net
Forecasting
• Budget at Completion (BAC)
• Forecasted Estimate at Completion (EAC) at the
budgeted rate
EAC = BAC + AC – EV
• Forecasted Estimate at Completion (EAC) at the present
CPI
EAC = BAC / CPI
• To-Complete Performance Index (TCPI) – projection of
cost performance that must be achieved on the remaining
to meet a specified goal
(BAC – EV) / (BAC – AC)
Project cost & control

Project cost & control

  • 1.
    How Do WeManage Cost? Three processes  Cost Estimating  Cost Budgeting  Cost Control Cost Estimating Cost Budgeting Cost Control The process involved in estimating, budgeting, and controlling cost so that the project can be completed within approved budget Project Cost Management
  • 2.
    Project Cost Estimation Projectcost estimation is the process of developing an approximation of the monetary resources needed to complete project activities. Cost estimates are a prediction that is based on the information known at a given point in time.
  • 3.
    Cost Estimating Enterprise Environmental Factors Organizational Process Assets ProjectScope Statement Analogous estimating Bottom up estimating Parametric estimating Three- Points estimate Project management software Vendor bid analysis Reserve analysis Cost of quality Inputs OutputsTools & Techniques Work Breakdown Structure WBS Dictionary Cost Estimating Cost Budgeting Cost Control Project Management Plan •Schedule Mgmt Pln •Staffing Mgmt Pln •Risk Register Activity Cost Estimates Activity Cost Estimates Supporting Detail Requested Changes Cost Management Plan Updates
  • 4.
    Analogous estimating Bottom upestimating Parametric estimating Three- Points estimate Project management software Vendor bid analysis Reserve analysis Cost of quality
  • 5.
    Types of CostEstimates Type of Estimate When Done Why Done How Accurate Rough Order of Magnitude (ROM) Very early in the project life cycle, often 3–5 years before project completion Provides rough ballpark of cost for selection decisions –25%, +75% Budgetary Early, 1–2 years out Puts dollars in the budget plans –10%, +25% Definitive Later in the project, < 1 year out Provides details for purchases, estimate actual costs –5%, +10%
  • 6.
    6www.ciklum.net Cost Baseline Cost performancebaseline is a time-phased budget used to measure, monitor and control cost performance over the project. Determine Budget Process of aggregating the estimated cost of individual activities or work packages to establish an authorized cost baseline
  • 7.
    Cost control: Cost control:controlling changes to the project budget . Earned value management is an important tool for cost control
  • 8.
    8 Earned Value Management (EVM) EVMis a project performance measurement technique that integrates scope, time, and cost data. Given a baseline (original plan plus approved changes), you can determine how well the project is meeting its goals. You must enter actual information periodically to use EVM. More and more organizations around the world are using EVM to help control project costs.
  • 9.
    9www.ciklum.net Earned Value Management PlannedValue, Earned Value, Actual Costs Variances Performance Indices
  • 10.
    Earned Value Formulas NAMEFORMULA NOTES Cost Variance (CV) EV-AC Negative = Over budget Positive = Under budget Schedule Variance (SV) EV-PV Negative = Behind Schedule Positive = Ahead of Schedule Cost Performance Index (CPI) EV/AC How much are we getting for every dollar we spend? Schedule Perform Index (SPI) EV/PV Progress as % against plan Estimate to Complete (ETC) EAC-AC How much more do we have to spend? Variance at Completion (VAC) BAC-EAC At the end of the day, how close will we be to plan? Estimate at Completion (EAC) See following slide
  • 11.
    Earned Value Formulas(Cont’d) NAME FORMULA NOTES Estimate at Completion (EAC) BAC/CPI Use if no variances from BAC have occurred AC+ATC Use when original estimate was bad. Actuals + New estimate AC+BAC-EV Use when current variances are not expected to be there in the future AC+(BAC-EV)/CPI Use when current variances are expected to continue
  • 12.
  • 13.
    13 Figure 7-5. EarnedValue Chart for Project after Five Months If the EV line is below the AC or PV line, there are problems in those areas.
  • 14.
    Earned Value Chart Thechart helps visualize how the project is performing.  If the project goes as planned, it will finish in 12 months at a cost of $100,000  The actual cost line is always right on or above the earned value line. Interpretation: This means costs are equal to or more than planned  The planned value line is pretty close to the EV line, just slightly higher in the last month Interpretation: The project has been right on schedule until last month when the project fell behind schedule
  • 15.
  • 16.
    Variances • CV (CostVariance): difference between the budgeted cost of an activity and the actual cost of that activity. CV = EV – AC • SV (Schedule Variance): difference between the scheduled completion of an activity and the actual completion of the activity. SV = EV – PV
  • 17.
    1 7www.ciklum.net Performance Indices • CPI(Cost Performance Index): The cost-efficiency factor representing the relationship between the actual costs expended and the value of the physical work performed. CPI = EV/AC • SPI (Schedule Performance Index): The schedule efficiency ratio of earned value accomplished against the planned value. The SPI describes what portion of the planned schedule was actually accomplished. SPI = EV/PV
  • 18.
    1 8www.ciklum.net Forecasting • Budget atCompletion (BAC) • Forecasted Estimate at Completion (EAC) at the budgeted rate EAC = BAC + AC – EV • Forecasted Estimate at Completion (EAC) at the present CPI EAC = BAC / CPI • To-Complete Performance Index (TCPI) – projection of cost performance that must be achieved on the remaining to meet a specified goal (BAC – EV) / (BAC – AC)

Editor's Notes

  • #5 Funding requirements – “triggers” to fund the project.
  • #6 LC Costing – looking at the cost of the whole lifecycle of the product, not only cost of the projectValue Analysis – finding a less costly way to do the same workCost Risk
  • #7 Funding requirements – “triggers” to fund the project.
  • #8 LC Costing – looking at the cost of the whole lifecycle of the product, not only cost of the projectValue Analysis – finding a less costly way to do the same workCost Risk
  • #9 LC Costing – looking at the cost of the whole lifecycle of the product, not only cost of the projectValue Analysis – finding a less costly way to do the same workCost Risk
  • #10 LC Costing – looking at the cost of the whole lifecycle of the product, not only cost of the projectValue Analysis – finding a less costly way to do the same workCost Risk