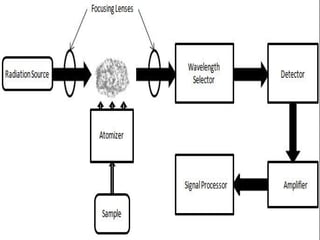
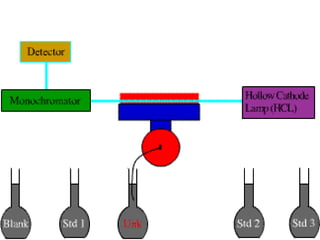
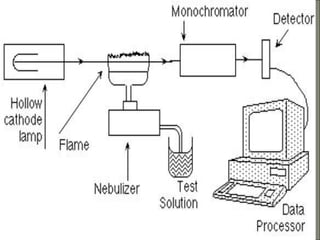
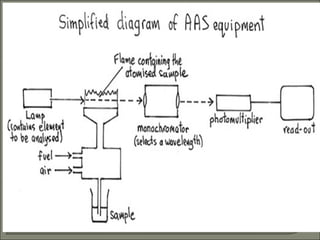
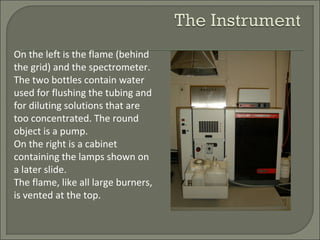
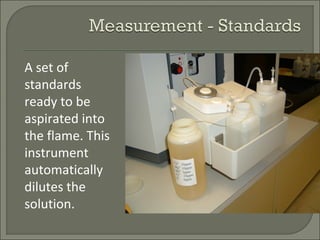
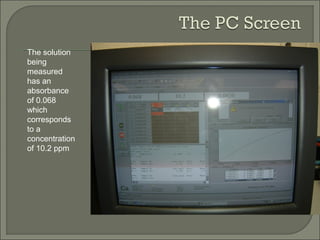
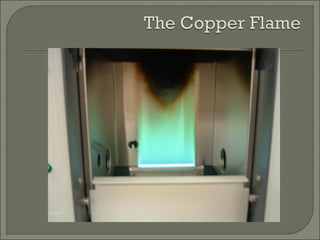
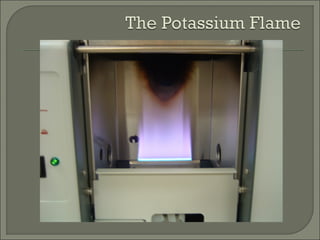
VIJAY
JRF
GITAM UNIVERSITY
The instrument consists of:
1. A flame
2. Lamps to produce the correct wavelength
of light
3. A detector
4. A system to aspirate solutions into the
flame
5. A computer to control the experiment
On the left is the flame (behind
the grid) and the spectrometer.
The two bottles contain water
used for flushing the tubing and
for diluting solutions that are
too concentrated. The round
object is a pump.
On the right is a cabinet
containing the lamps shown on
a later slide.
The flame, like all large burners,
is vented at the top.
From bottom to top,
the lamps are for Mg,
Ca, K, and a
combination of Fe,
Co, Ni, Mn, Cu, and
Cr. Each element uses
a specific wavelength
of light.
The flame is with
only water being
aspirated.
The two holes, left
and right, are
where the light
beam enters and
leaves after passing
through the flame.
The dark place at
the top is a stain
from the heat of
the flame.
Current spectrometers use a PC Computer to control the
experment.
There needs to be standards (solutions of known
concentration) to calibrate the instrument.
The experiment must be setup in the program controlling
the experiment with
 Ions to be analyzed
 Concentration of the standards
 Number of points to be measured
 Wavelength of light
 Lamp Position
A set of
standards
ready to be
aspirated into
the flame. This
instrument
automatically
dilutes the
solution.
A sample of
maple
syrup ready
to be
aspirated
into the
flame.
The solution
being
measured
has an
absorbance
of 0.068
which
corresponds
to a
concentration
of 10.2 ppm
The following slides show the colors of
different ions in the flame.The
differences in intensity of the colors is, in
part, due to differences in concentration.
The calcium
flame is
red. This is
intensely
red
because
the calcium
content is
high.
The computer stores the data which can be
printed.
The experiment can be set up to show the
calibration curve and the concentrations
on the screen.To get reliable
concentrations, the program must be told
what fitting algorithm to use. As can be
seen on the screen shown previously, the
calibration data are not linear in that
instance.
 Please give your valuable comments
 vijayhemmadi@gmail.com

Atomic absorption spectrometer

  • 1.
  • 6.
    The instrument consistsof: 1. A flame 2. Lamps to produce the correct wavelength of light 3. A detector 4. A system to aspirate solutions into the flame 5. A computer to control the experiment
  • 7.
    On the leftis the flame (behind the grid) and the spectrometer. The two bottles contain water used for flushing the tubing and for diluting solutions that are too concentrated. The round object is a pump. On the right is a cabinet containing the lamps shown on a later slide. The flame, like all large burners, is vented at the top.
  • 8.
    From bottom totop, the lamps are for Mg, Ca, K, and a combination of Fe, Co, Ni, Mn, Cu, and Cr. Each element uses a specific wavelength of light.
  • 9.
    The flame iswith only water being aspirated. The two holes, left and right, are where the light beam enters and leaves after passing through the flame. The dark place at the top is a stain from the heat of the flame.
  • 10.
    Current spectrometers usea PC Computer to control the experment. There needs to be standards (solutions of known concentration) to calibrate the instrument. The experiment must be setup in the program controlling the experiment with  Ions to be analyzed  Concentration of the standards  Number of points to be measured  Wavelength of light  Lamp Position
  • 11.
    A set of standards readyto be aspirated into the flame. This instrument automatically dilutes the solution.
  • 12.
    A sample of maple syrupready to be aspirated into the flame.
  • 13.
    The solution being measured has an absorbance of0.068 which corresponds to a concentration of 10.2 ppm
  • 14.
    The following slidesshow the colors of different ions in the flame.The differences in intensity of the colors is, in part, due to differences in concentration.
  • 15.
    The calcium flame is red.This is intensely red because the calcium content is high.
  • 20.
    The computer storesthe data which can be printed. The experiment can be set up to show the calibration curve and the concentrations on the screen.To get reliable concentrations, the program must be told what fitting algorithm to use. As can be seen on the screen shown previously, the calibration data are not linear in that instance.
  • 21.
     Please giveyour valuable comments  vijayhemmadi@gmail.com