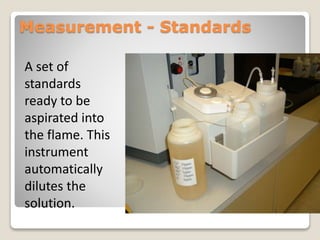
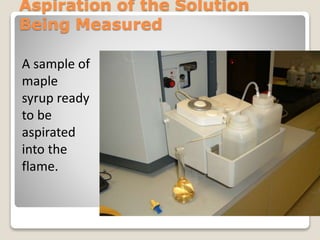
Atomic Absorption
Spectrometer
Subject: Pharmaceutical Analysis III
Presented by
Mr. P. R. Jadhav
Asst. Prof.
 Learning objectives
 To learn about the Quantitative analysis of
Trace metals.
 To learn the Instrumentation system of
Atomic Absorption Spectroscopy.
 To learn the conversion of Analyte solution
to gaseous atoms.
 Applications of Atomic Absorption
Spectroscopy.
The Instrument
The instrument consists of:
1. A flame
2. Lamps to produce the correct wavelength of
light
3. A detector
4. A system to aspirate solutions into the
flame
5. A computer to control the experiment
The Instrument
On the left is the flame (behind
the grid) and the spectrometer.
The two bottles contain water
used for flushing the tubing and
for diluting solutions that are
too concentrated. The round
object is a pump.
On the right is a cabinet
containing the lamps shown on
a later slide.
The flame, like all large burners,
is vented at the top.
The Lamps
From bottom to top,
the lamps are for Mg,
Ca, K, and a
combination of Fe,
Co, Ni, Mn, Cu, and Cr.
Each element uses a
specific wavelength of
light.
The Flame
The flame is with
only water being
aspirated.
The two holes, left
and right, are
where the light
beam enters and
leaves after passing
through the flame.
The dark place at
the top is a stain
from the heat of
the flame.
The Instrument
Current spectrometers use a PC Computer to
control the experment.
There needs to be standards (solutions of known
concentration) to calibrate the instrument.
The experiment must be setup in the program
controlling the experiment with
 Ions to be analyzed
 Concentration of the standards
 Number of points to be measured
 Wavelength of light
 Lamp Position
Measurement - Standards
A set of
standards
ready to be
aspirated into
the flame. This
instrument
automatically
dilutes the
solution.
Aspiration of the Solution
Being Measured
A sample of
maple
syrup ready
to be
aspirated
into the
flame.
The PC Screen
The solution
being
measured
has an
absorbance
of 0.068
which
corresponds
to a
concentration
of 10.2 ppm
The following slides show the colors of
different ions in the flame. The differences
in intensity of the colors is, in part, due to
differences in concentration.
The Calcium Flame
The calcium
flame is
red. This is
intensely
red
because
the calcium
content is
high.
The Copper Flame
The Potassium Flame
The Manganese Flame
The Cobalt Flame
Results
The computer stores the data which can be
printed.
The experiment can be set up to show the
calibration curve and the concentrations on
the screen. To get reliable concentrations, the
program must be told what fitting algorithm
to use. As can be seen on the screen shown
previously, the calibration data are not linear
in that instance.

Atomic absorption spectrometer

  • 1.
    Atomic Absorption Spectrometer Subject: PharmaceuticalAnalysis III Presented by Mr. P. R. Jadhav Asst. Prof.
  • 2.
     Learning objectives To learn about the Quantitative analysis of Trace metals.  To learn the Instrumentation system of Atomic Absorption Spectroscopy.  To learn the conversion of Analyte solution to gaseous atoms.  Applications of Atomic Absorption Spectroscopy.
  • 3.
    The Instrument The instrumentconsists of: 1. A flame 2. Lamps to produce the correct wavelength of light 3. A detector 4. A system to aspirate solutions into the flame 5. A computer to control the experiment
  • 4.
    The Instrument On theleft is the flame (behind the grid) and the spectrometer. The two bottles contain water used for flushing the tubing and for diluting solutions that are too concentrated. The round object is a pump. On the right is a cabinet containing the lamps shown on a later slide. The flame, like all large burners, is vented at the top.
  • 5.
    The Lamps From bottomto top, the lamps are for Mg, Ca, K, and a combination of Fe, Co, Ni, Mn, Cu, and Cr. Each element uses a specific wavelength of light.
  • 6.
    The Flame The flameis with only water being aspirated. The two holes, left and right, are where the light beam enters and leaves after passing through the flame. The dark place at the top is a stain from the heat of the flame.
  • 7.
    The Instrument Current spectrometersuse a PC Computer to control the experment. There needs to be standards (solutions of known concentration) to calibrate the instrument. The experiment must be setup in the program controlling the experiment with  Ions to be analyzed  Concentration of the standards  Number of points to be measured  Wavelength of light  Lamp Position
  • 8.
    Measurement - Standards Aset of standards ready to be aspirated into the flame. This instrument automatically dilutes the solution.
  • 9.
    Aspiration of theSolution Being Measured A sample of maple syrup ready to be aspirated into the flame.
  • 10.
    The PC Screen Thesolution being measured has an absorbance of 0.068 which corresponds to a concentration of 10.2 ppm
  • 11.
    The following slidesshow the colors of different ions in the flame. The differences in intensity of the colors is, in part, due to differences in concentration.
  • 12.
    The Calcium Flame Thecalcium flame is red. This is intensely red because the calcium content is high.
  • 13.
  • 14.
  • 15.
  • 16.
  • 17.
    Results The computer storesthe data which can be printed. The experiment can be set up to show the calibration curve and the concentrations on the screen. To get reliable concentrations, the program must be told what fitting algorithm to use. As can be seen on the screen shown previously, the calibration data are not linear in that instance.