Downloaded 313 times


![Accelerated idioventricular rhythm[AIR]
AIR competes with the sinus rhythm.
Wide QRS complexes at a rate of 110
beats/min fuse ( F ) with the sinus
rhythm, which takes control briefly,
generates the narrow QRS
complexes, and then yields once
again to the accelerated
idioventricular rhythm as the P
waves move “in and out” of the QRS
complex. This example of
isorhythmic AV dissociation may be
caused by hemodynamic modulation
of the sinus rate via the autonomic
nervous system.](https://image.slidesharecdn.com/arrhythmias-180510125346/75/Arrhythmias-53-2048.jpg)


![Torsade's de pointes
• A young boy with congenital
long-QT syndrome
• The QTU interval in the sinus
beats is at least 600
milliseconds. Note the TU wave
alternans in the first and second
complexes. A late premature
complex occurring in the
downslope of the TU wave
initiates an episode of VT[R-ON-
T]](https://image.slidesharecdn.com/arrhythmias-180510125346/75/Arrhythmias-67-2048.jpg)


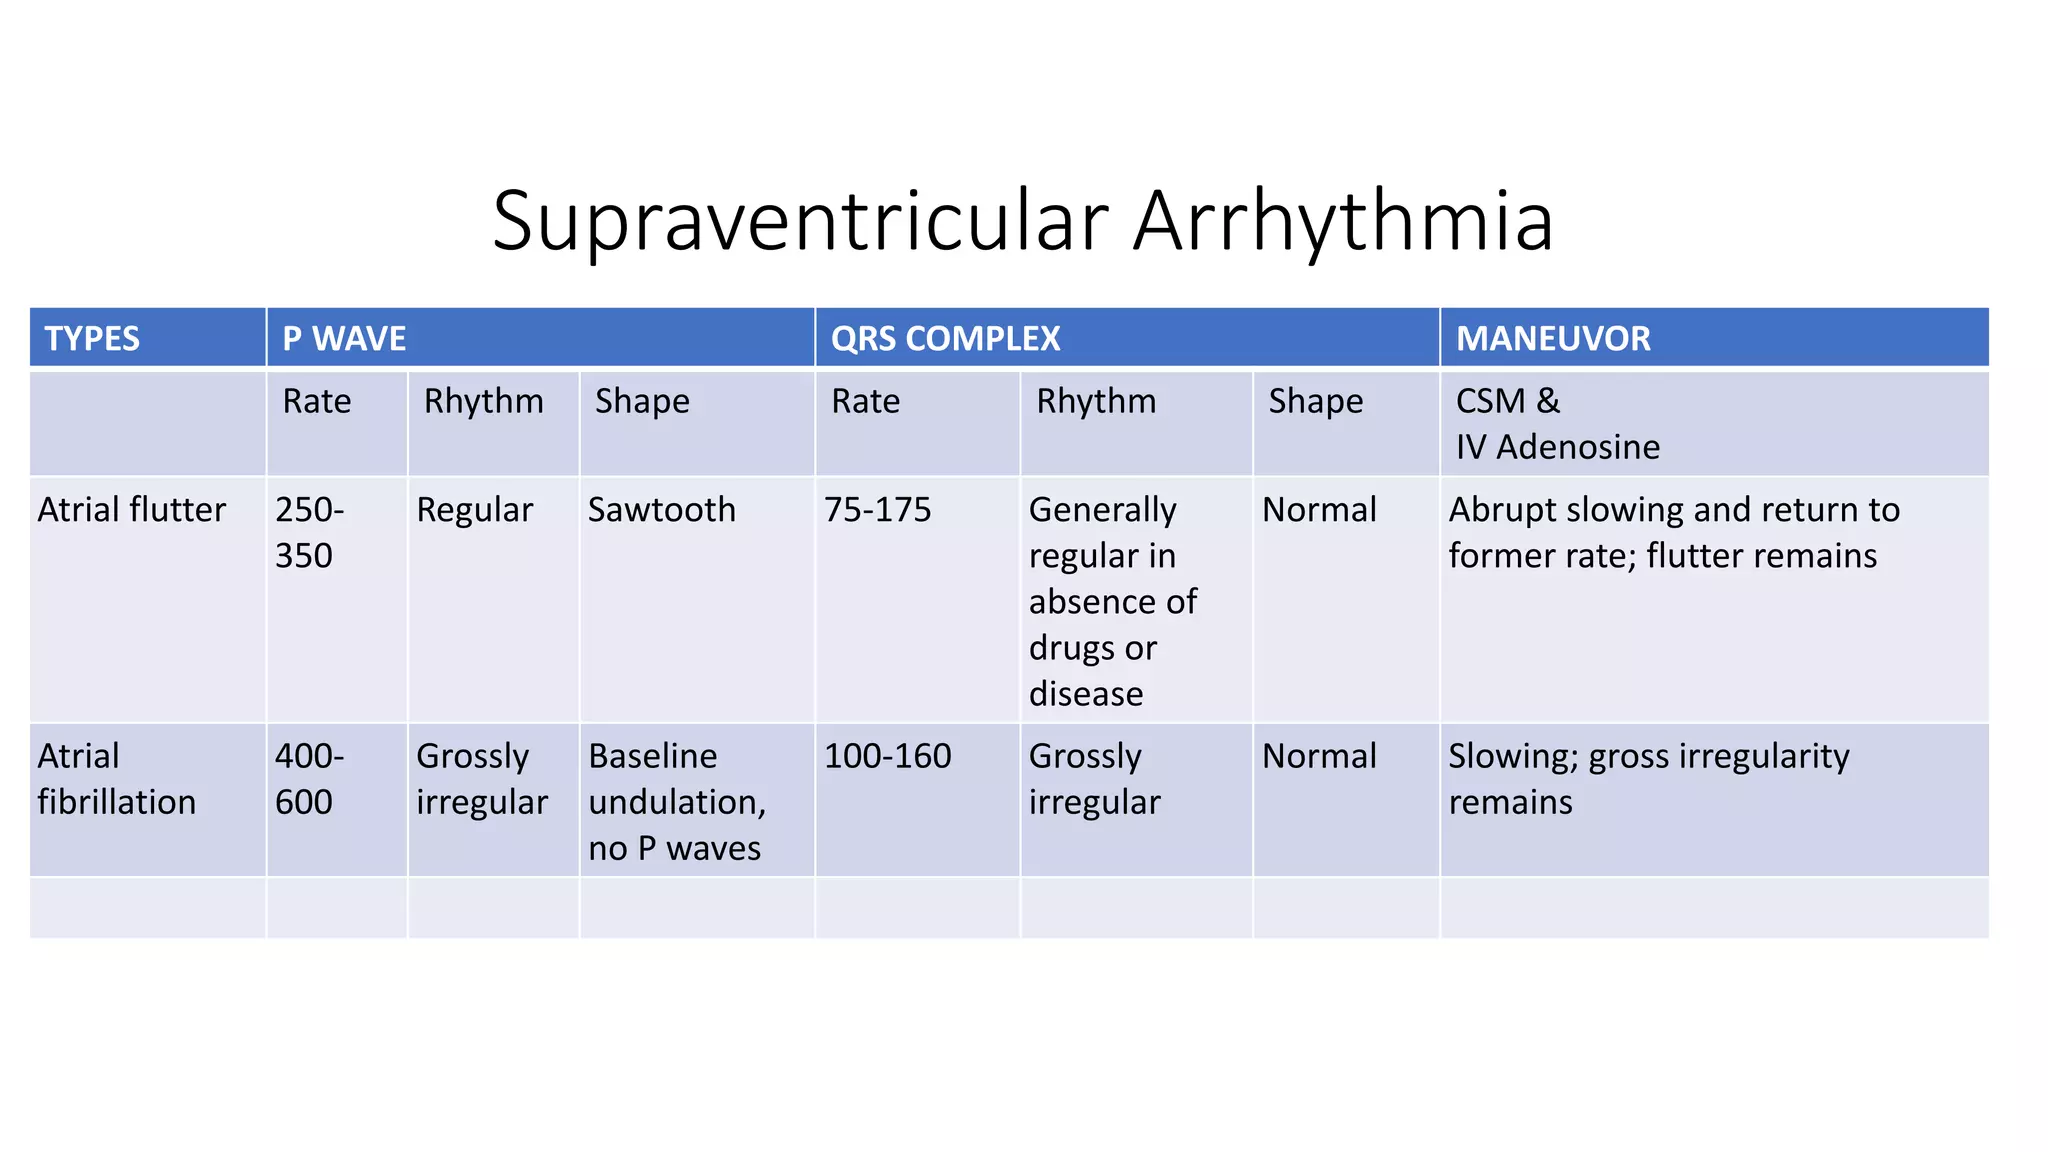
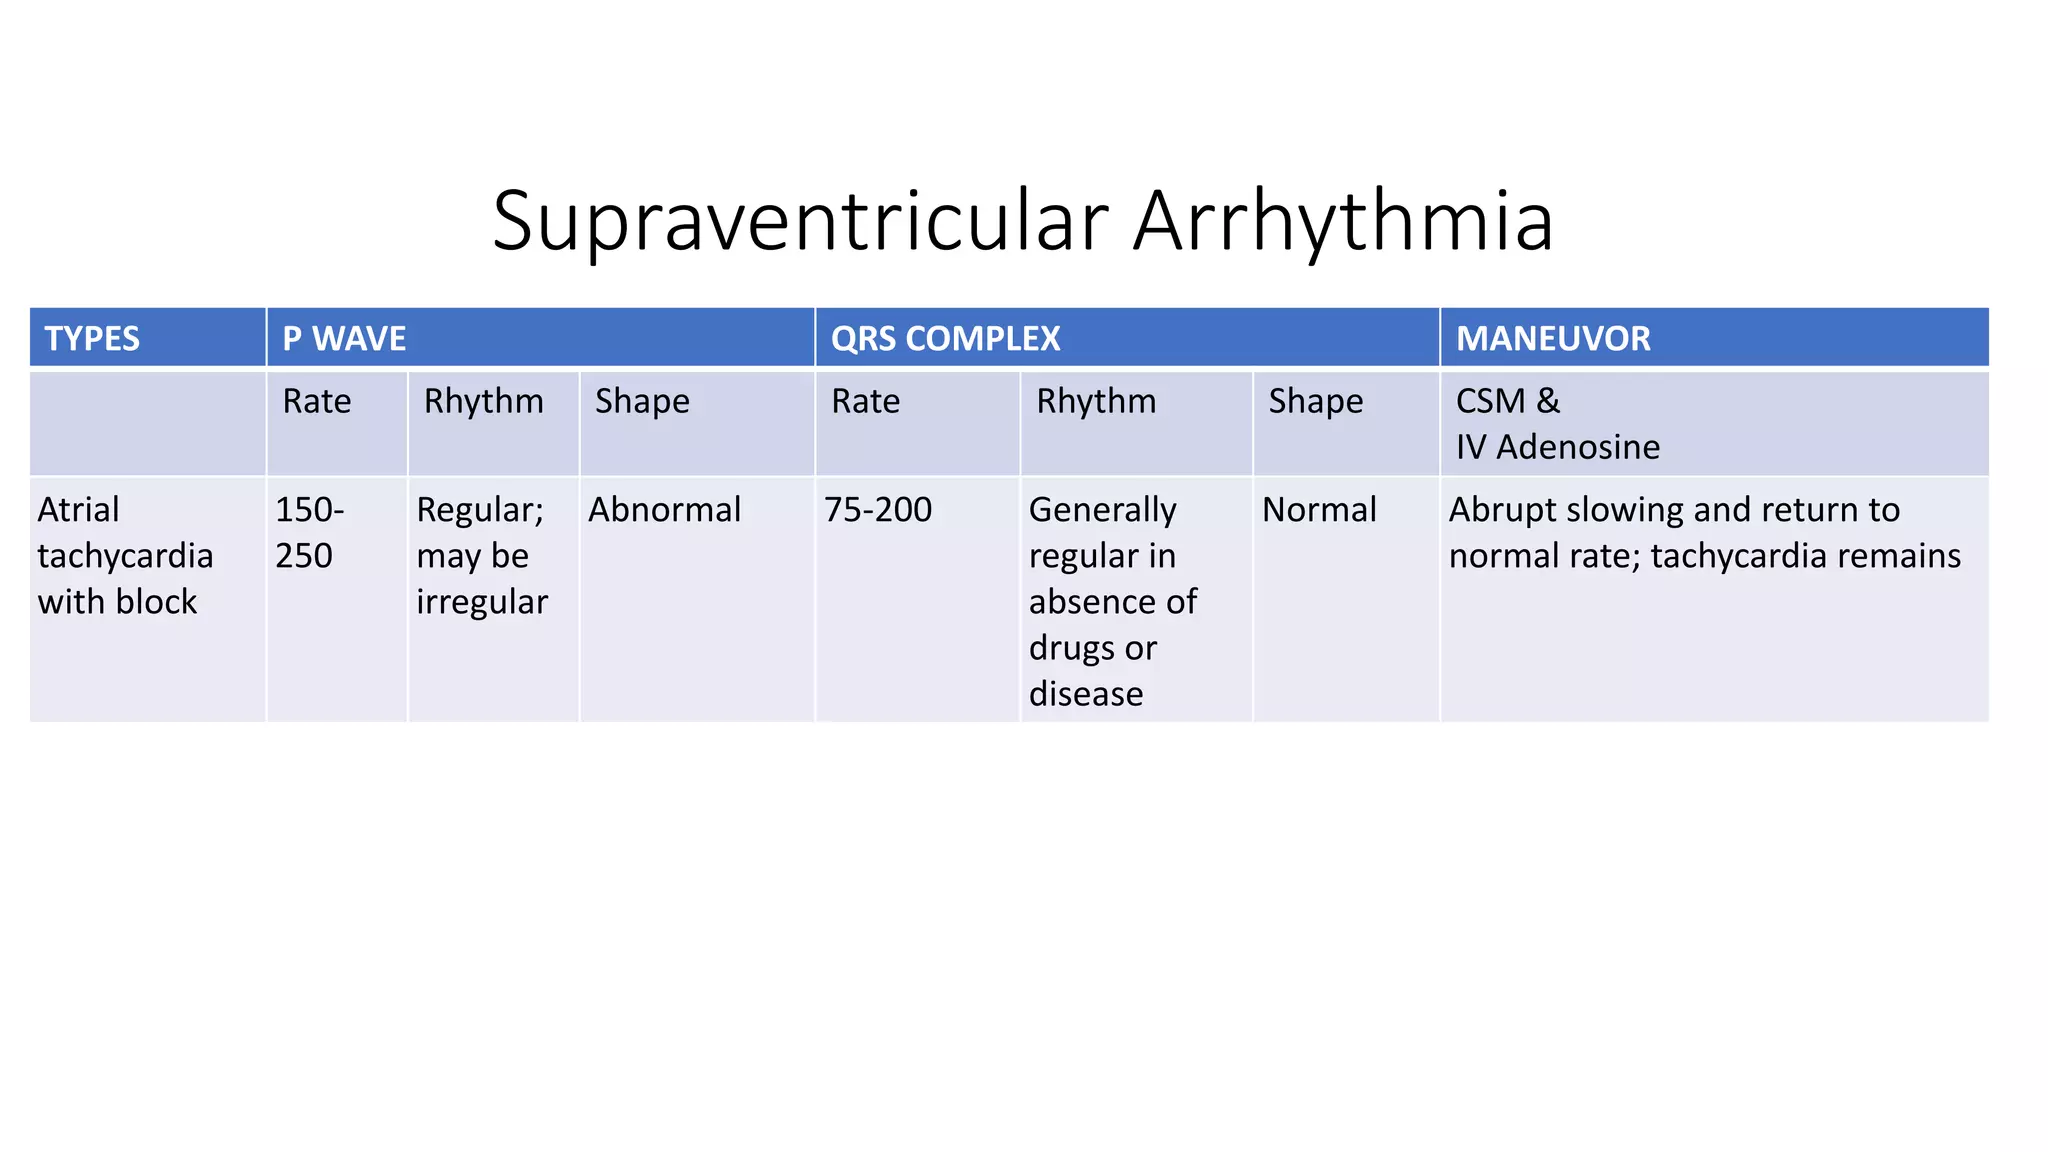
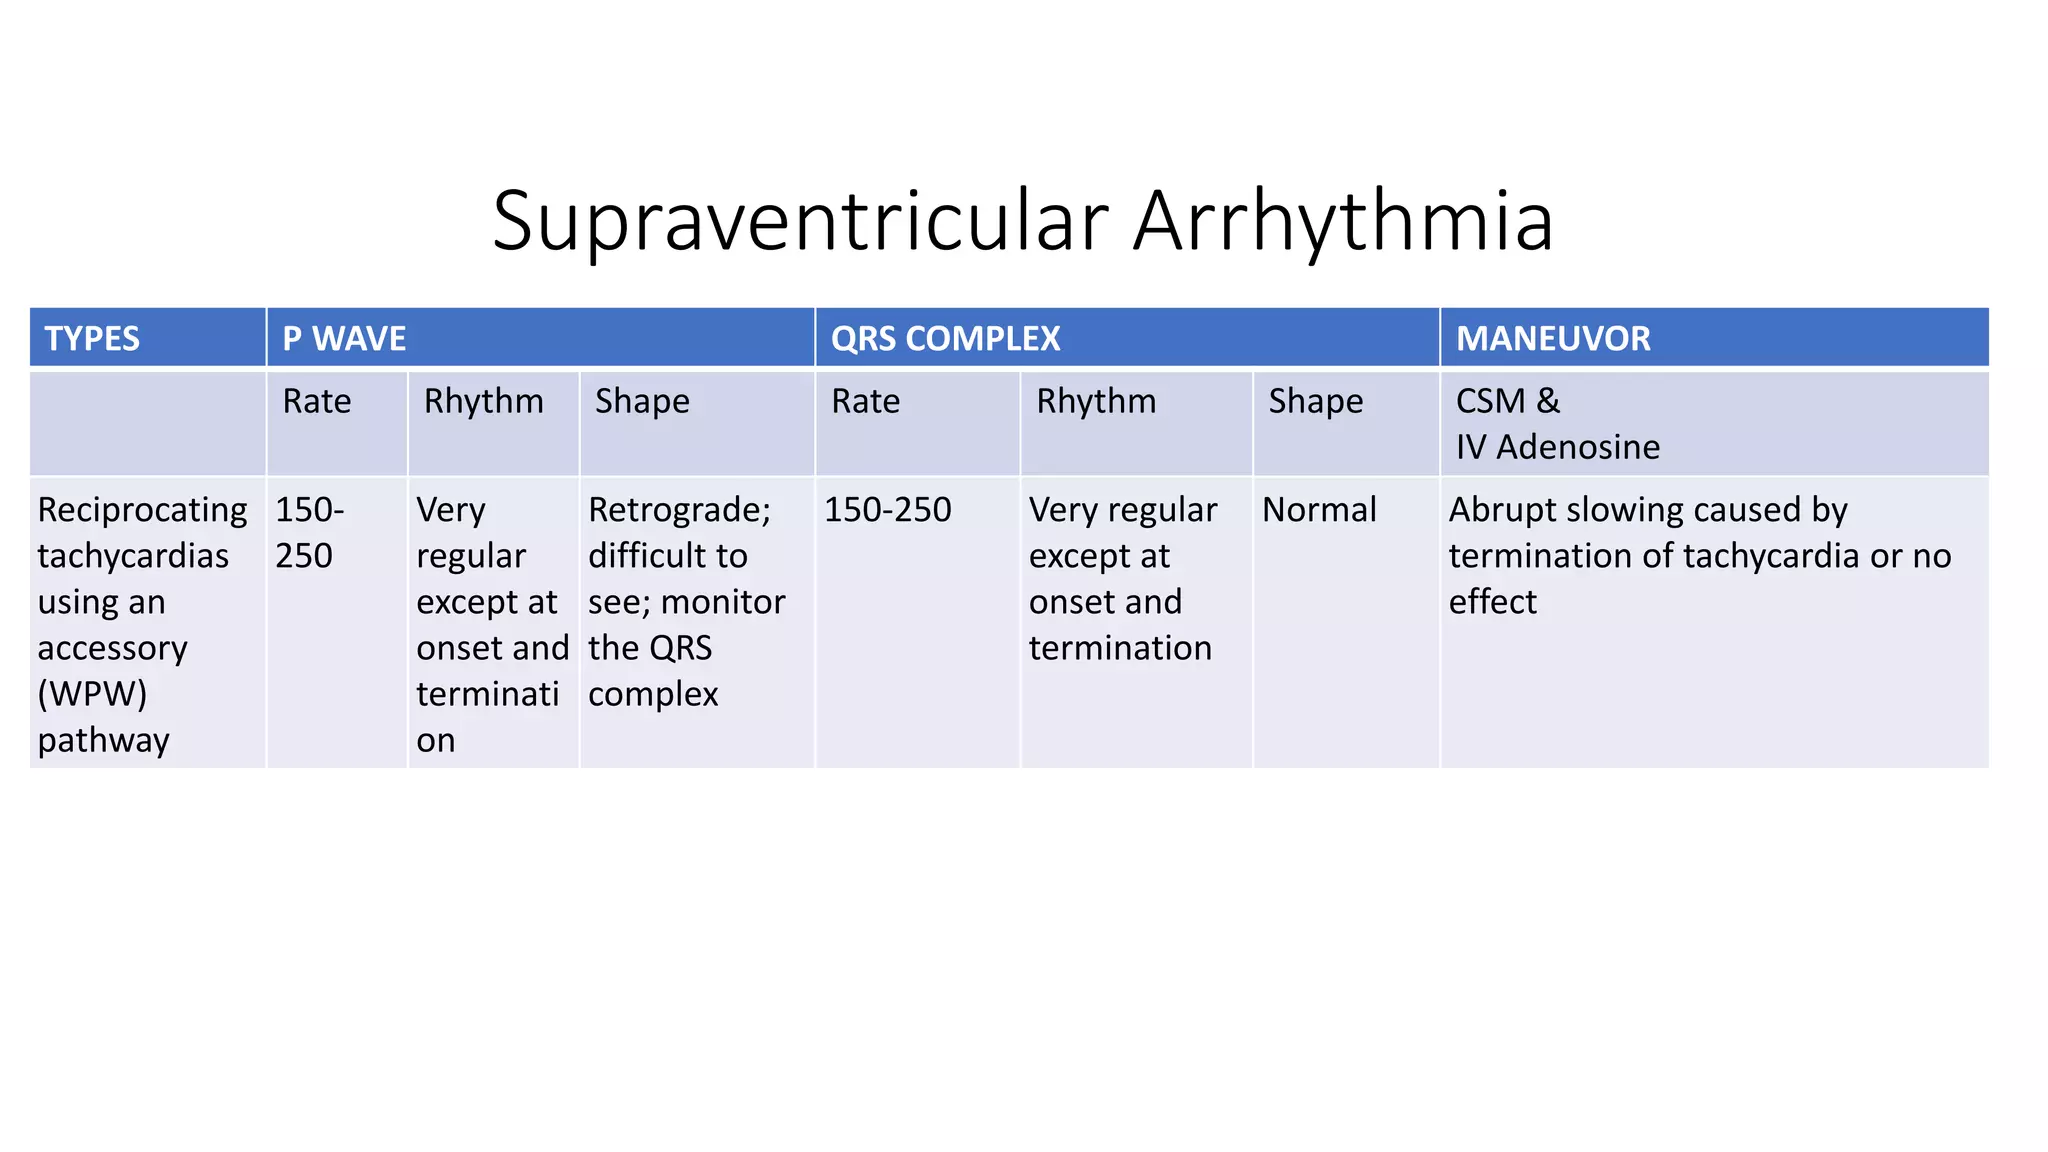
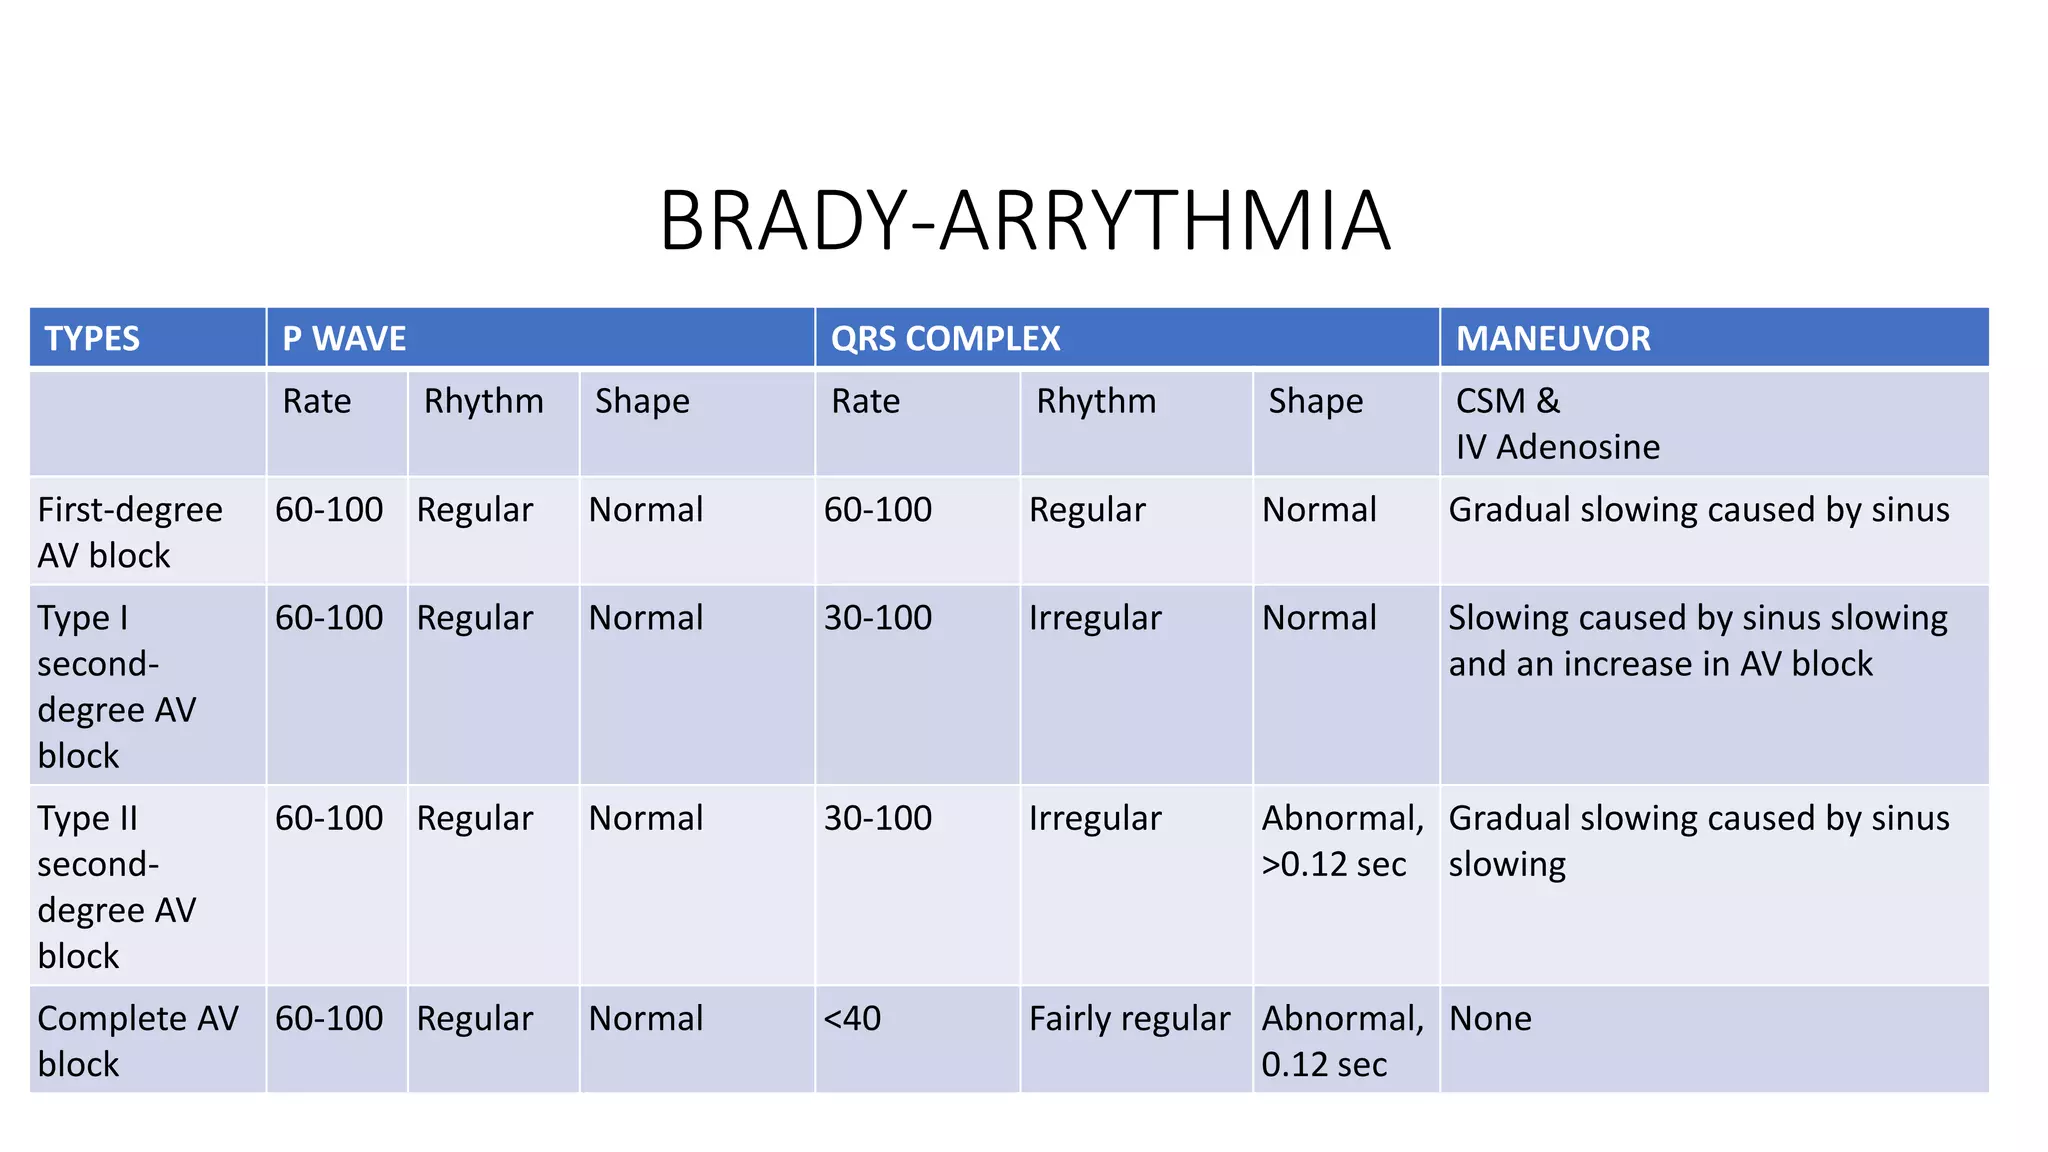
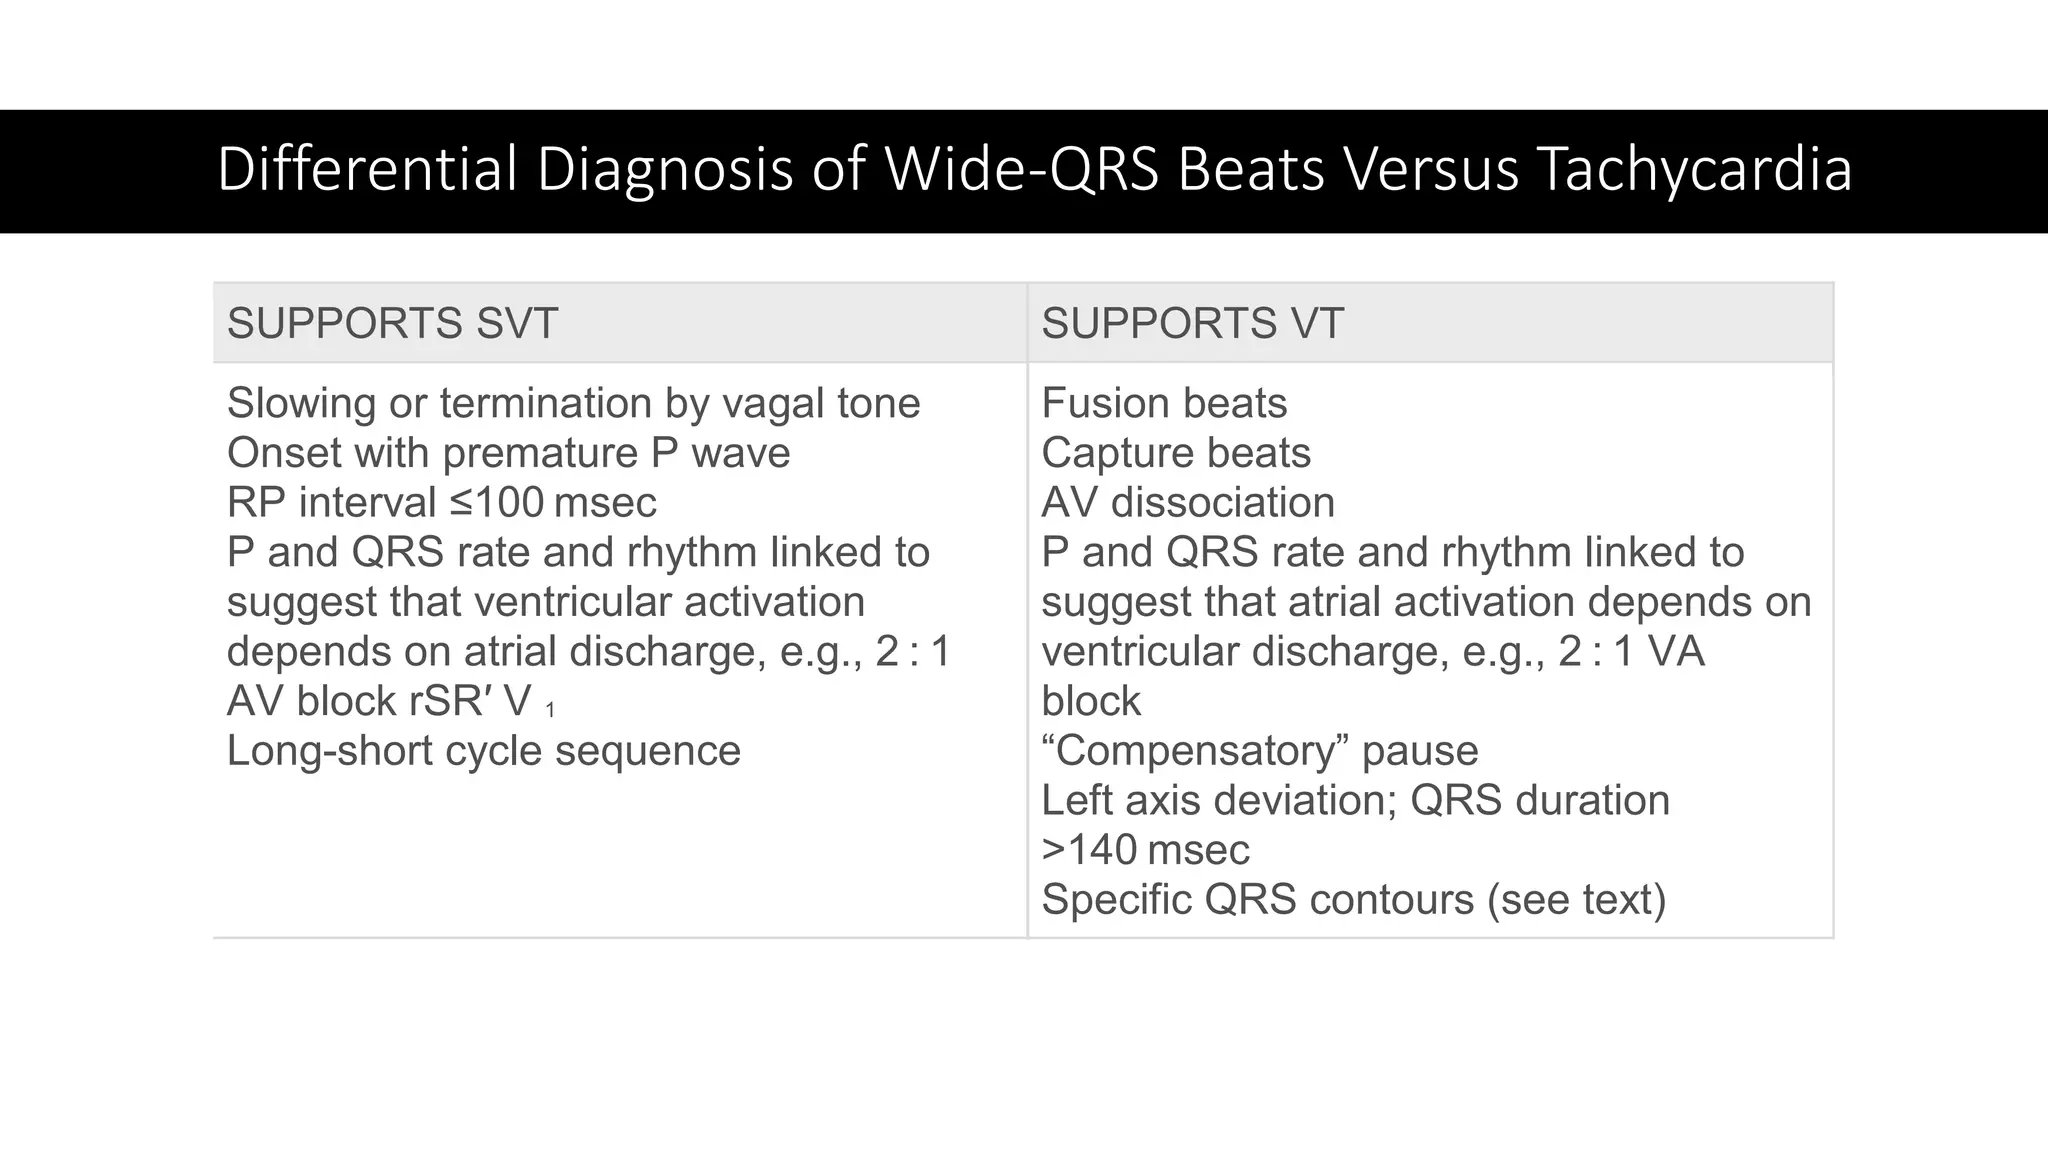
The document provides a comprehensive overview of various types of cardiac arrhythmias, detailing their characteristics, including rates, rhythms, and morphologies associated with P waves and QRS complexes. It discusses supraventricular and ventricular arrhythmias, heart blocks, and diagnostic techniques, integrating examples of electrocardiographic (ECG) changes and implications for treatment. Each type of arrhythmia is outlined with specific parameters for diagnosis and potential treatment options.