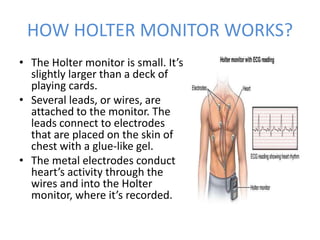
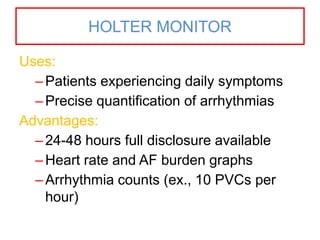
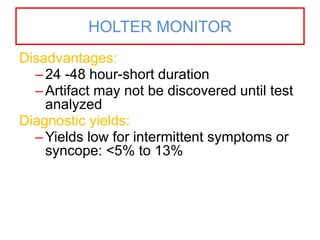
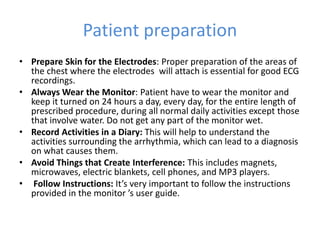
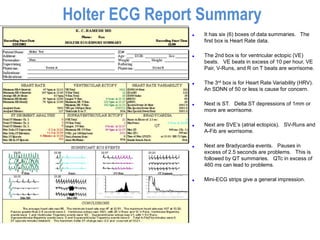
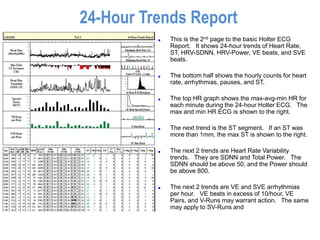
Holter Monitoring
Dr. KAZI ALAM NOWAZ
MD FINAL PART STUDENT CARDIOLOGY
NHFH & RI
WHAT IS HOLTER
MONITOR?
• A Holter monitor is a small, wearable device
that keeps track of heart rhythm.
• A Holter monitor uses electrodes and a
recording device to track heart's rhythm for
24 to 72 hours.
• Holter monitor testing is also sometimes
called ambulatory electrocardiograph
• Dr. Norman Holter introduced portable
devices to record the ECG in 1957
THE EVOLUTION OF OUTPATIENT
AMBULATORY CARDIAC MONITORING
Different types of ambulatory
electrocardiogram monitoring
• Holter monitors
• Event monitors
• Ambulatory real-time cardiac monitors
• Adhesive patch electrocardiographic monitors
• Implantable loop recorders
ACC/AHA Guidelines for
Ambulatory Electrocardiography
CLASS I
• Patients with unexplained syncope, near syncope,
or episodic dizziness in whom the cause is not
obvious
• Patients with unexplained recurrent palpitations
• To assess antiarrhythmic drug response in
individuals with well-characterized arrhythmias
• To aid in the evaluation of pacemaker and ICD
function and guide pharmacologic therapy in
patients receiving frequent ICD therapy
HOW HOLTER MONITOR WORKS?
• The Holter monitor is small. It’s
slightly larger than a deck of
playing cards.
• Several leads, or wires, are
attached to the monitor. The
leads connect to electrodes
that are placed on the skin of
chest with a glue-like gel.
• The metal electrodes conduct
heart’s activity through the
wires and into the Holter
monitor, where it’s recorded.
Uses:
–Patients experiencing daily symptoms
–Precise quantification of arrhythmias
Advantages:
–24-48 hours full disclosure available
–Heart rate and AF burden graphs
–Arrhythmia counts (ex., 10 PVCs per
hour)
HOLTER MONITOR
Disadvantages:
–24 -48 hour-short duration
–Artifact may not be discovered until test
analyzed
Diagnostic yields:
–Yields low for intermittent symptoms or
syncope: <5% to 13%. Chest 1980;78:456-461.
HOLTER MONITOR
Patient preparation
• Prepare Skin for the Electrodes: Proper preparation of the areas of
the chest where the electrodes will attach is essential for good ECG
recordings.
• Always Wear the Monitor: Patient have to wear the monitor and
keep it turned on 24 hours a day, every day, for the entire length of
prescribed procedure, during all normal daily activities except those
that involve water. Do not get any part of the monitor wet.
• Record Activities in a Diary: This will help to understand the
activities surrounding the arrhythmia, which can lead to a diagnosis
on what causes them.
• Avoid Things that Create Interference: This includes magnets,
microwaves, electric blankets, cell phones, and MP3 players.
• Follow Instructions: It’s very important to follow the instructions
provided in the monitor ’s user guide.
Findings we look
• Heart rate histogram
• Bradycardia events
• Ectopic beat / episode counter:
narrow complex, broad complex premature beats,
couplets, triplets, VT, SVT episodes, Pauses
• ST T changes
• QTc QT analysis
• Heart rate variability
• Rhythm strips
• Sleep apnea 24 hour trend
* DM Software 11
Holter ECG Report Summary
■ It has six (6) boxes of data summaries. The
first box is Heart Rate data.
■ The 2nd box is for ventricular ectopic (VE)
beats. VE beats in excess of 10 per hour, VE
Pair, V-Runs, and R on T beats are worrisome.
■ The 3rd box is for Heart Rate Variability (HRV).
An SDNN of 50 or less is cause for concern.
■ Next is ST. Delta ST depressions of 1mm or
more are worrisome.
■ Next are SVE’s (atrial ectopics). SV-Runs and
A-Fib are worrisome.
■ Next are Bradycardia events. Pauses in
excess of 2.5 seconds are problems. This is
followed by QT summaries. QTc in excess of
460 ms can lead to problems.
■ Mini-ECG strips give a general impression.
* DM Software 12
24-Hour Trends Report
■ This is the 2nd page to the basic Holter ECG
Report. It shows 24-hour trends of Heart Rate,
ST, HRV-SDNN, HRV-Power, VE beats, and SVE
beats.
■ The bottom half shows the hourly counts for heart
rate, arrhythmias, pauses, and ST.
■ The top HR graph shows the max-avg-min HR for
each minute during the 24-hour Holter ECG. The
max and min HR ECG is shown to the right.
■ The next trend is the ST segment. If an ST was
more than 1mm, the max ST is shown to the right.
■ The next 2 trends are Heart Rate Variability
trends. They are SDNN and Total Power. The
SDNN should be above 50, and the Power should
be above 800.
■ The next 2 trends are VE and SVE arrhythmias
per hour. VE beats in excess of 10/hour, VE
Pairs, and V-Runs may warrant action. The same
may apply to SV-Runs and A-Fib minutes.
Arrhythmias that are not necessarily
pathologic.
• Sinus bradycardia during rest or sleep
• Sinus arrhythmia with pauses less than 2.5
seconds
• Sinoatrial exit block
• Wenckebach atrioventricular (AV) block
• Wandering atrial pacemaker
• Junctional escape complexes
• Premature atrial or ventricular complexes.
Arrhythmias that are warning
• Frequent and complex atrial and ventricular
rhythm disturbances
• Second-degree AV block type II
• Third-degree AV block
• Sinus pauses longer than 2.5 seconds
• Marked bradycardia during waking hours
• Tachyarrhythmias
What is the role of holter monitoring
in patients with
known ischemic heart disease?
• In the post–myocardial infarction patient, the
occurrence of frequent PVCs (more than 10
per hour) and nonsustained ventricular
tachycardia (VT) by 24-hour monitoring is
associated with a 1.5- to 2.0-fold increase in
death during the 2- to 5-year follow-up
independent of LV function.
Diagnosis of suspected ischemic heart
disease?
• Transient ST-segment depression 0.1 mV or
greater for more than 30 seconds is rare in
normal subjects and correlates strongly with
myocardial perfusion scans that show regional
ischemia.
• Although some monitors can detect and
quantify ST-segment changes
Role of holter monitoring in stroke
• Approximately 25% of stroke remains
unexplained after a thorough clinical
evaluation and is labeled as cryptogenic
• Occult atrial fibrillation is identified by
ambulatory monitoring in approximately, 3%
to 8% of patients with cryptogenic stroke
Pacemaker
• The Pacemaker report shows the
following:
* Paced Beat Total
* Intrinsic Beat Total
* % Paced
* % Intrinsic
Pacemaker Failures:
* Failures to Capture
* Failures to Sense
* Beats < Lower HR Limit
* Beats > Upper HR Limit
* R-R Intervals > 1.5 seconds
Arrhythmia analysis for VE and SVE beats
is performed on Intrinsic (normal) beats.
The arrhythmia analysis includes VE Pairs,
V-Runs, and SV-Runs.
All reported “Pacemaker Failures” should
be immediately evaluated by a
cardiologist.
THANKS TO ALL

Holter

  • 1.
    Holter Monitoring Dr. KAZIALAM NOWAZ MD FINAL PART STUDENT CARDIOLOGY NHFH & RI
  • 2.
    WHAT IS HOLTER MONITOR? •A Holter monitor is a small, wearable device that keeps track of heart rhythm. • A Holter monitor uses electrodes and a recording device to track heart's rhythm for 24 to 72 hours. • Holter monitor testing is also sometimes called ambulatory electrocardiograph
  • 3.
    • Dr. NormanHolter introduced portable devices to record the ECG in 1957 THE EVOLUTION OF OUTPATIENT AMBULATORY CARDIAC MONITORING
  • 4.
    Different types ofambulatory electrocardiogram monitoring • Holter monitors • Event monitors • Ambulatory real-time cardiac monitors • Adhesive patch electrocardiographic monitors • Implantable loop recorders
  • 5.
    ACC/AHA Guidelines for AmbulatoryElectrocardiography CLASS I • Patients with unexplained syncope, near syncope, or episodic dizziness in whom the cause is not obvious • Patients with unexplained recurrent palpitations • To assess antiarrhythmic drug response in individuals with well-characterized arrhythmias • To aid in the evaluation of pacemaker and ICD function and guide pharmacologic therapy in patients receiving frequent ICD therapy
  • 6.
    HOW HOLTER MONITORWORKS? • The Holter monitor is small. It’s slightly larger than a deck of playing cards. • Several leads, or wires, are attached to the monitor. The leads connect to electrodes that are placed on the skin of chest with a glue-like gel. • The metal electrodes conduct heart’s activity through the wires and into the Holter monitor, where it’s recorded.
  • 7.
    Uses: –Patients experiencing dailysymptoms –Precise quantification of arrhythmias Advantages: –24-48 hours full disclosure available –Heart rate and AF burden graphs –Arrhythmia counts (ex., 10 PVCs per hour) HOLTER MONITOR
  • 8.
    Disadvantages: –24 -48 hour-shortduration –Artifact may not be discovered until test analyzed Diagnostic yields: –Yields low for intermittent symptoms or syncope: <5% to 13%. Chest 1980;78:456-461. HOLTER MONITOR
  • 9.
    Patient preparation • PrepareSkin for the Electrodes: Proper preparation of the areas of the chest where the electrodes will attach is essential for good ECG recordings. • Always Wear the Monitor: Patient have to wear the monitor and keep it turned on 24 hours a day, every day, for the entire length of prescribed procedure, during all normal daily activities except those that involve water. Do not get any part of the monitor wet. • Record Activities in a Diary: This will help to understand the activities surrounding the arrhythmia, which can lead to a diagnosis on what causes them. • Avoid Things that Create Interference: This includes magnets, microwaves, electric blankets, cell phones, and MP3 players. • Follow Instructions: It’s very important to follow the instructions provided in the monitor ’s user guide.
  • 10.
    Findings we look •Heart rate histogram • Bradycardia events • Ectopic beat / episode counter: narrow complex, broad complex premature beats, couplets, triplets, VT, SVT episodes, Pauses • ST T changes • QTc QT analysis • Heart rate variability • Rhythm strips • Sleep apnea 24 hour trend
  • 11.
    * DM Software11 Holter ECG Report Summary ■ It has six (6) boxes of data summaries. The first box is Heart Rate data. ■ The 2nd box is for ventricular ectopic (VE) beats. VE beats in excess of 10 per hour, VE Pair, V-Runs, and R on T beats are worrisome. ■ The 3rd box is for Heart Rate Variability (HRV). An SDNN of 50 or less is cause for concern. ■ Next is ST. Delta ST depressions of 1mm or more are worrisome. ■ Next are SVE’s (atrial ectopics). SV-Runs and A-Fib are worrisome. ■ Next are Bradycardia events. Pauses in excess of 2.5 seconds are problems. This is followed by QT summaries. QTc in excess of 460 ms can lead to problems. ■ Mini-ECG strips give a general impression.
  • 12.
    * DM Software12 24-Hour Trends Report ■ This is the 2nd page to the basic Holter ECG Report. It shows 24-hour trends of Heart Rate, ST, HRV-SDNN, HRV-Power, VE beats, and SVE beats. ■ The bottom half shows the hourly counts for heart rate, arrhythmias, pauses, and ST. ■ The top HR graph shows the max-avg-min HR for each minute during the 24-hour Holter ECG. The max and min HR ECG is shown to the right. ■ The next trend is the ST segment. If an ST was more than 1mm, the max ST is shown to the right. ■ The next 2 trends are Heart Rate Variability trends. They are SDNN and Total Power. The SDNN should be above 50, and the Power should be above 800. ■ The next 2 trends are VE and SVE arrhythmias per hour. VE beats in excess of 10/hour, VE Pairs, and V-Runs may warrant action. The same may apply to SV-Runs and A-Fib minutes.
  • 13.
    Arrhythmias that arenot necessarily pathologic. • Sinus bradycardia during rest or sleep • Sinus arrhythmia with pauses less than 2.5 seconds • Sinoatrial exit block • Wenckebach atrioventricular (AV) block • Wandering atrial pacemaker • Junctional escape complexes • Premature atrial or ventricular complexes.
  • 14.
    Arrhythmias that arewarning • Frequent and complex atrial and ventricular rhythm disturbances • Second-degree AV block type II • Third-degree AV block • Sinus pauses longer than 2.5 seconds • Marked bradycardia during waking hours • Tachyarrhythmias
  • 15.
    What is therole of holter monitoring in patients with known ischemic heart disease? • In the post–myocardial infarction patient, the occurrence of frequent PVCs (more than 10 per hour) and nonsustained ventricular tachycardia (VT) by 24-hour monitoring is associated with a 1.5- to 2.0-fold increase in death during the 2- to 5-year follow-up independent of LV function.
  • 16.
    Diagnosis of suspectedischemic heart disease? • Transient ST-segment depression 0.1 mV or greater for more than 30 seconds is rare in normal subjects and correlates strongly with myocardial perfusion scans that show regional ischemia. • Although some monitors can detect and quantify ST-segment changes
  • 17.
    Role of holtermonitoring in stroke • Approximately 25% of stroke remains unexplained after a thorough clinical evaluation and is labeled as cryptogenic • Occult atrial fibrillation is identified by ambulatory monitoring in approximately, 3% to 8% of patients with cryptogenic stroke
  • 18.
    Pacemaker • The Pacemakerreport shows the following: * Paced Beat Total * Intrinsic Beat Total * % Paced * % Intrinsic Pacemaker Failures: * Failures to Capture * Failures to Sense * Beats < Lower HR Limit * Beats > Upper HR Limit * R-R Intervals > 1.5 seconds Arrhythmia analysis for VE and SVE beats is performed on Intrinsic (normal) beats. The arrhythmia analysis includes VE Pairs, V-Runs, and SV-Runs. All reported “Pacemaker Failures” should be immediately evaluated by a cardiologist.
  • 19.