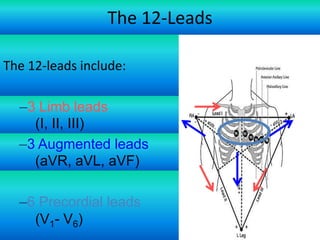
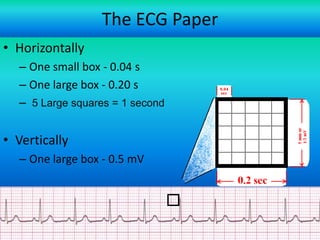
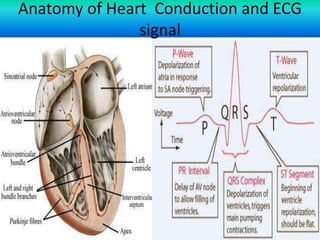
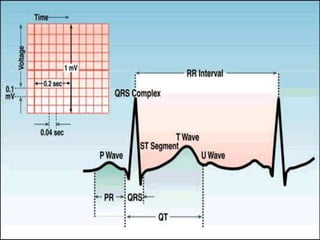
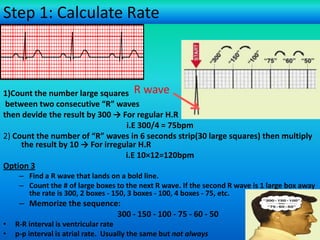
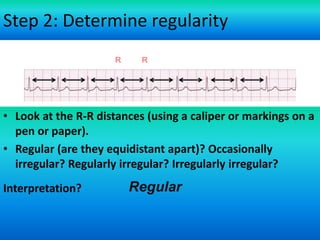
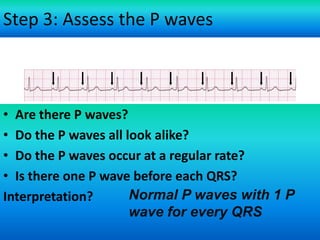
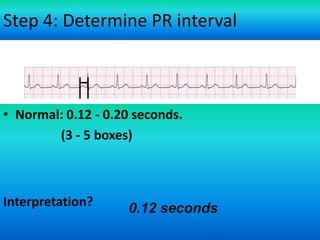
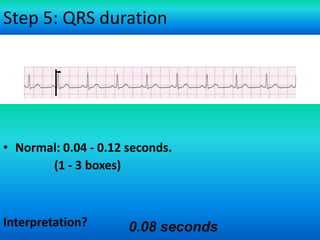
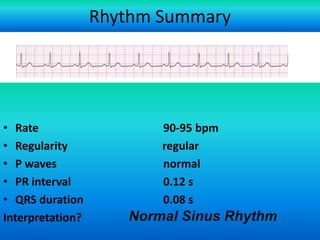
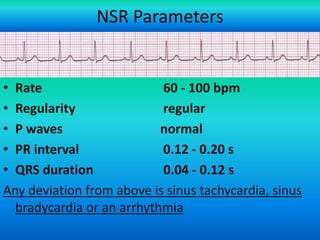
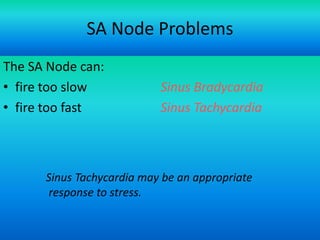
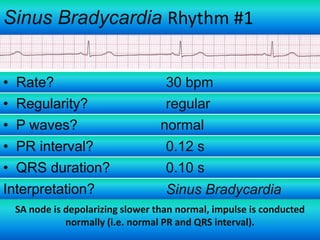
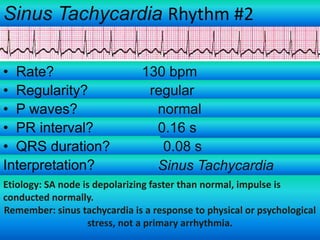
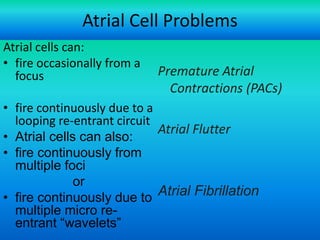
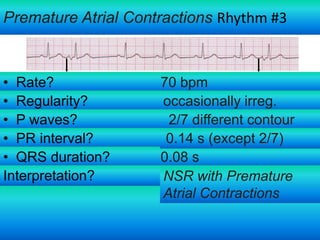
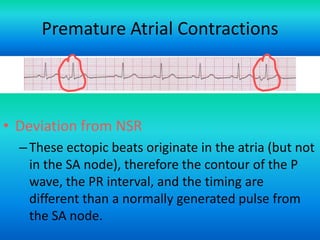
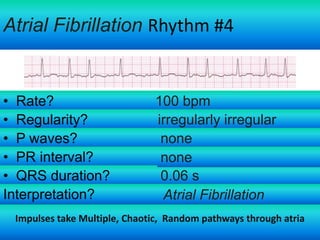
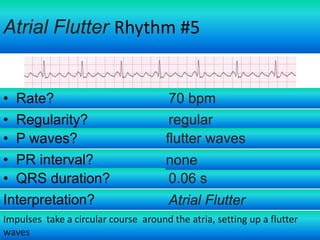
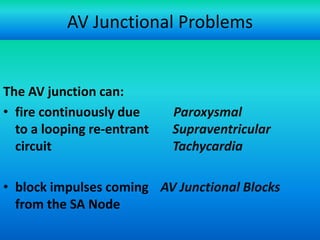
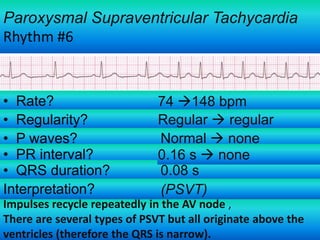
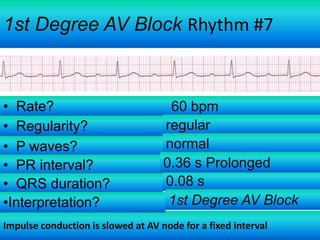
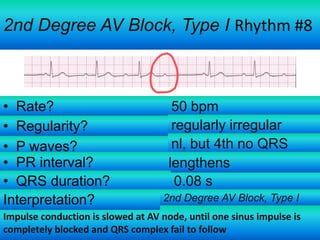
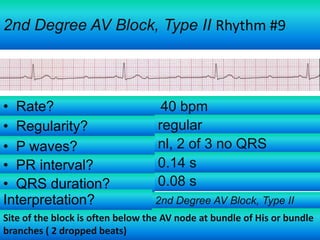
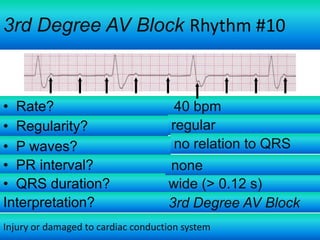
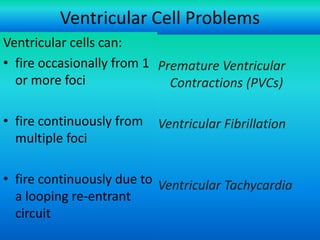
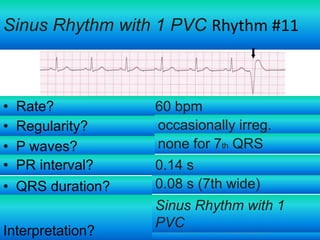
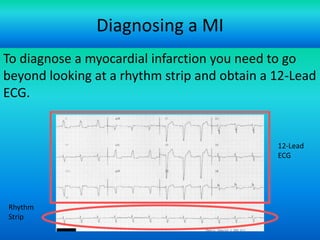
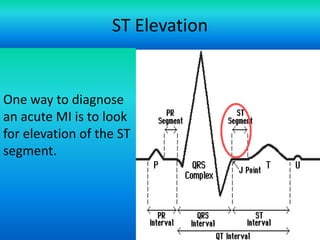
What is an ECG?
The electrocardiogram (ECG) is a representation of
the electrical events of the cardiac cycle.

Each event has a distinctive waveform, the study
of which can lead to greater insight into a patient’s
cardiac pathophysiology.
The 12-Leads
The 12-leads include:
–3 Limb leads
(I, II, III)
–3 Augmented leads
(aVR, aVL, aVF)
–6 Precordial leads
(V1- V6)

For more presentations
www.medicalppt.blogspot.com
The ECG Paper
• Horizontally
– One small box - 0.04 s
– One large box - 0.20 s
– 5 Large squares = 1 second

• Vertically
– One large box - 0.5 mV

For more presentations
www.medicalppt.blogspot.com
Anatomy of Heart Conduction and ECG
signal
Pacemakers of the Heart
• SA Node - Dominant
pacemaker with an
intrinsic rate of 60 - 100
beats/minute.
• AV Node - Back-up
pacemaker with an
intrinsic rate of 40 - 60
beats/minute.
• Ventricular cells - Back-up
pacemaker with an
intrinsic rate of 20 - 45
bpm.
Rhythm Analysis

HOW TO ANALYSE THE RHYTHM?
• Step 1: Calculate rate.
• Step 2: Determine regularity.
• Step 3: Assess the P waves.
• Step 4: Determine PR interval.
• Step 5: Determine QRS duration.
For more presentations
www.medicalppt.blogspot.com
Step 1: Calculate Rate

1)Count the number large squares R wave
between two consecutive “R” waves
then devide the result by 300 → For regular H.R
i.E 300/4 = 75bpm
2) Count the number of “R” waves in 6 seconds strip(30 large squares) then multiply
the result by 10 → For irregular H.R
i.E 10×12=120bpm
Option 3
– Find a R wave that lands on a bold line.
– Count the # of large boxes to the next R wave. If the second R wave is 1 large box away
the rate is 300, 2 boxes - 150, 3 boxes - 100, 4 boxes - 75, etc.

– Memorize the sequence:
300 - 150 - 100 - 75 - 60 - 50
•
•

R-R interval is ventricular rate
For more presentations
p-p interval is atrial rate. Usually www.medicalppt.blogspot.com
the same but not always
Step 2: Determine regularity
R

R

• Look at the R-R distances (using a caliper or markings on a
pen or paper).
• Regular (are they equidistant apart)? Occasionally
irregular? Regularly irregular? Irregularly irregular?
Interpretation?

Regular
For more presentations
www.medicalppt.blogspot.com
Step 3: Assess the P waves

• Are there P waves?
• Do the P waves all look alike?
• Do the P waves occur at a regular rate?
• Is there one P wave before each QRS?
Normal P waves with 1 P
Interpretation?
wave for every QRS
For more presentations
www.medicalppt.blogspot.com
Step 4: Determine PR interval

• Normal: 0.12 - 0.20 seconds.
(3 - 5 boxes)

Interpretation?

0.12 seconds
For more presentations
www.medicalppt.blogspot.com
Step 5: QRS duration

• Normal: 0.04 - 0.12 seconds.
(1 - 3 boxes)

Interpretation?

0.08 seconds
Rhythm Summary

• Rate
• Regularity
• P waves
• PR interval
• QRS duration
Interpretation?

90-95 bpm
regular
normal
0.12 s
0.08 s

Normal Sinus Rhythm

For more presentations
www.medicalppt.blogspot.com
NSR Parameters

• Rate
60 - 100 bpm
• Regularity
regular
• P waves
normal
• PR interval
0.12 - 0.20 s
• QRS duration
0.04 - 0.12 s
Any deviation from above is sinus tachycardia, sinus
bradycardia or an arrhythmia
For more presentations
www.medicalppt.blogspot.com
Arrhythmia Formation
Arrhythmias can arise from problems in the:

•Sinus node
•Atrial cells
•AV junction
•Ventricular cells
– AN ABNORMALITY OF THE RHYTHM OR RATE OF
THE HEARTBEAT CALLED ARRHYTHMIA CAUSED BY
DISTURBENCE IN THE ELECTRICAL IMPULSES IN THE
HEART
For more presentations
www.medicalppt.blogspot.com
SA Node Problems
The SA Node can:
• fire too slow
• fire too fast

Sinus Bradycardia
Sinus Tachycardia

Sinus Tachycardia may be an appropriate
response to stress.
For more presentations
www.medicalppt.blogspot.com
Sinus Bradycardia Rhythm #1
• Rate?
• Regularity?
• P waves?
• PR interval?
• QRS duration?
Interpretation?

30 bpm
regular
normal
0.12 s
0.10 s
Sinus Bradycardia

SA node is depolarizing slower than normal, impulse is conducted
normally (i.e. normal PR and QRS interval).
Sinus Tachycardia Rhythm #2
• Rate?
• Regularity?
• P waves?
• PR interval?
• QRS duration?
Interpretation?

130 bpm
regular
normal
0.16 s
0.08 s
Sinus Tachycardia

Etiology: SA node is depolarizing faster than normal, impulse is
conducted normally.
Remember: sinus tachycardia is a response to physical or psychological
stress, not a primary arrhythmia.
Atrial Cell Problems
Atrial cells can:
• fire occasionally from a
focus

Premature Atrial
Contractions (PACs)

• fire continuously due to a
looping re-entrant circuit
Atrial Flutter
• Atrial cells can also:
• fire continuously from
multiple foci
or
Atrial Fibrillation
• fire continuously due to
multiple micro reentrant “wavelets”
For more presentations
www.medicalppt.blogspot.com
Premature Atrial Contractions Rhythm #3

• Rate?
• Regularity?
• P waves?
• PR interval?
• QRS duration?
Interpretation?

70 bpm
occasionally irreg.
2/7 different contour
0.14 s (except 2/7)
0.08 s
NSR with Premature
Atrial Contractions
Premature Atrial Contractions

• Deviation from NSR
– These ectopic beats originate in the atria (but not
in the SA node), therefore the contour of the P
wave, the PR interval, and the timing are
different than a normally generated pulse from
the SA node.
For more presentations
www.medicalppt.blogspot.com
Atrial Fibrillation Rhythm #4

• Rate?
• Regularity?
• P waves?
• PR interval?
• QRS duration?
Interpretation?

100 bpm
irregularly irregular
none
none
0.06 s
Atrial Fibrillation

Impulses take Multiple, Chaotic, Random pathways through atria
Atrial Flutter Rhythm #5

• Rate?
• Regularity?
• P waves?
• PR interval?
• QRS duration?
Interpretation?

70 bpm
regular
flutter waves
none
0.06 s
Atrial Flutter

Impulses take a circular course around the atria, setting up a flutter
waves
AV Junctional Problems

The AV junction can:
• fire continuously due
to a looping re-entrant
circuit

Paroxysmal
Supraventricular
Tachycardia

• block impulses coming AV Junctional Blocks
from the SA Node
For more presentations
www.medicalppt.blogspot.com
Paroxysmal Supraventricular Tachycardia
Rhythm #6

• Rate?
• Regularity?
• P waves?
• PR interval?
• QRS duration?
Interpretation?

74 148 bpm
Regular  regular
Normal  none
0.16 s  none
0.08 s
(PSVT)

Impulses recycle repeatedly in the AV node ,
There are several types of PSVT but all originate above the
ventricles (therefore the QRS is narrow).
1st Degree AV Block Rhythm #7

• Rate?
• Regularity?
• P waves?
• PR interval?
• QRS duration?
•Interpretation?

60 bpm
regular
normal
0.36 s Prolonged
0.08 s
1st Degree AV Block

Impulse conduction is slowed at AV node for a fixed interval
2nd Degree AV Block, Type I Rhythm #8

• Rate?
• Regularity?
• P waves?
• PR interval?
• QRS duration?
Interpretation?

50 bpm
regularly irregular
nl, but 4th no QRS
lengthens
0.08 s
2nd Degree AV Block, Type I

Impulse conduction is slowed at AV node, until one sinus impulse is
completely blocked and QRS complex fail to follow
2nd Degree AV Block, Type II Rhythm #9

• Rate?
• Regularity?
• P waves?
• PR interval?
• QRS duration?
Interpretation?

40 bpm
regular
nl, 2 of 3 no QRS
0.14 s
0.08 s
2nd Degree AV Block, Type II

Site of the block is often below the AV node at bundle of His or bundle
branches ( 2 dropped beats)
3rd Degree AV Block Rhythm #10

• Rate?
• Regularity?
• P waves?
• PR interval?
• QRS duration?
Interpretation?

40 bpm
regular
no relation to QRS
none
wide (> 0.12 s)
3rd Degree AV Block

Injury or damaged to cardiac conduction system
Ventricular Cell Problems
Ventricular cells can:
• fire occasionally from 1 Premature Ventricular
or more foci
Contractions (PVCs)
• fire continuously from
multiple foci

Ventricular Fibrillation

• fire continuously due to Ventricular Tachycardia
a looping re-entrant
circuit
For more presentations
www.medicalppt.blogspot.com
Sinus Rhythm with 1 PVC Rhythm #11

•
•
•
•
•

Rate?
Regularity?
P waves?
PR interval?
QRS duration?

Interpretation?

60 bpm
occasionally irreg.
none for 7th QRS
0.14 s
0.08 s (7th wide)
Sinus Rhythm with 1
PVC

For more presentations www.medicalppt.blogspot.com
PVCs

• Deviation from NSR
– Ectopic beats originate in the ventricles resulting in wide
and bizarre QRS complexes.
– When there are more than 1 premature beats and look
alike, they are called “uniform”. When they look
different, they are called “multiform”.
For more presentations
www.medicalppt.blogspot.com
Ventricular Tachycardia Rhythm #12

• Rate?
• Regularity?
• P waves?
• PR interval?
• QRS duration?
Interpretation?

160 bpm
regular
none
none
wide (> 0.12 sec)
Ventricular Tachycardia

Impulse conduction slowed around ventricular injury , or ischemia
Ventricular Tachycardia

• Etiology: There is a re-entrant pathway looping in a
ventricle (most common cause).
• Ventricular tachycardia can sometimes generate
enough cardiac output to produce a pulse; at other
times no pulse can be felt.
For more presentations
www.medicalppt.blogspot.com
Ventricular Fibrillation Rhythm #13

• Rate?
• Regularity?
• P waves?
• PR interval?
• QRS duration?
Interpretation?

none
irregularly irreg.
none
none
wide, if recognizable
Ventricular Fibrillation

Ventricles consist of areas of normal myocardium alternating with areas of ischemic,
injured, or infarcted myocardium, leading to chaotic pattern of ventricular
depolarization
Ventricular Fibrillation

Coarse VF
Fine VF
• Etiology: The ventricular cells are excitable and
depolarizing randomly.
• Rapid drop in cardiac output and death occurs if not
quickly reversed
For more presentations
www.medicalppt.blogspot.com
Pulseless electrical activity Rhythm #13

• Rate?
• Regularity?
• P waves?
• PR interval?
• QRS duration?
Interpretation?

none
Regular
present
Normal
0.10
PEA

Any organized rhythm without detectable pulse is “PEA”
Cardiac conduction impulses occur in organized pattern, but this fails to produce
myocardial contraction
Asystole Rhythm # 14

•Rate: no ventricular activity seen or ≤6/min; so-called “Pwave asystole” occurs with only atrial
impulses present to form P waves
• Rhythm: no ventricular activity seen; or ≤6/min
• PR: cannot be determined; occasionally P wave seen, but
by definition R wave must be absent
• QRS complex: no deflections seen that are consistent with
a QRS complex
Asystole: agonal complexes too slow to make this rhythm
Diagnosing a MI
To diagnose a myocardial infarction you need to go
beyond looking at a rhythm strip and obtain a 12-Lead
ECG.

12-Lead
ECG

Rhythm
Strip
For more presentations
www.medicalppt.blogspot.com
ST Elevation

One way to diagnose
an acute MI is to look
for elevation of the ST
segment.

For more presentations
www.medicalppt.blogspot.com
ST Elevation (cont)
Elevation of the
ST segment
(greater than 1
small box) in 2
leads is
consistent with a
myocardial
infarction.
For more presentations
www.medicalppt.blogspot.com
ECG Changes : Ischemia
•
•
•
•

T-wave inversion ( flipped T)
ST segment depression
T wave flattening
Biphasic T-waves

Baseline


2004 Anna Story

45
ECG Changes: Injury
• ST segment elevation of greater than 1mm in at least 2 contiguous
leads
• Heightened or peaked T waves
• Directly related to portions of myocardium rendered electrically
inactive

Baseline


2004 Anna Story

46

2004 Anna Story

47
Interpretation of arrhythmias

Interpretation of arrhythmias

  • 2.
    What is anECG? The electrocardiogram (ECG) is a representation of the electrical events of the cardiac cycle. Each event has a distinctive waveform, the study of which can lead to greater insight into a patient’s cardiac pathophysiology.
  • 3.
    The 12-Leads The 12-leadsinclude: –3 Limb leads (I, II, III) –3 Augmented leads (aVR, aVL, aVF) –6 Precordial leads (V1- V6) For more presentations www.medicalppt.blogspot.com
  • 5.
    The ECG Paper •Horizontally – One small box - 0.04 s – One large box - 0.20 s – 5 Large squares = 1 second • Vertically – One large box - 0.5 mV For more presentations www.medicalppt.blogspot.com
  • 7.
    Anatomy of HeartConduction and ECG signal
  • 9.
    Pacemakers of theHeart • SA Node - Dominant pacemaker with an intrinsic rate of 60 - 100 beats/minute. • AV Node - Back-up pacemaker with an intrinsic rate of 40 - 60 beats/minute. • Ventricular cells - Back-up pacemaker with an intrinsic rate of 20 - 45 bpm.
  • 10.
    Rhythm Analysis HOW TOANALYSE THE RHYTHM? • Step 1: Calculate rate. • Step 2: Determine regularity. • Step 3: Assess the P waves. • Step 4: Determine PR interval. • Step 5: Determine QRS duration. For more presentations www.medicalppt.blogspot.com
  • 11.
    Step 1: CalculateRate 1)Count the number large squares R wave between two consecutive “R” waves then devide the result by 300 → For regular H.R i.E 300/4 = 75bpm 2) Count the number of “R” waves in 6 seconds strip(30 large squares) then multiply the result by 10 → For irregular H.R i.E 10×12=120bpm Option 3 – Find a R wave that lands on a bold line. – Count the # of large boxes to the next R wave. If the second R wave is 1 large box away the rate is 300, 2 boxes - 150, 3 boxes - 100, 4 boxes - 75, etc. – Memorize the sequence: 300 - 150 - 100 - 75 - 60 - 50 • • R-R interval is ventricular rate For more presentations p-p interval is atrial rate. Usually www.medicalppt.blogspot.com the same but not always
  • 12.
    Step 2: Determineregularity R R • Look at the R-R distances (using a caliper or markings on a pen or paper). • Regular (are they equidistant apart)? Occasionally irregular? Regularly irregular? Irregularly irregular? Interpretation? Regular For more presentations www.medicalppt.blogspot.com
  • 13.
    Step 3: Assessthe P waves • Are there P waves? • Do the P waves all look alike? • Do the P waves occur at a regular rate? • Is there one P wave before each QRS? Normal P waves with 1 P Interpretation? wave for every QRS For more presentations www.medicalppt.blogspot.com
  • 14.
    Step 4: DeterminePR interval • Normal: 0.12 - 0.20 seconds. (3 - 5 boxes) Interpretation? 0.12 seconds For more presentations www.medicalppt.blogspot.com
  • 15.
    Step 5: QRSduration • Normal: 0.04 - 0.12 seconds. (1 - 3 boxes) Interpretation? 0.08 seconds
  • 16.
    Rhythm Summary • Rate •Regularity • P waves • PR interval • QRS duration Interpretation? 90-95 bpm regular normal 0.12 s 0.08 s Normal Sinus Rhythm For more presentations www.medicalppt.blogspot.com
  • 17.
    NSR Parameters • Rate 60- 100 bpm • Regularity regular • P waves normal • PR interval 0.12 - 0.20 s • QRS duration 0.04 - 0.12 s Any deviation from above is sinus tachycardia, sinus bradycardia or an arrhythmia For more presentations www.medicalppt.blogspot.com
  • 18.
    Arrhythmia Formation Arrhythmias canarise from problems in the: •Sinus node •Atrial cells •AV junction •Ventricular cells – AN ABNORMALITY OF THE RHYTHM OR RATE OF THE HEARTBEAT CALLED ARRHYTHMIA CAUSED BY DISTURBENCE IN THE ELECTRICAL IMPULSES IN THE HEART For more presentations www.medicalppt.blogspot.com
  • 19.
    SA Node Problems TheSA Node can: • fire too slow • fire too fast Sinus Bradycardia Sinus Tachycardia Sinus Tachycardia may be an appropriate response to stress. For more presentations www.medicalppt.blogspot.com
  • 20.
    Sinus Bradycardia Rhythm#1 • Rate? • Regularity? • P waves? • PR interval? • QRS duration? Interpretation? 30 bpm regular normal 0.12 s 0.10 s Sinus Bradycardia SA node is depolarizing slower than normal, impulse is conducted normally (i.e. normal PR and QRS interval).
  • 21.
    Sinus Tachycardia Rhythm#2 • Rate? • Regularity? • P waves? • PR interval? • QRS duration? Interpretation? 130 bpm regular normal 0.16 s 0.08 s Sinus Tachycardia Etiology: SA node is depolarizing faster than normal, impulse is conducted normally. Remember: sinus tachycardia is a response to physical or psychological stress, not a primary arrhythmia.
  • 22.
    Atrial Cell Problems Atrialcells can: • fire occasionally from a focus Premature Atrial Contractions (PACs) • fire continuously due to a looping re-entrant circuit Atrial Flutter • Atrial cells can also: • fire continuously from multiple foci or Atrial Fibrillation • fire continuously due to multiple micro reentrant “wavelets” For more presentations www.medicalppt.blogspot.com
  • 23.
    Premature Atrial ContractionsRhythm #3 • Rate? • Regularity? • P waves? • PR interval? • QRS duration? Interpretation? 70 bpm occasionally irreg. 2/7 different contour 0.14 s (except 2/7) 0.08 s NSR with Premature Atrial Contractions
  • 24.
    Premature Atrial Contractions •Deviation from NSR – These ectopic beats originate in the atria (but not in the SA node), therefore the contour of the P wave, the PR interval, and the timing are different than a normally generated pulse from the SA node. For more presentations www.medicalppt.blogspot.com
  • 25.
    Atrial Fibrillation Rhythm#4 • Rate? • Regularity? • P waves? • PR interval? • QRS duration? Interpretation? 100 bpm irregularly irregular none none 0.06 s Atrial Fibrillation Impulses take Multiple, Chaotic, Random pathways through atria
  • 26.
    Atrial Flutter Rhythm#5 • Rate? • Regularity? • P waves? • PR interval? • QRS duration? Interpretation? 70 bpm regular flutter waves none 0.06 s Atrial Flutter Impulses take a circular course around the atria, setting up a flutter waves
  • 27.
    AV Junctional Problems TheAV junction can: • fire continuously due to a looping re-entrant circuit Paroxysmal Supraventricular Tachycardia • block impulses coming AV Junctional Blocks from the SA Node For more presentations www.medicalppt.blogspot.com
  • 28.
    Paroxysmal Supraventricular Tachycardia Rhythm#6 • Rate? • Regularity? • P waves? • PR interval? • QRS duration? Interpretation? 74 148 bpm Regular  regular Normal  none 0.16 s  none 0.08 s (PSVT) Impulses recycle repeatedly in the AV node , There are several types of PSVT but all originate above the ventricles (therefore the QRS is narrow).
  • 29.
    1st Degree AVBlock Rhythm #7 • Rate? • Regularity? • P waves? • PR interval? • QRS duration? •Interpretation? 60 bpm regular normal 0.36 s Prolonged 0.08 s 1st Degree AV Block Impulse conduction is slowed at AV node for a fixed interval
  • 30.
    2nd Degree AVBlock, Type I Rhythm #8 • Rate? • Regularity? • P waves? • PR interval? • QRS duration? Interpretation? 50 bpm regularly irregular nl, but 4th no QRS lengthens 0.08 s 2nd Degree AV Block, Type I Impulse conduction is slowed at AV node, until one sinus impulse is completely blocked and QRS complex fail to follow
  • 31.
    2nd Degree AVBlock, Type II Rhythm #9 • Rate? • Regularity? • P waves? • PR interval? • QRS duration? Interpretation? 40 bpm regular nl, 2 of 3 no QRS 0.14 s 0.08 s 2nd Degree AV Block, Type II Site of the block is often below the AV node at bundle of His or bundle branches ( 2 dropped beats)
  • 32.
    3rd Degree AVBlock Rhythm #10 • Rate? • Regularity? • P waves? • PR interval? • QRS duration? Interpretation? 40 bpm regular no relation to QRS none wide (> 0.12 s) 3rd Degree AV Block Injury or damaged to cardiac conduction system
  • 33.
    Ventricular Cell Problems Ventricularcells can: • fire occasionally from 1 Premature Ventricular or more foci Contractions (PVCs) • fire continuously from multiple foci Ventricular Fibrillation • fire continuously due to Ventricular Tachycardia a looping re-entrant circuit For more presentations www.medicalppt.blogspot.com
  • 34.
    Sinus Rhythm with1 PVC Rhythm #11 • • • • • Rate? Regularity? P waves? PR interval? QRS duration? Interpretation? 60 bpm occasionally irreg. none for 7th QRS 0.14 s 0.08 s (7th wide) Sinus Rhythm with 1 PVC For more presentations www.medicalppt.blogspot.com
  • 35.
    PVCs • Deviation fromNSR – Ectopic beats originate in the ventricles resulting in wide and bizarre QRS complexes. – When there are more than 1 premature beats and look alike, they are called “uniform”. When they look different, they are called “multiform”. For more presentations www.medicalppt.blogspot.com
  • 36.
    Ventricular Tachycardia Rhythm#12 • Rate? • Regularity? • P waves? • PR interval? • QRS duration? Interpretation? 160 bpm regular none none wide (> 0.12 sec) Ventricular Tachycardia Impulse conduction slowed around ventricular injury , or ischemia
  • 37.
    Ventricular Tachycardia • Etiology:There is a re-entrant pathway looping in a ventricle (most common cause). • Ventricular tachycardia can sometimes generate enough cardiac output to produce a pulse; at other times no pulse can be felt. For more presentations www.medicalppt.blogspot.com
  • 38.
    Ventricular Fibrillation Rhythm#13 • Rate? • Regularity? • P waves? • PR interval? • QRS duration? Interpretation? none irregularly irreg. none none wide, if recognizable Ventricular Fibrillation Ventricles consist of areas of normal myocardium alternating with areas of ischemic, injured, or infarcted myocardium, leading to chaotic pattern of ventricular depolarization
  • 39.
    Ventricular Fibrillation Coarse VF FineVF • Etiology: The ventricular cells are excitable and depolarizing randomly. • Rapid drop in cardiac output and death occurs if not quickly reversed For more presentations www.medicalppt.blogspot.com
  • 40.
    Pulseless electrical activityRhythm #13 • Rate? • Regularity? • P waves? • PR interval? • QRS duration? Interpretation? none Regular present Normal 0.10 PEA Any organized rhythm without detectable pulse is “PEA” Cardiac conduction impulses occur in organized pattern, but this fails to produce myocardial contraction
  • 41.
    Asystole Rhythm #14 •Rate: no ventricular activity seen or ≤6/min; so-called “Pwave asystole” occurs with only atrial impulses present to form P waves • Rhythm: no ventricular activity seen; or ≤6/min • PR: cannot be determined; occasionally P wave seen, but by definition R wave must be absent • QRS complex: no deflections seen that are consistent with a QRS complex Asystole: agonal complexes too slow to make this rhythm
  • 42.
    Diagnosing a MI Todiagnose a myocardial infarction you need to go beyond looking at a rhythm strip and obtain a 12-Lead ECG. 12-Lead ECG Rhythm Strip For more presentations www.medicalppt.blogspot.com
  • 43.
    ST Elevation One wayto diagnose an acute MI is to look for elevation of the ST segment. For more presentations www.medicalppt.blogspot.com
  • 44.
    ST Elevation (cont) Elevationof the ST segment (greater than 1 small box) in 2 leads is consistent with a myocardial infarction. For more presentations www.medicalppt.blogspot.com
  • 45.
    ECG Changes :Ischemia • • • • T-wave inversion ( flipped T) ST segment depression T wave flattening Biphasic T-waves Baseline  2004 Anna Story 45
  • 46.
    ECG Changes: Injury •ST segment elevation of greater than 1mm in at least 2 contiguous leads • Heightened or peaked T waves • Directly related to portions of myocardium rendered electrically inactive Baseline  2004 Anna Story 46
  • 47.