Application of Remote Sensing in Land Use and Land Cover.ppt
This document discusses the application of remote sensing in land use and land cover classification. It defines key concepts like land cover, which refers to natural vegetation and surfaces, and land use, which refers to human activities on the land. Remote sensing allows for accurate and efficient monitoring of land cover and land use changes over large areas. The document also presents the USGS land use classification system, which categorizes data based on the sensor and scale. The system aims to achieve over 85% accuracy in identifying land use categories from remote imagery and allow for comparison over time.
Overview of the significance of remote sensing in understanding land use and cover.
Introduction to land use/cover dynamics, effects of human activity, and the classification of land.
Discussion of uniform classification system in remote sensing and criteria for effective application. Details of the classification system developed by USGS, including accuracy and data characteristics.
Closing slide possibly indicating a concluding thought or thematic symbol of trust in the methodology.
Introduction
Land Use andLand Cover
• Land-cover/land-use has become crucial basis work to carry the
prediction to the dynamical change of land use, prevention to
natural disaster, environment protection, land management and
planning.
• With rapid development of remote sensing technology, land-
cover/land-use classification has become the most credible, rapid
and effective measure to monitor the condition and changing of
land-cover/land use in the global surface.
• Land-cover emphasize particularly on its nature properties and it
is the synthetically reflection of various elements in global
surface covered with natural body or manual construction.
3.
Using remotesensing classification method, whatever used or
non/used covering object in surface can be used separated.
Land-Use “Man’s activities and the various use which carried on
land”.
E.g. Construction of buildings, agricultural lands, playgrounds
etc.
Land-Cover “ Natural Vegetation, water bodies rock/soil etc,
resulting due to land transformations”.
4.
• Land coverconsisting- roofs, pavement, grass and trees.
• For a hydrologic study of rainfall-run off characteristics, it would be
important to know the amount and distribution of roofs, pavement,
grass and trees.
• Land-use is a process of turning natural ecosystem into social
ecosystem.
• The process is a complicated procedure by the synthetic effect from
nature, economy and society.
• The manner, degree, structure, area distributing and benefit of land-
use are not only affected by natural condition but also restricted by
diversified natural, economic and technologic condition.
• Land-use is the most direct and leading driving factor to the land-
cover change.
5.
In carrying outresearch and application of the land-cover
and land-use remote sensing investigation, the uniform
classification system is usually built up which is
combining the two concepts, which is called Remote
Sensing Land-Cover/Land use classification .
6.
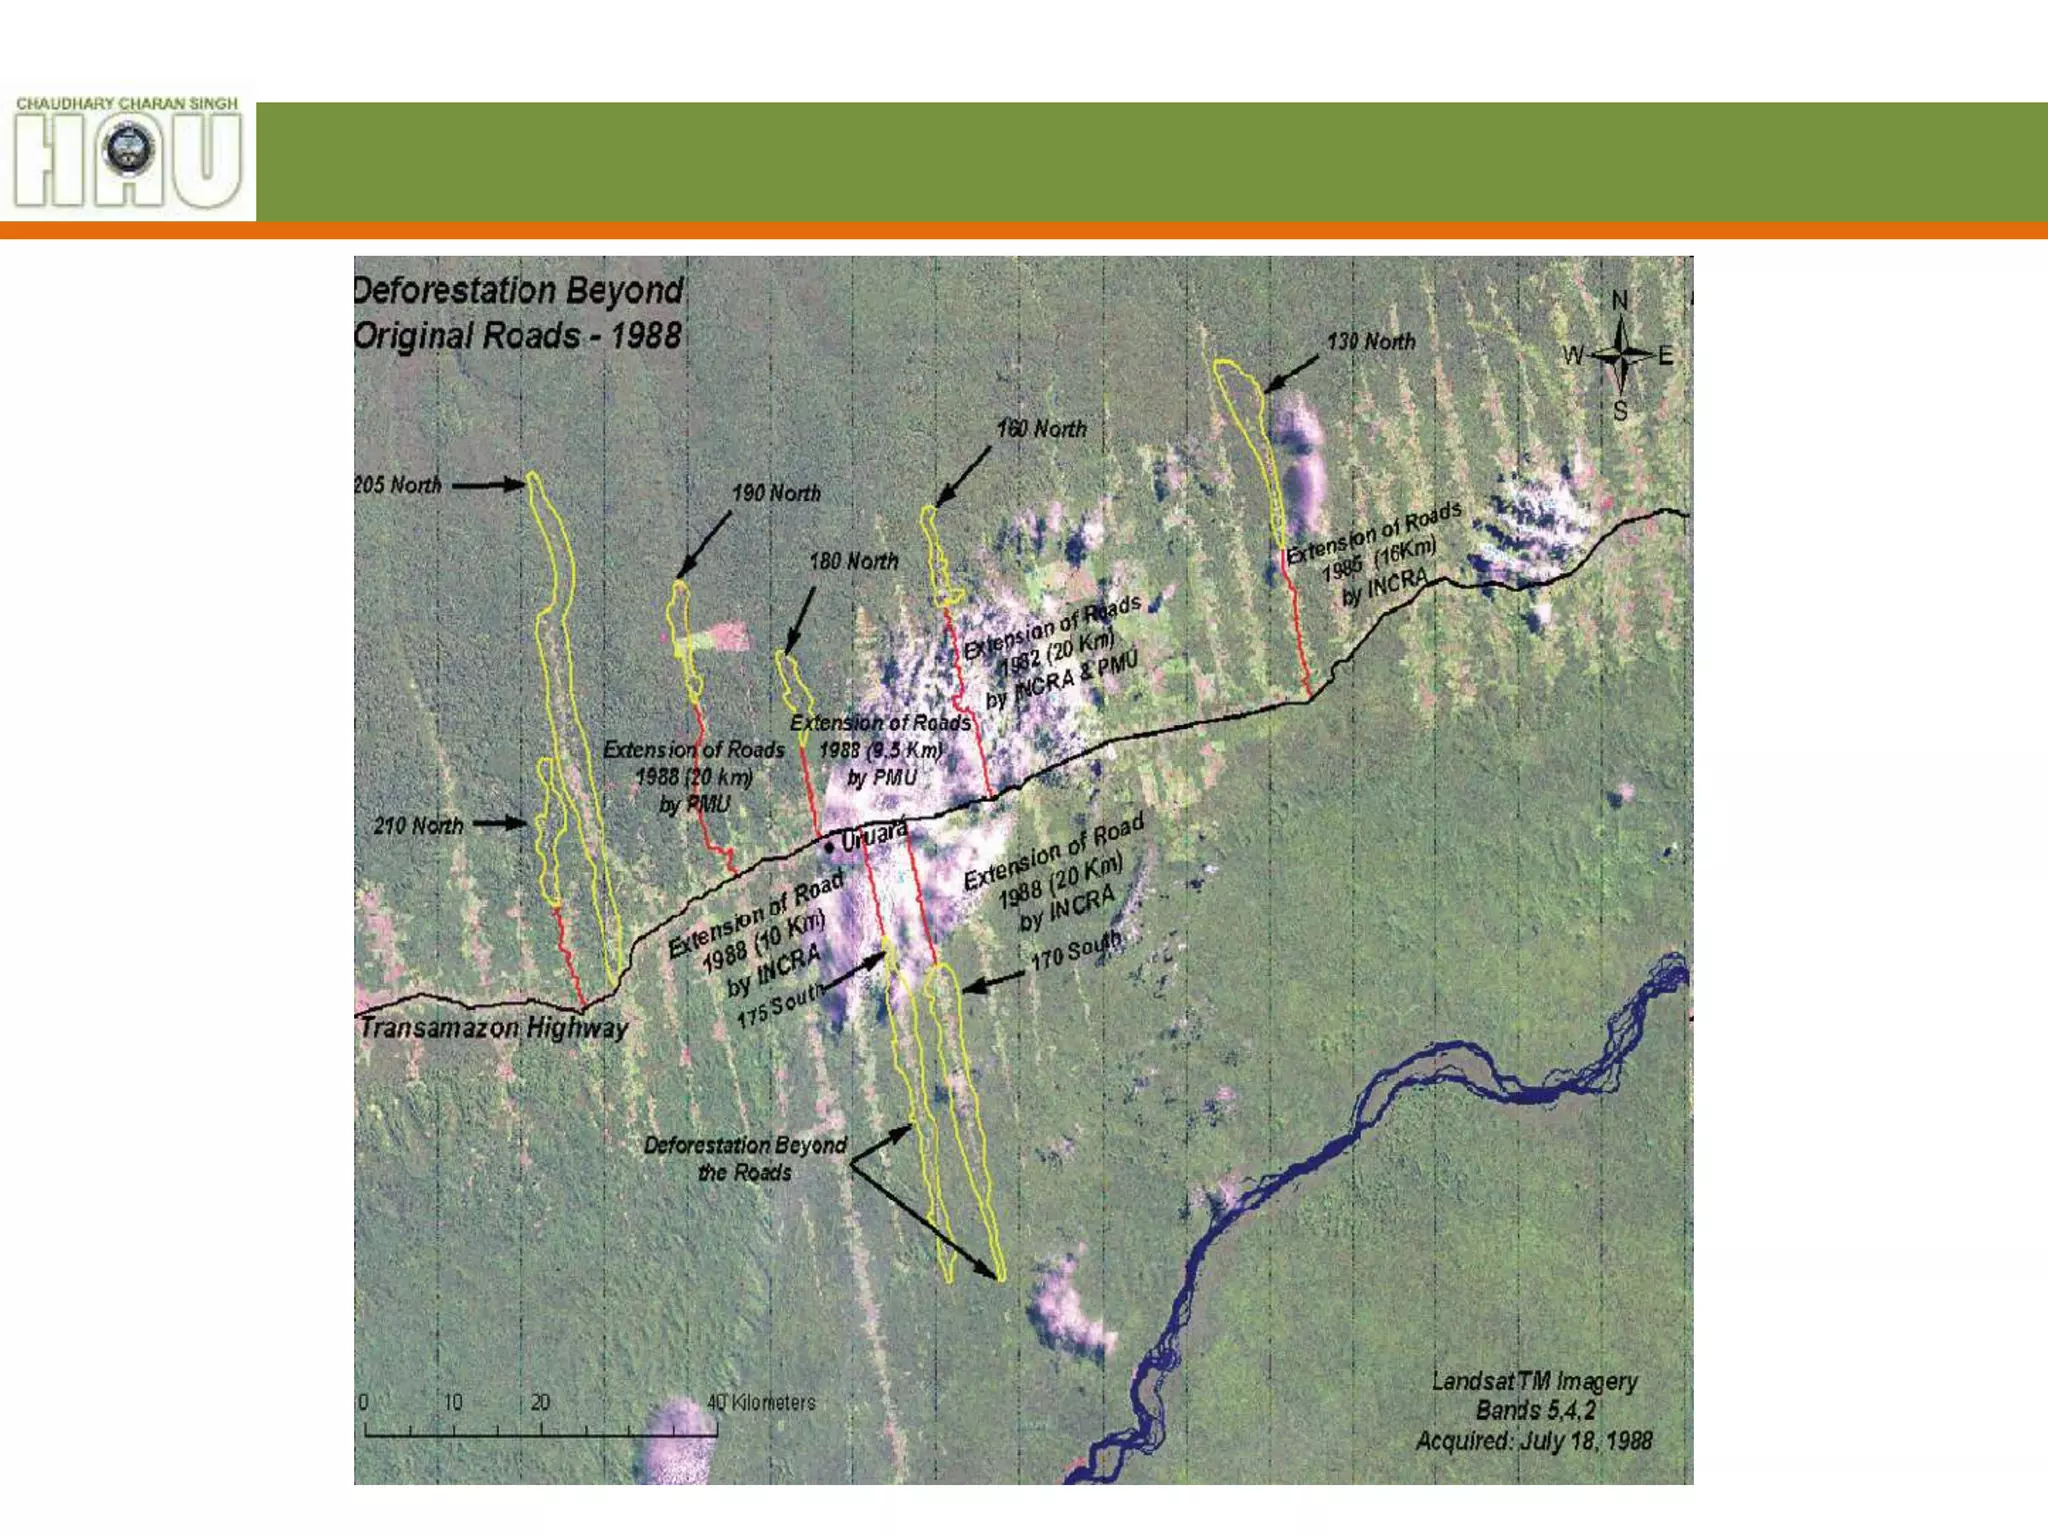
• As anexample, this image shows a situation in
which deforestation precedes road-building.
– It depicts in red several settlement roads in 1988;
– deforested areas, as of 1988, are shown by the yellow
polygons extending beyond the roads.
• Since the roads now pass through these old
deforested areas, the figure suggests reverse
causality, in which deforestation actually leads to
road-building.
– This situation is probably common in areas of
smallholder colonization.
8.
USGS Classification System
•A Land Use And Land Cover Classification
System For Use With Remote Sensor Data
– By JAMES R. ANDERSON, ERNEST E. HARDY, JOHN
T. ROACH, and RICHARD E. WITMER
– Geological Survey Professional Paper 964
– A revision of the land use classification system as presented
in U.S. Geological Survey Circular 671
9.
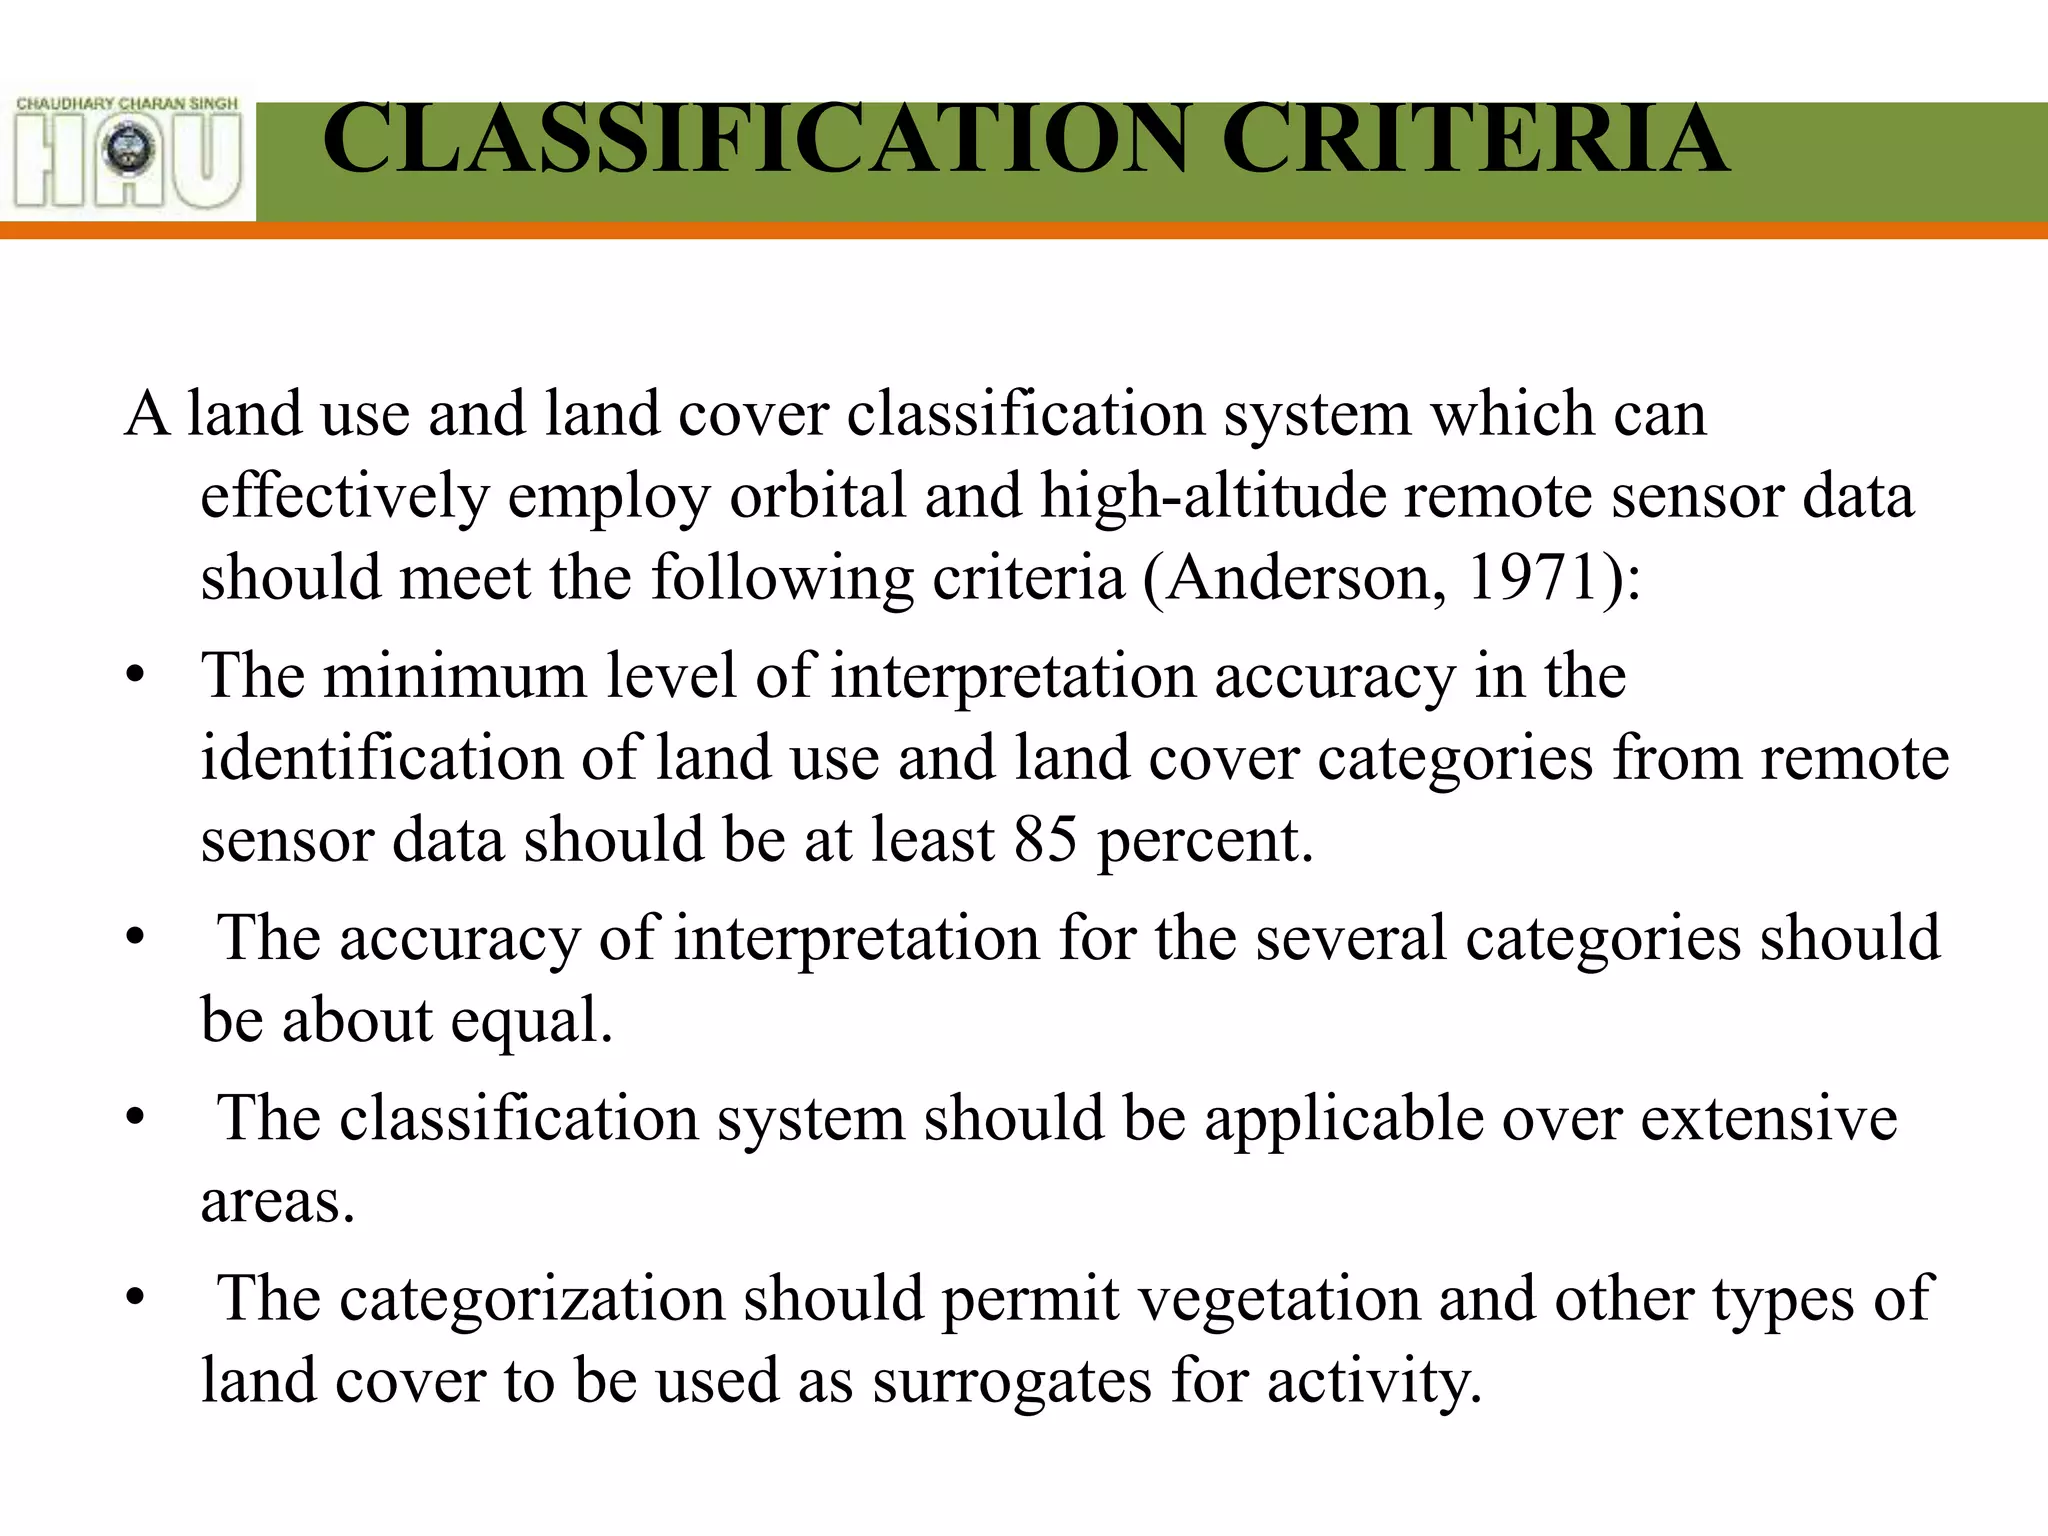
CLASSIFICATION CRITERIA
A landuse and land cover classification system which can
effectively employ orbital and high-altitude remote sensor data
should meet the following criteria (Anderson, 1971):
• The minimum level of interpretation accuracy in the
identification of land use and land cover categories from remote
sensor data should be at least 85 percent.
• The accuracy of interpretation for the several categories should
be about equal.
• The classification system should be applicable over extensive
areas.
• The categorization should permit vegetation and other types of
land cover to be used as surrogates for activity.
10.
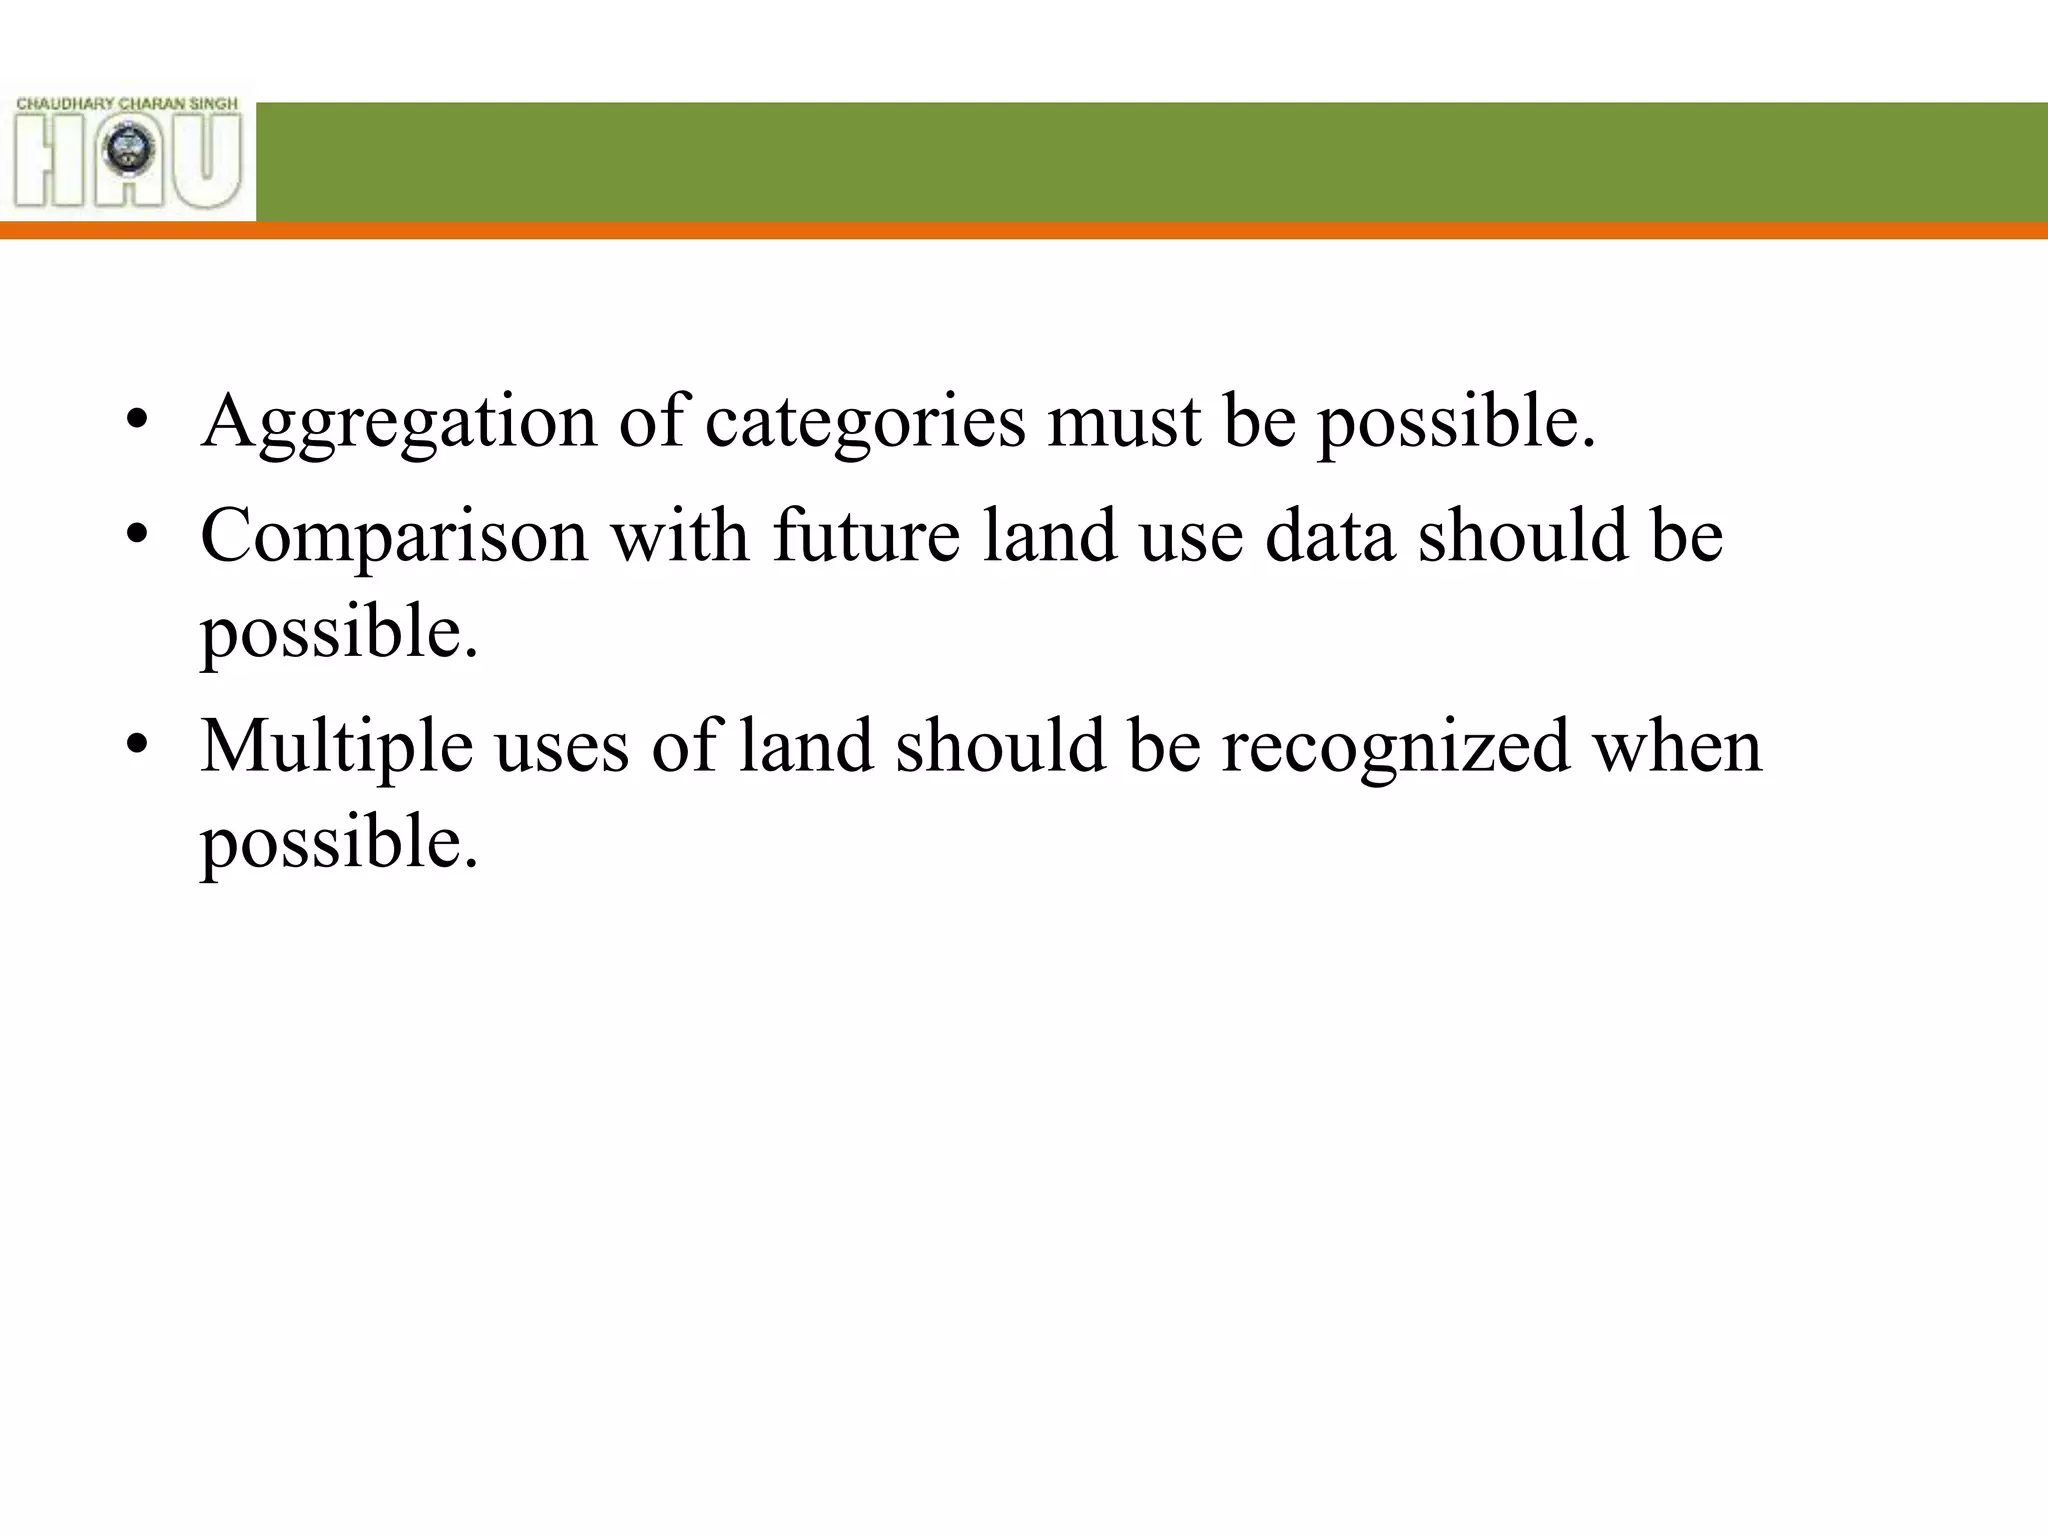
• Aggregation ofcategories must be possible.
• Comparison with future land use data should be
possible.
• Multiple uses of land should be recognized when
possible.
11.
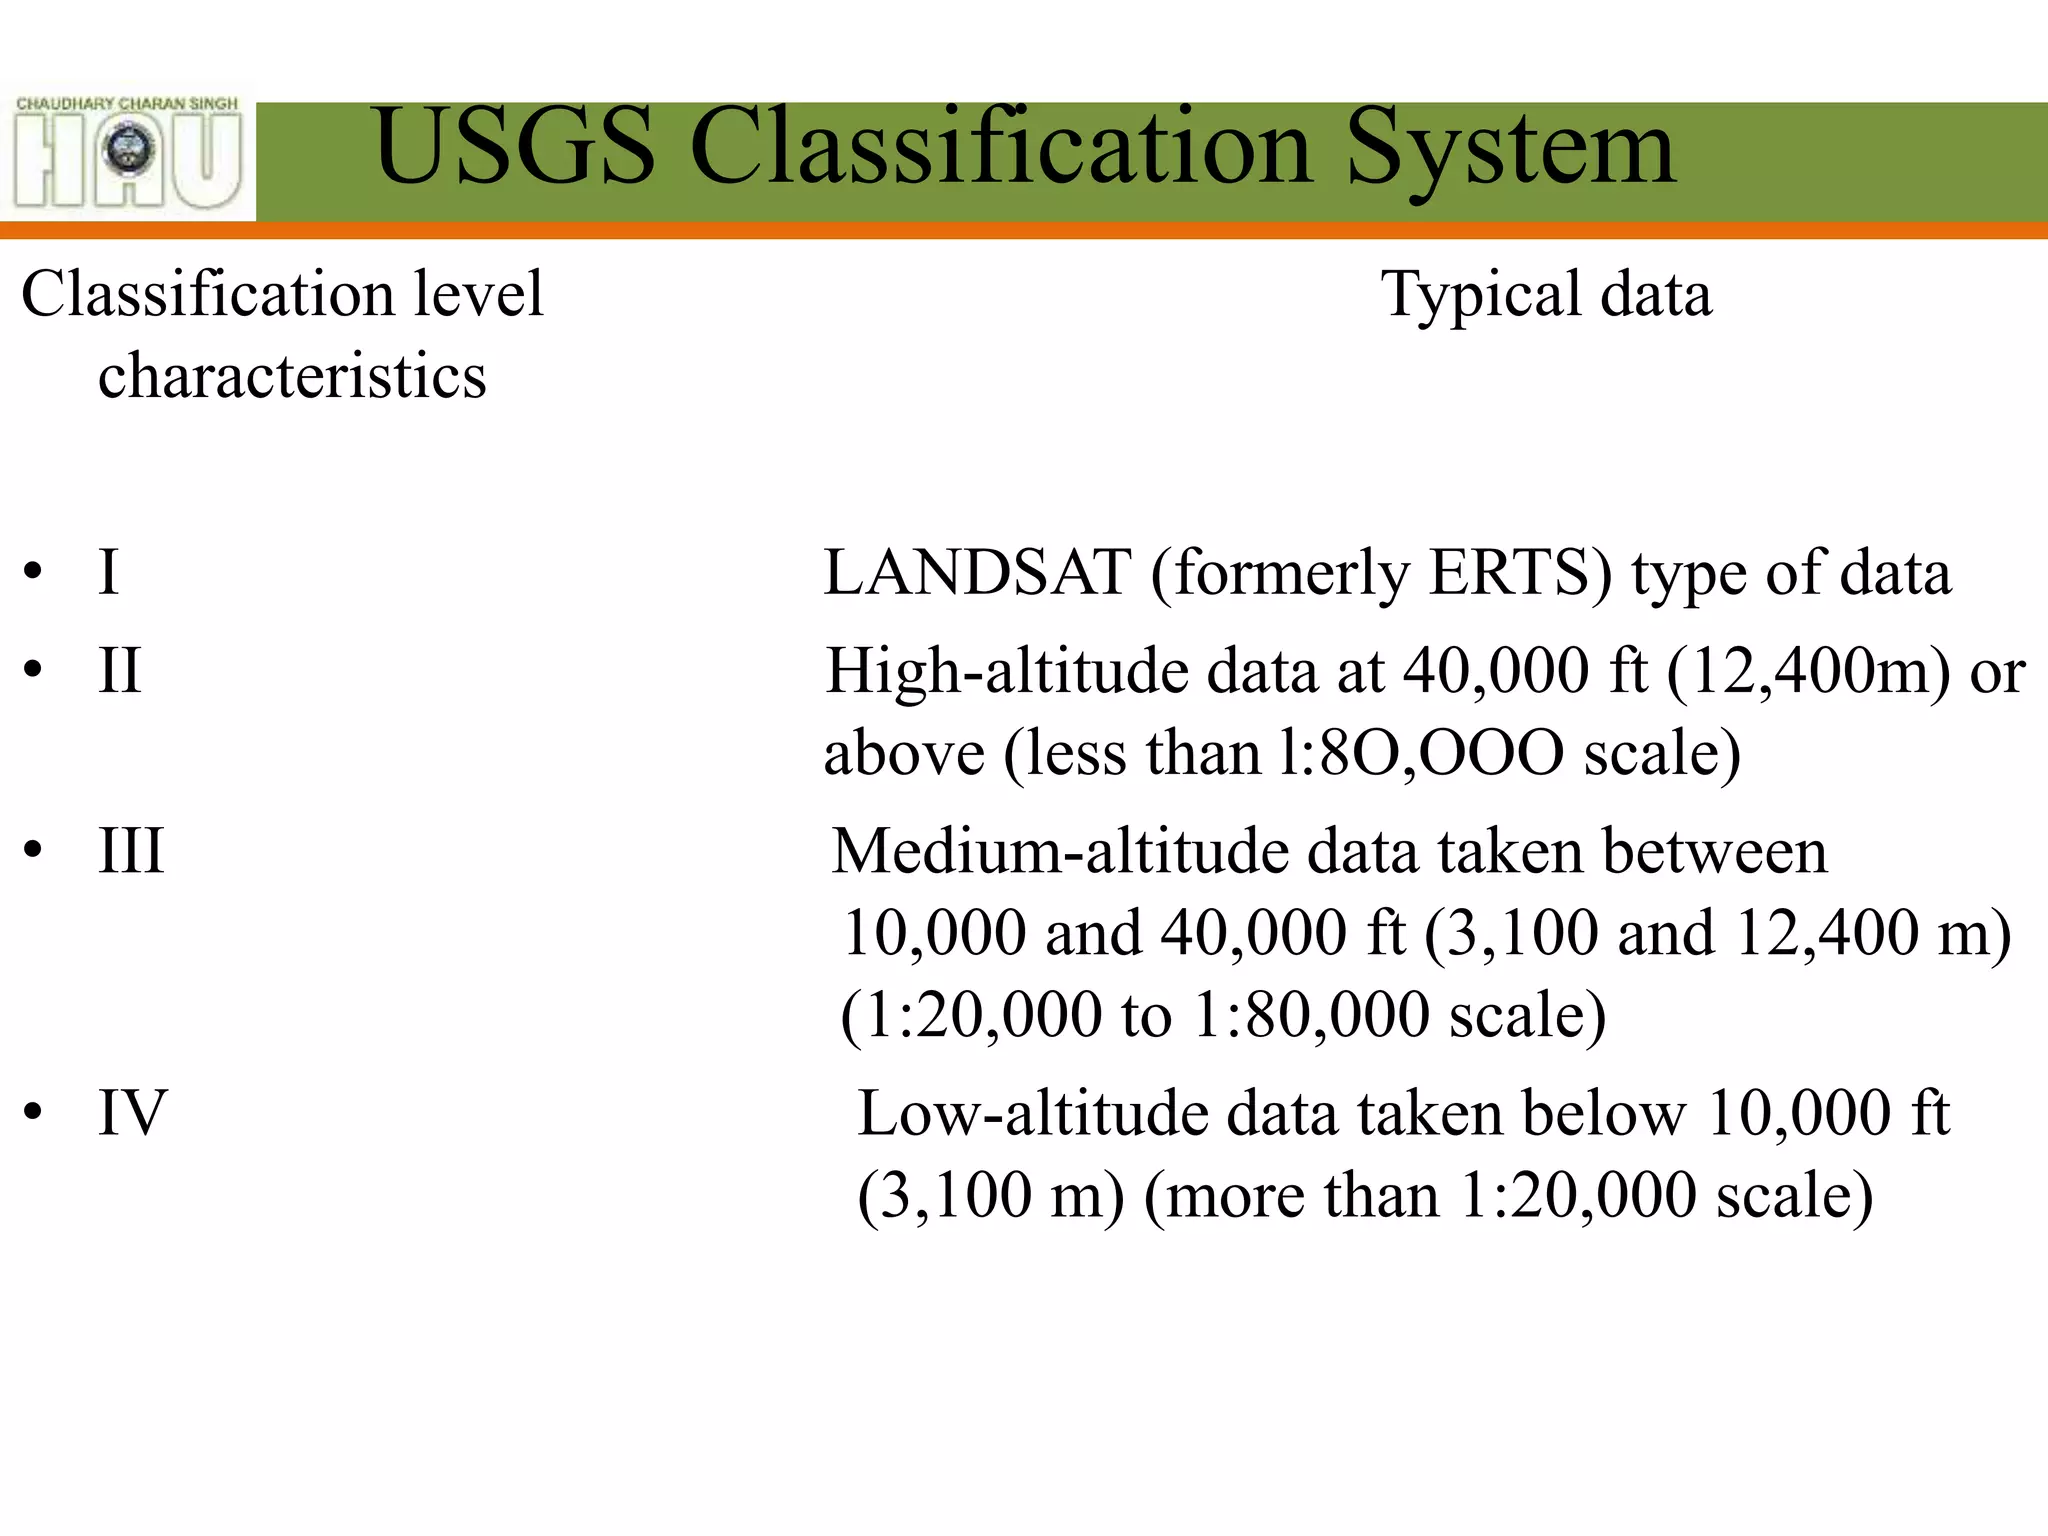
USGS Classification System
Classificationlevel Typical data
characteristics
• I LANDSAT (formerly ERTS) type of data
• II High-altitude data at 40,000 ft (12,400m) or
above (less than l:8O,OOO scale)
• III Medium-altitude data taken between
10,000 and 40,000 ft (3,100 and 12,400 m)
(1:20,000 to 1:80,000 scale)
• IV Low-altitude data taken below 10,000 ft
(3,100 m) (more than 1:20,000 scale)