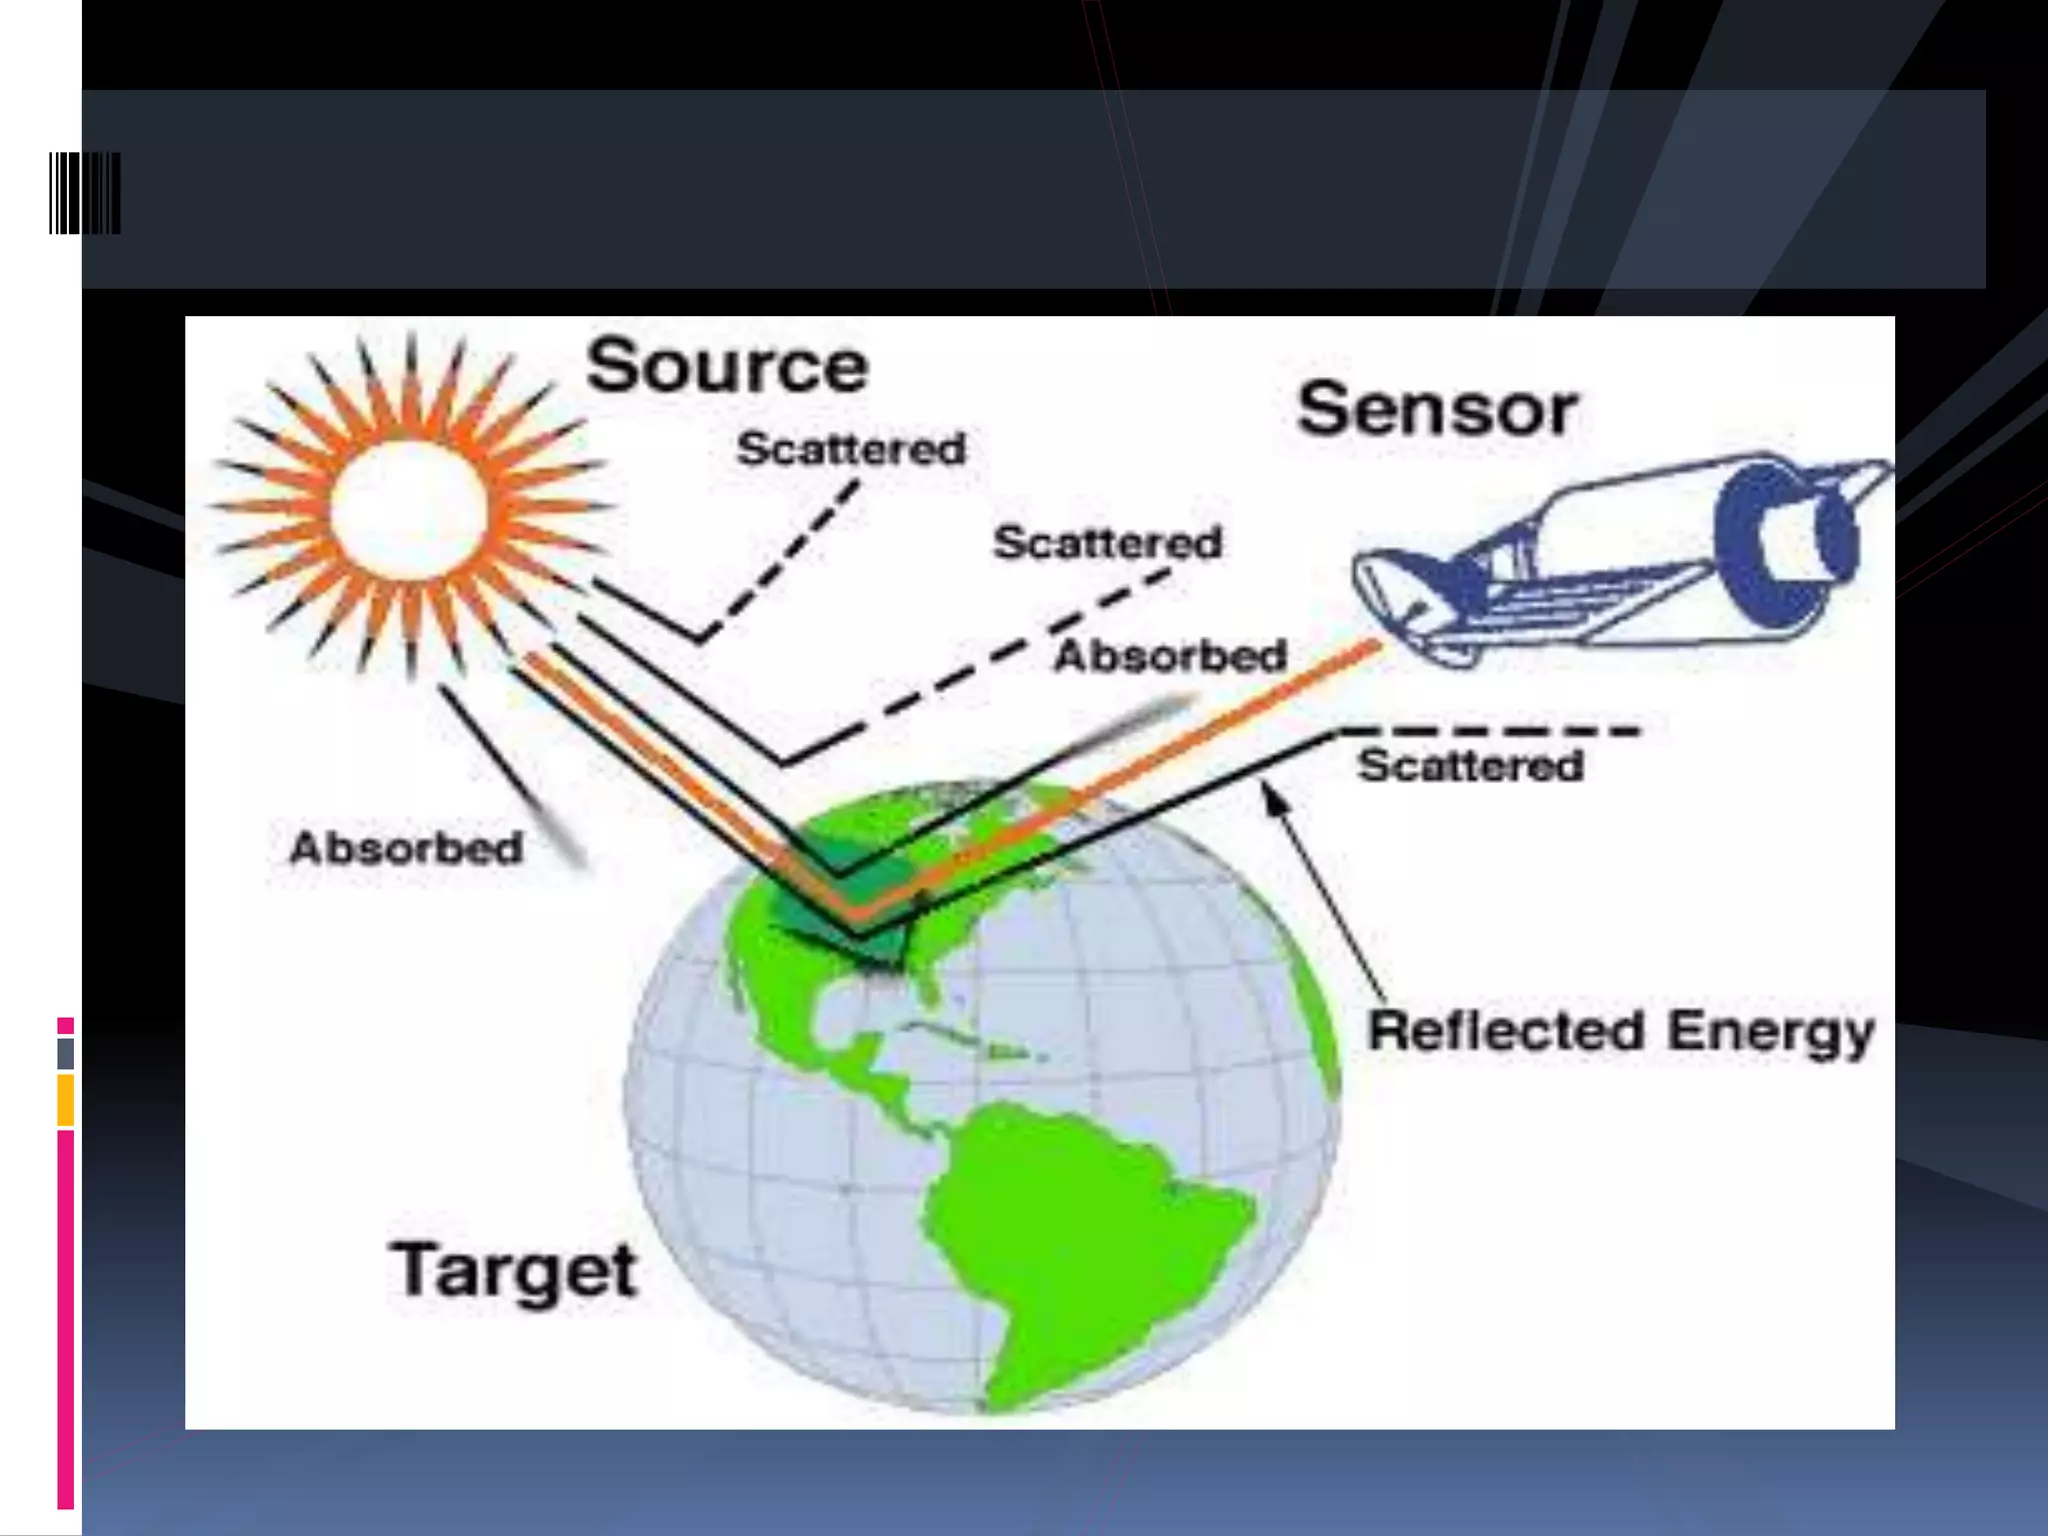
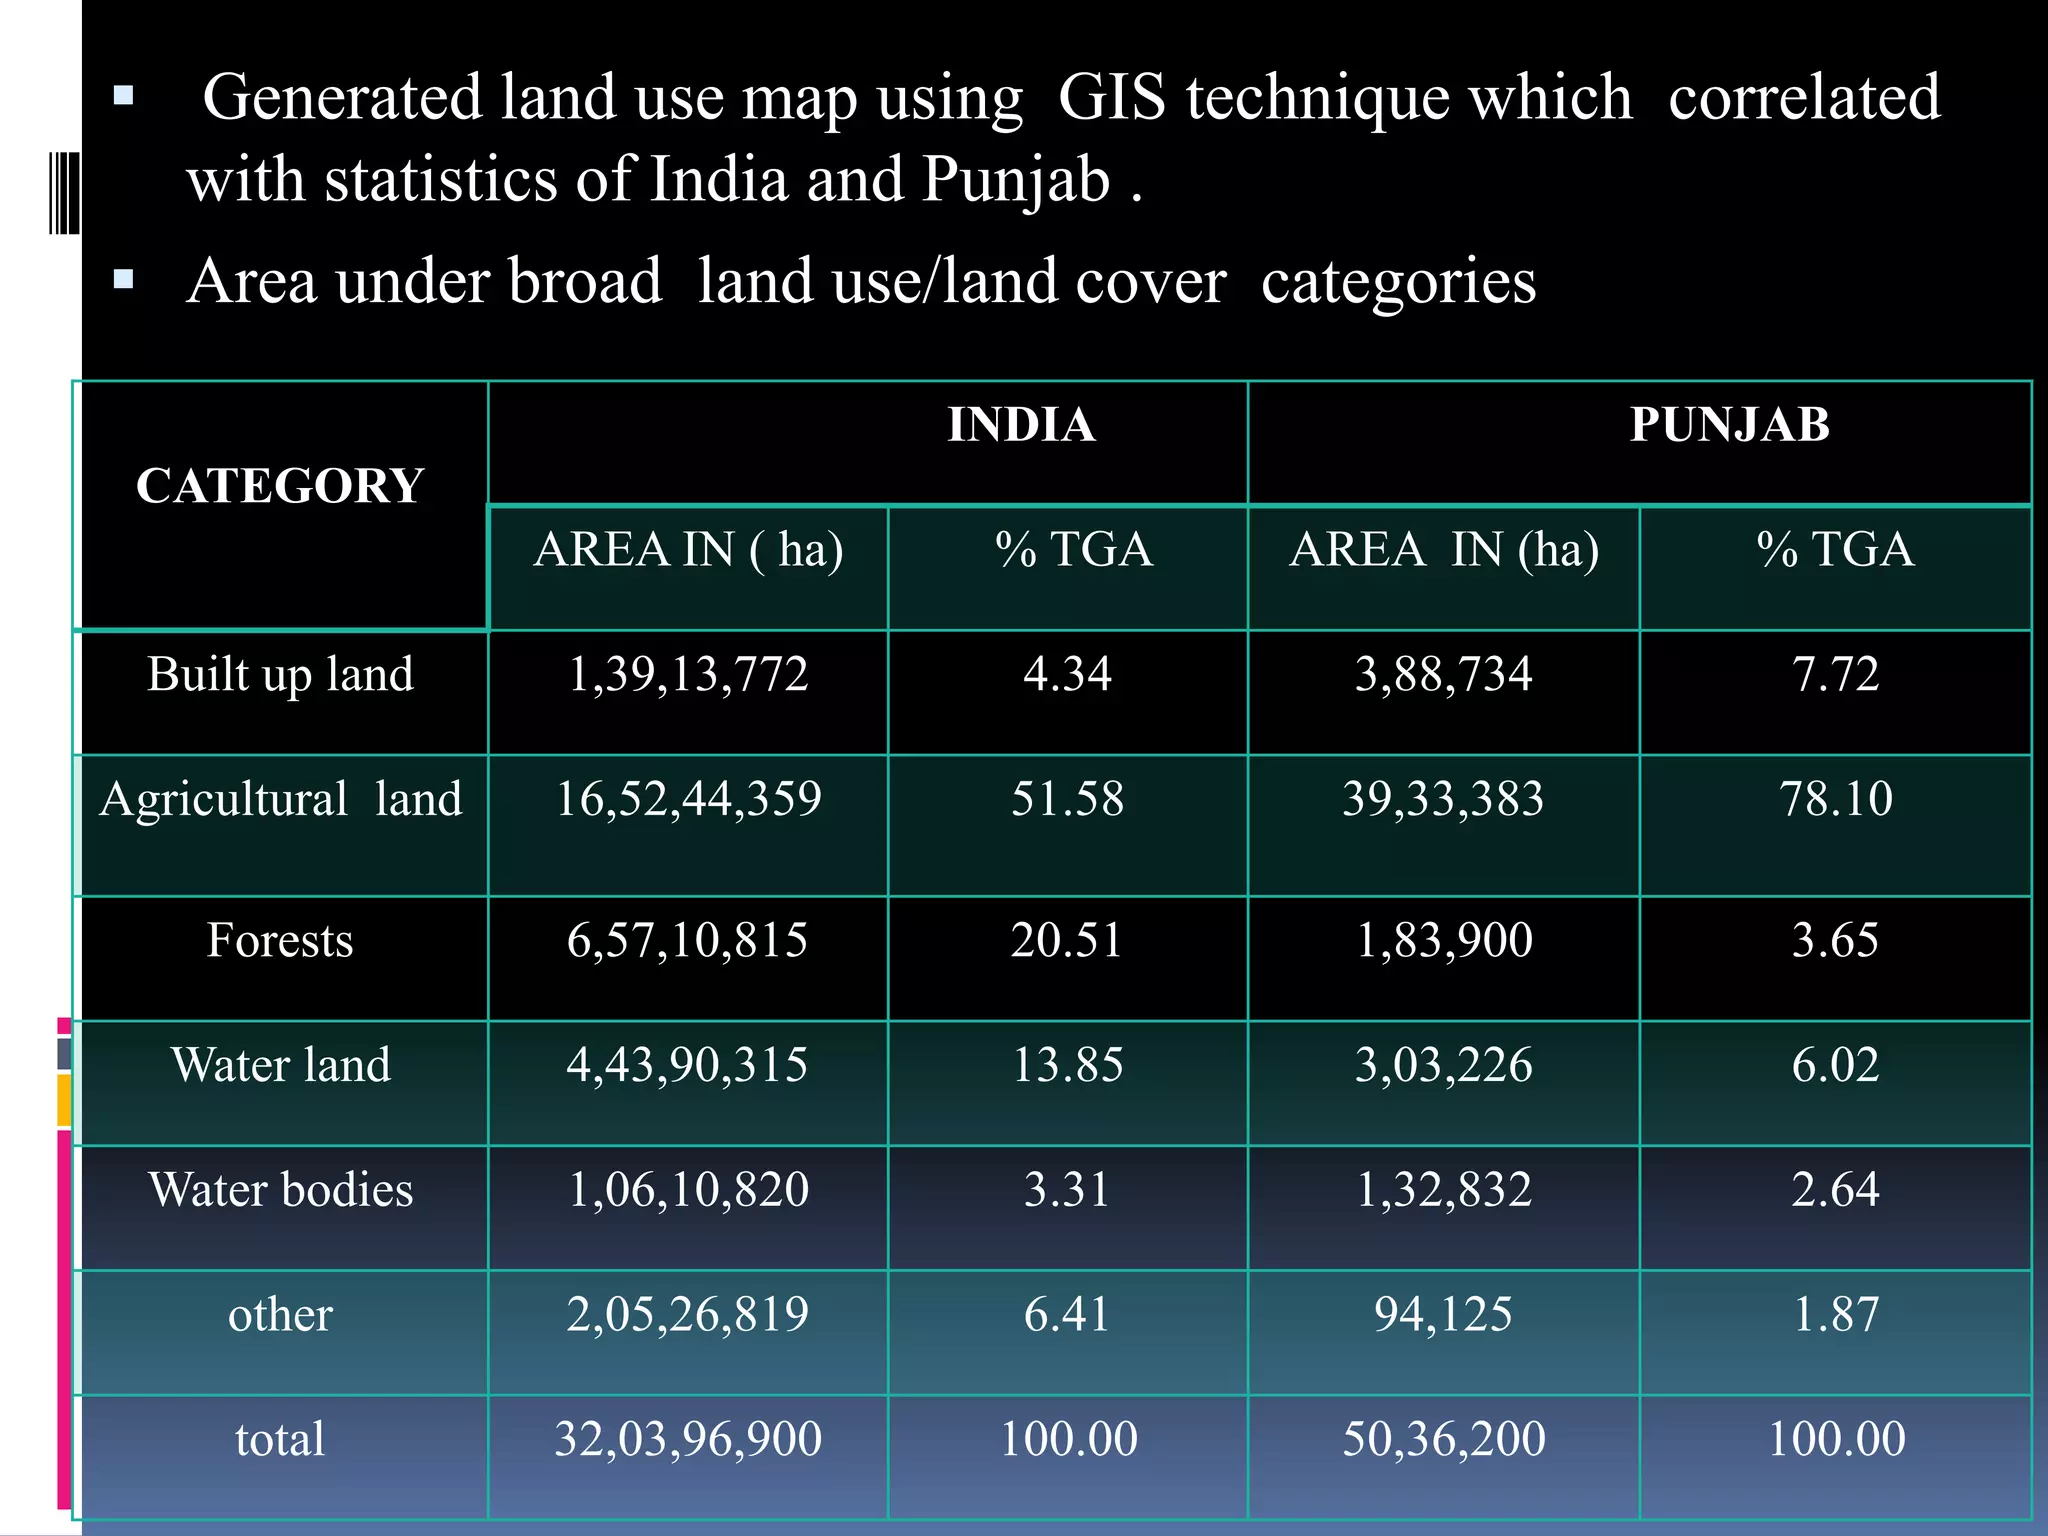
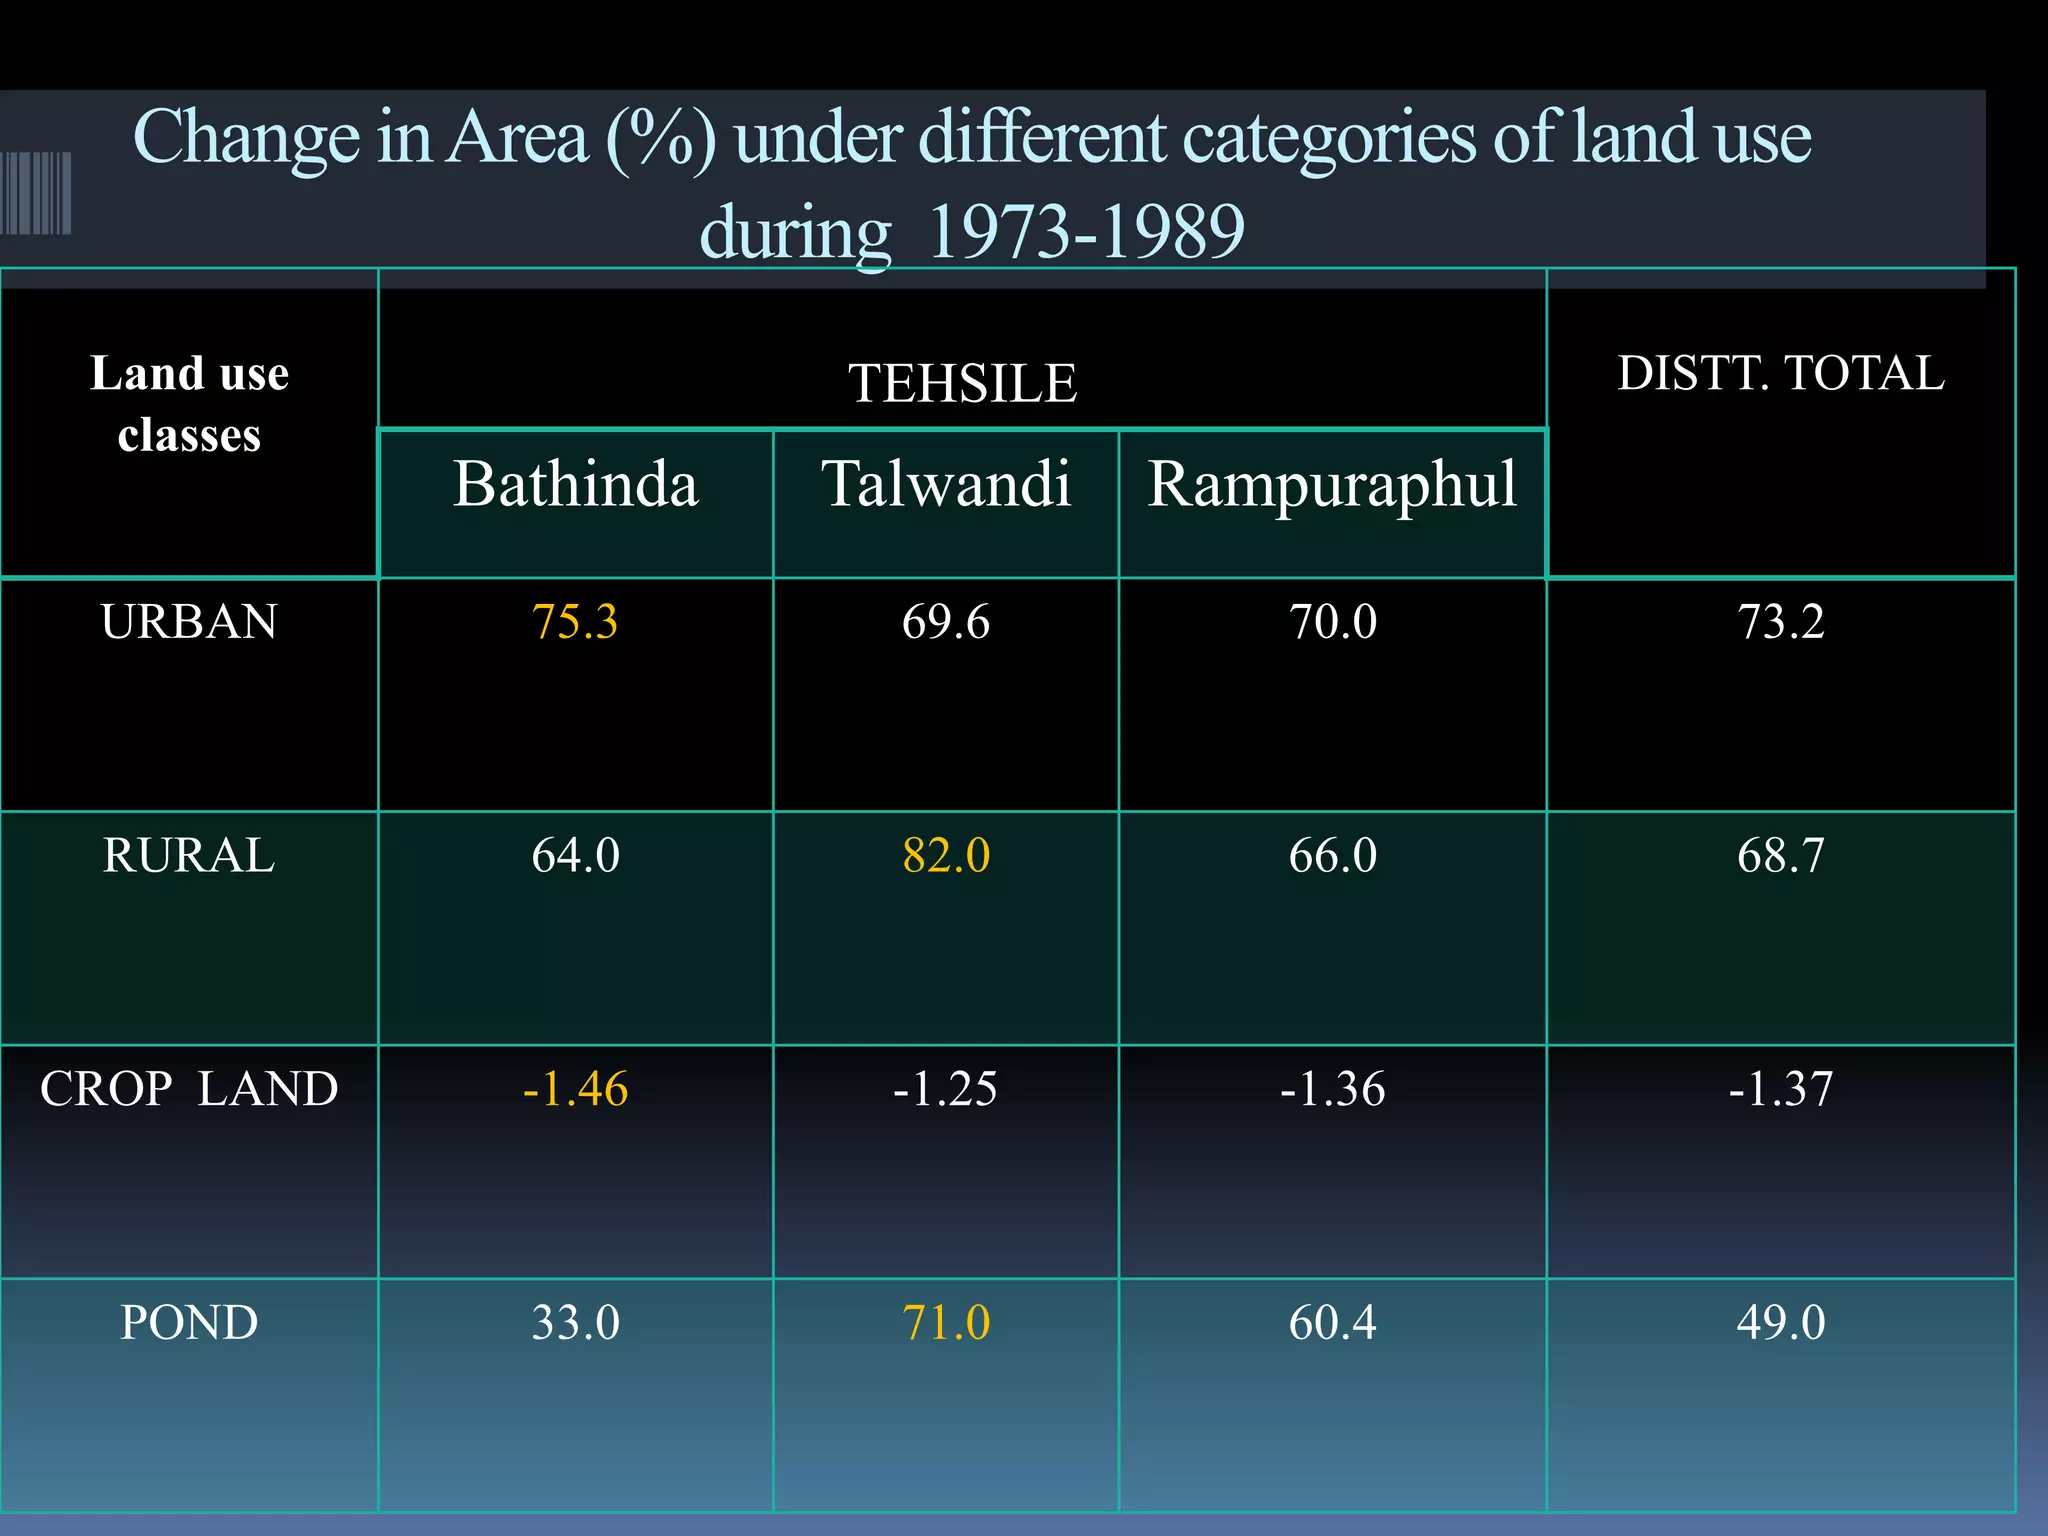
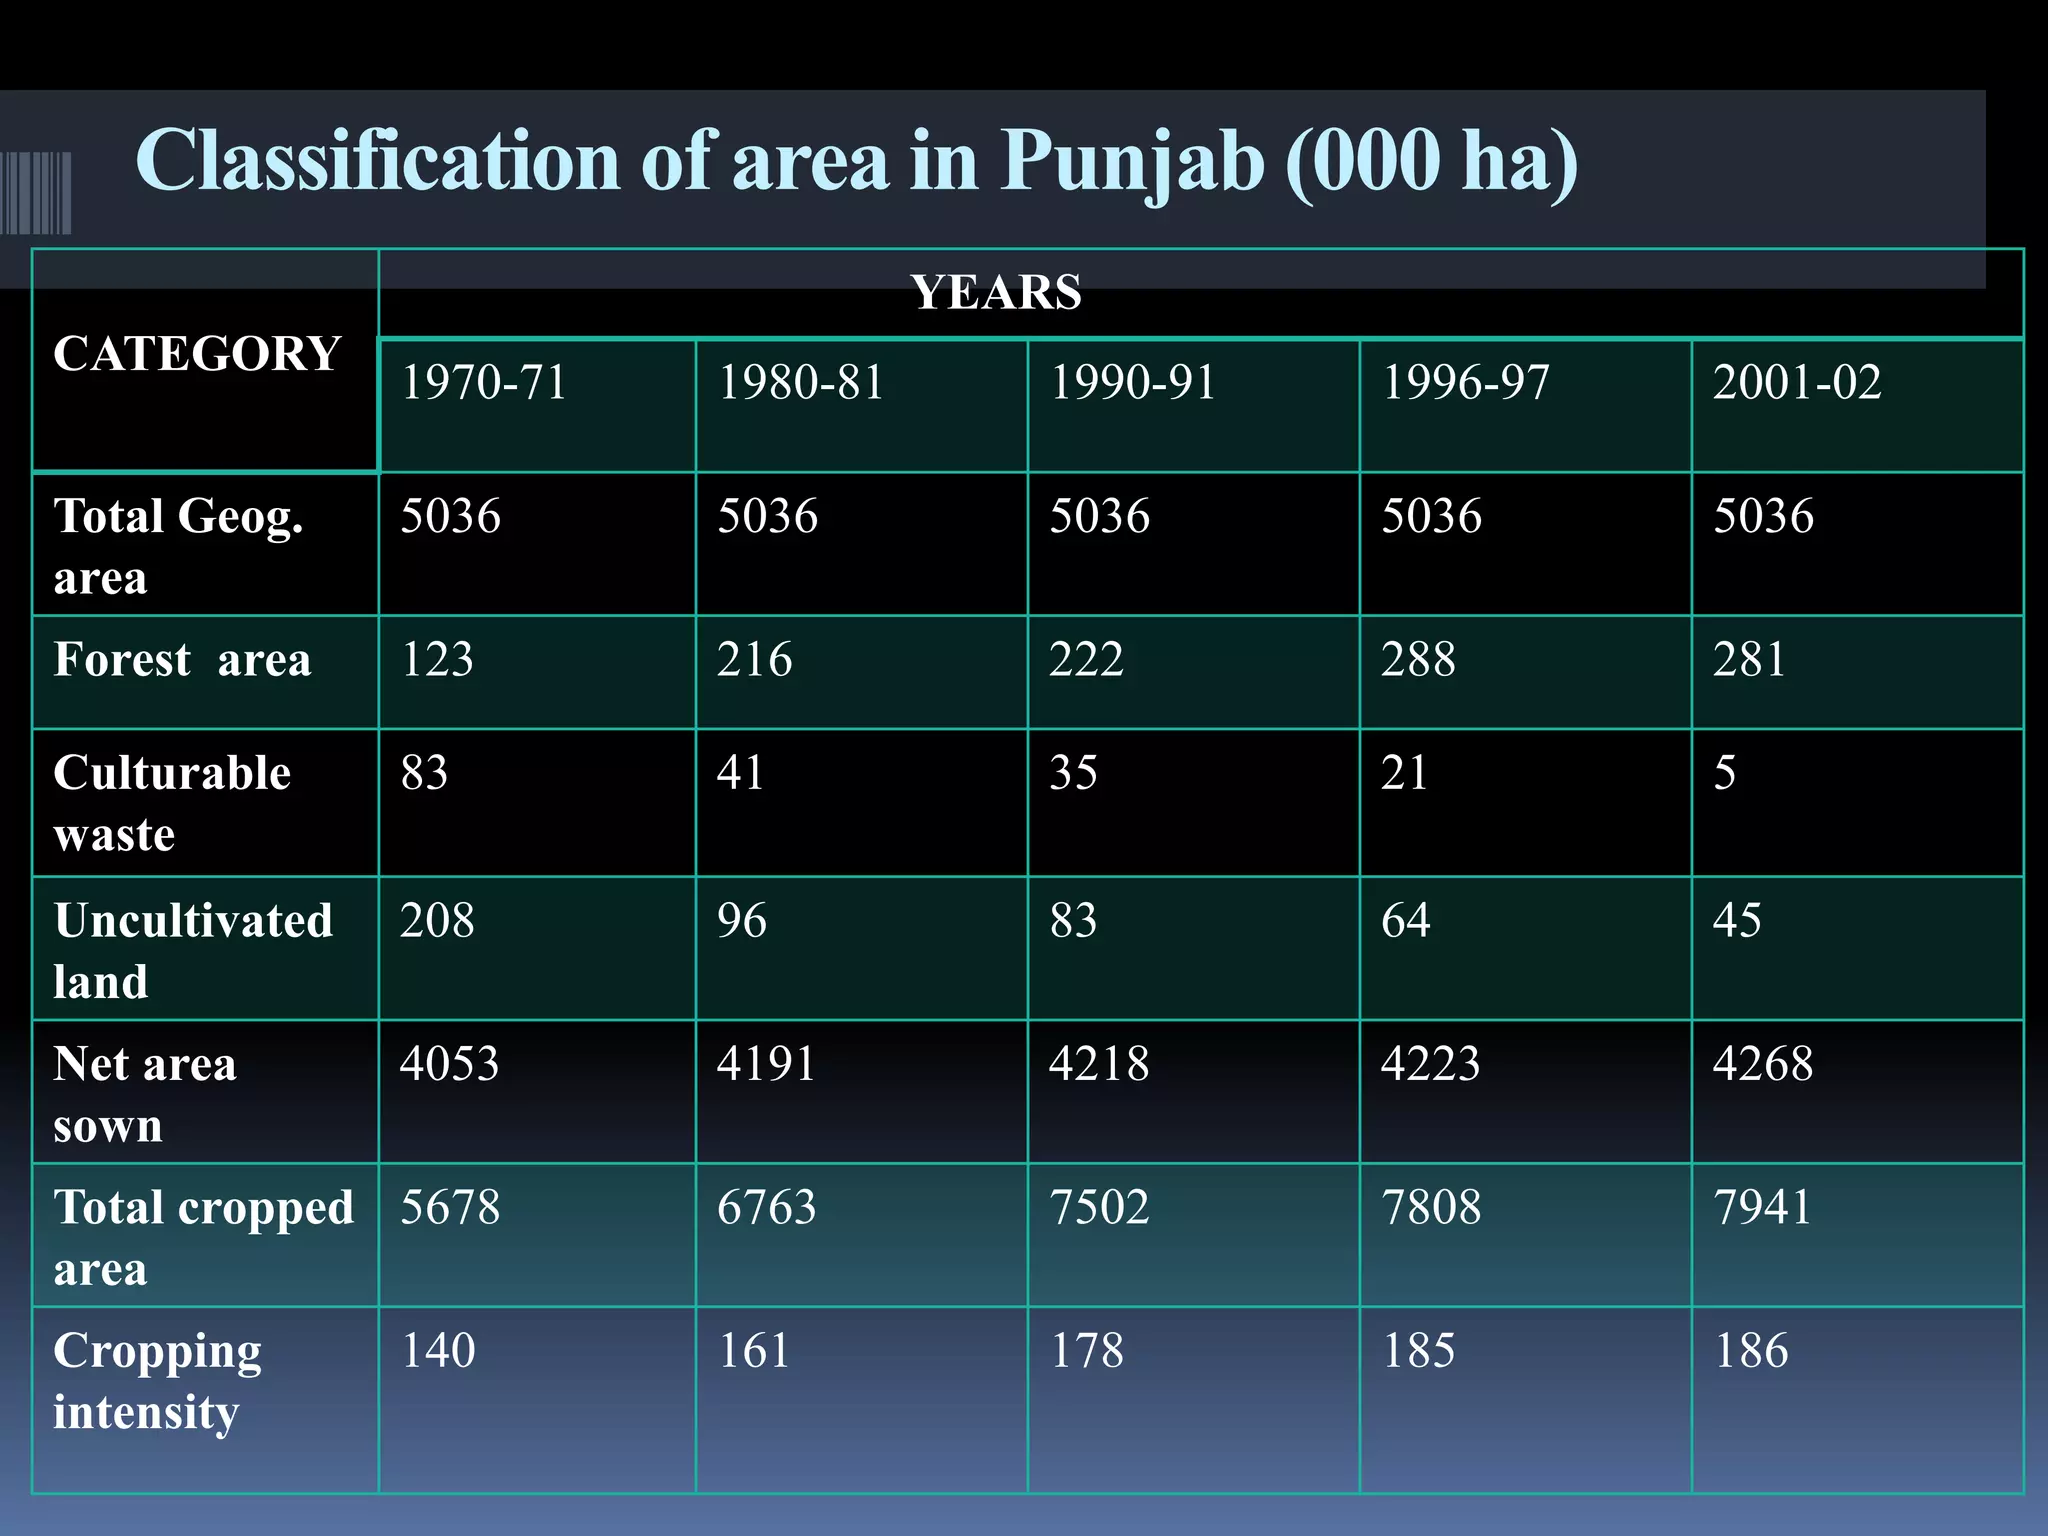
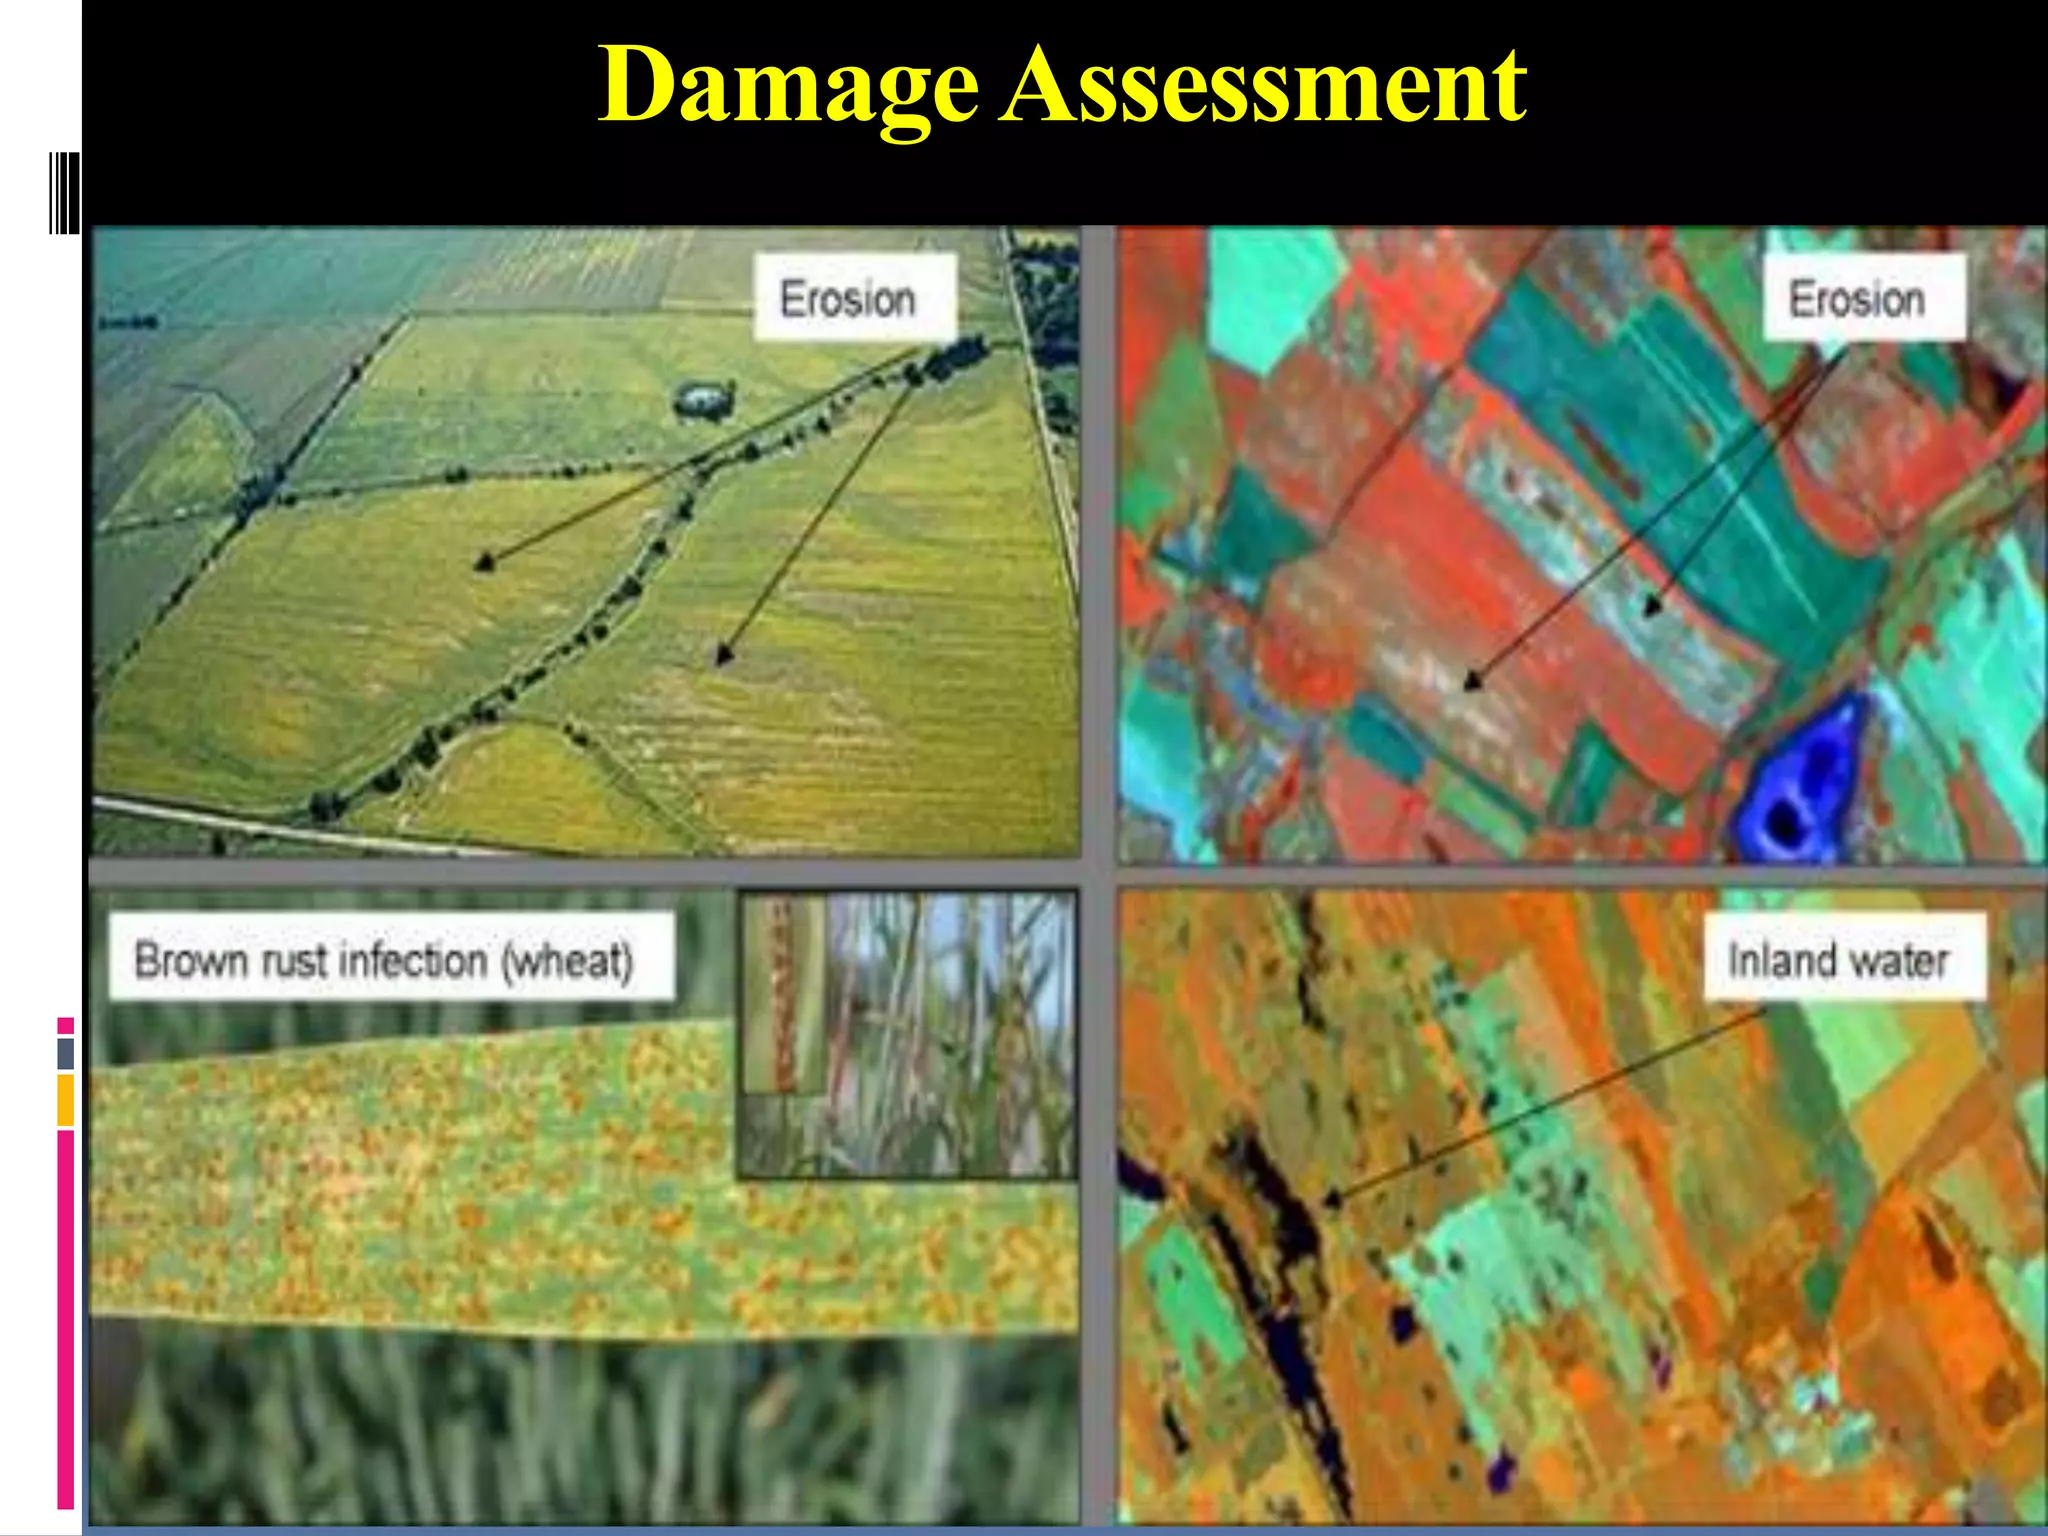
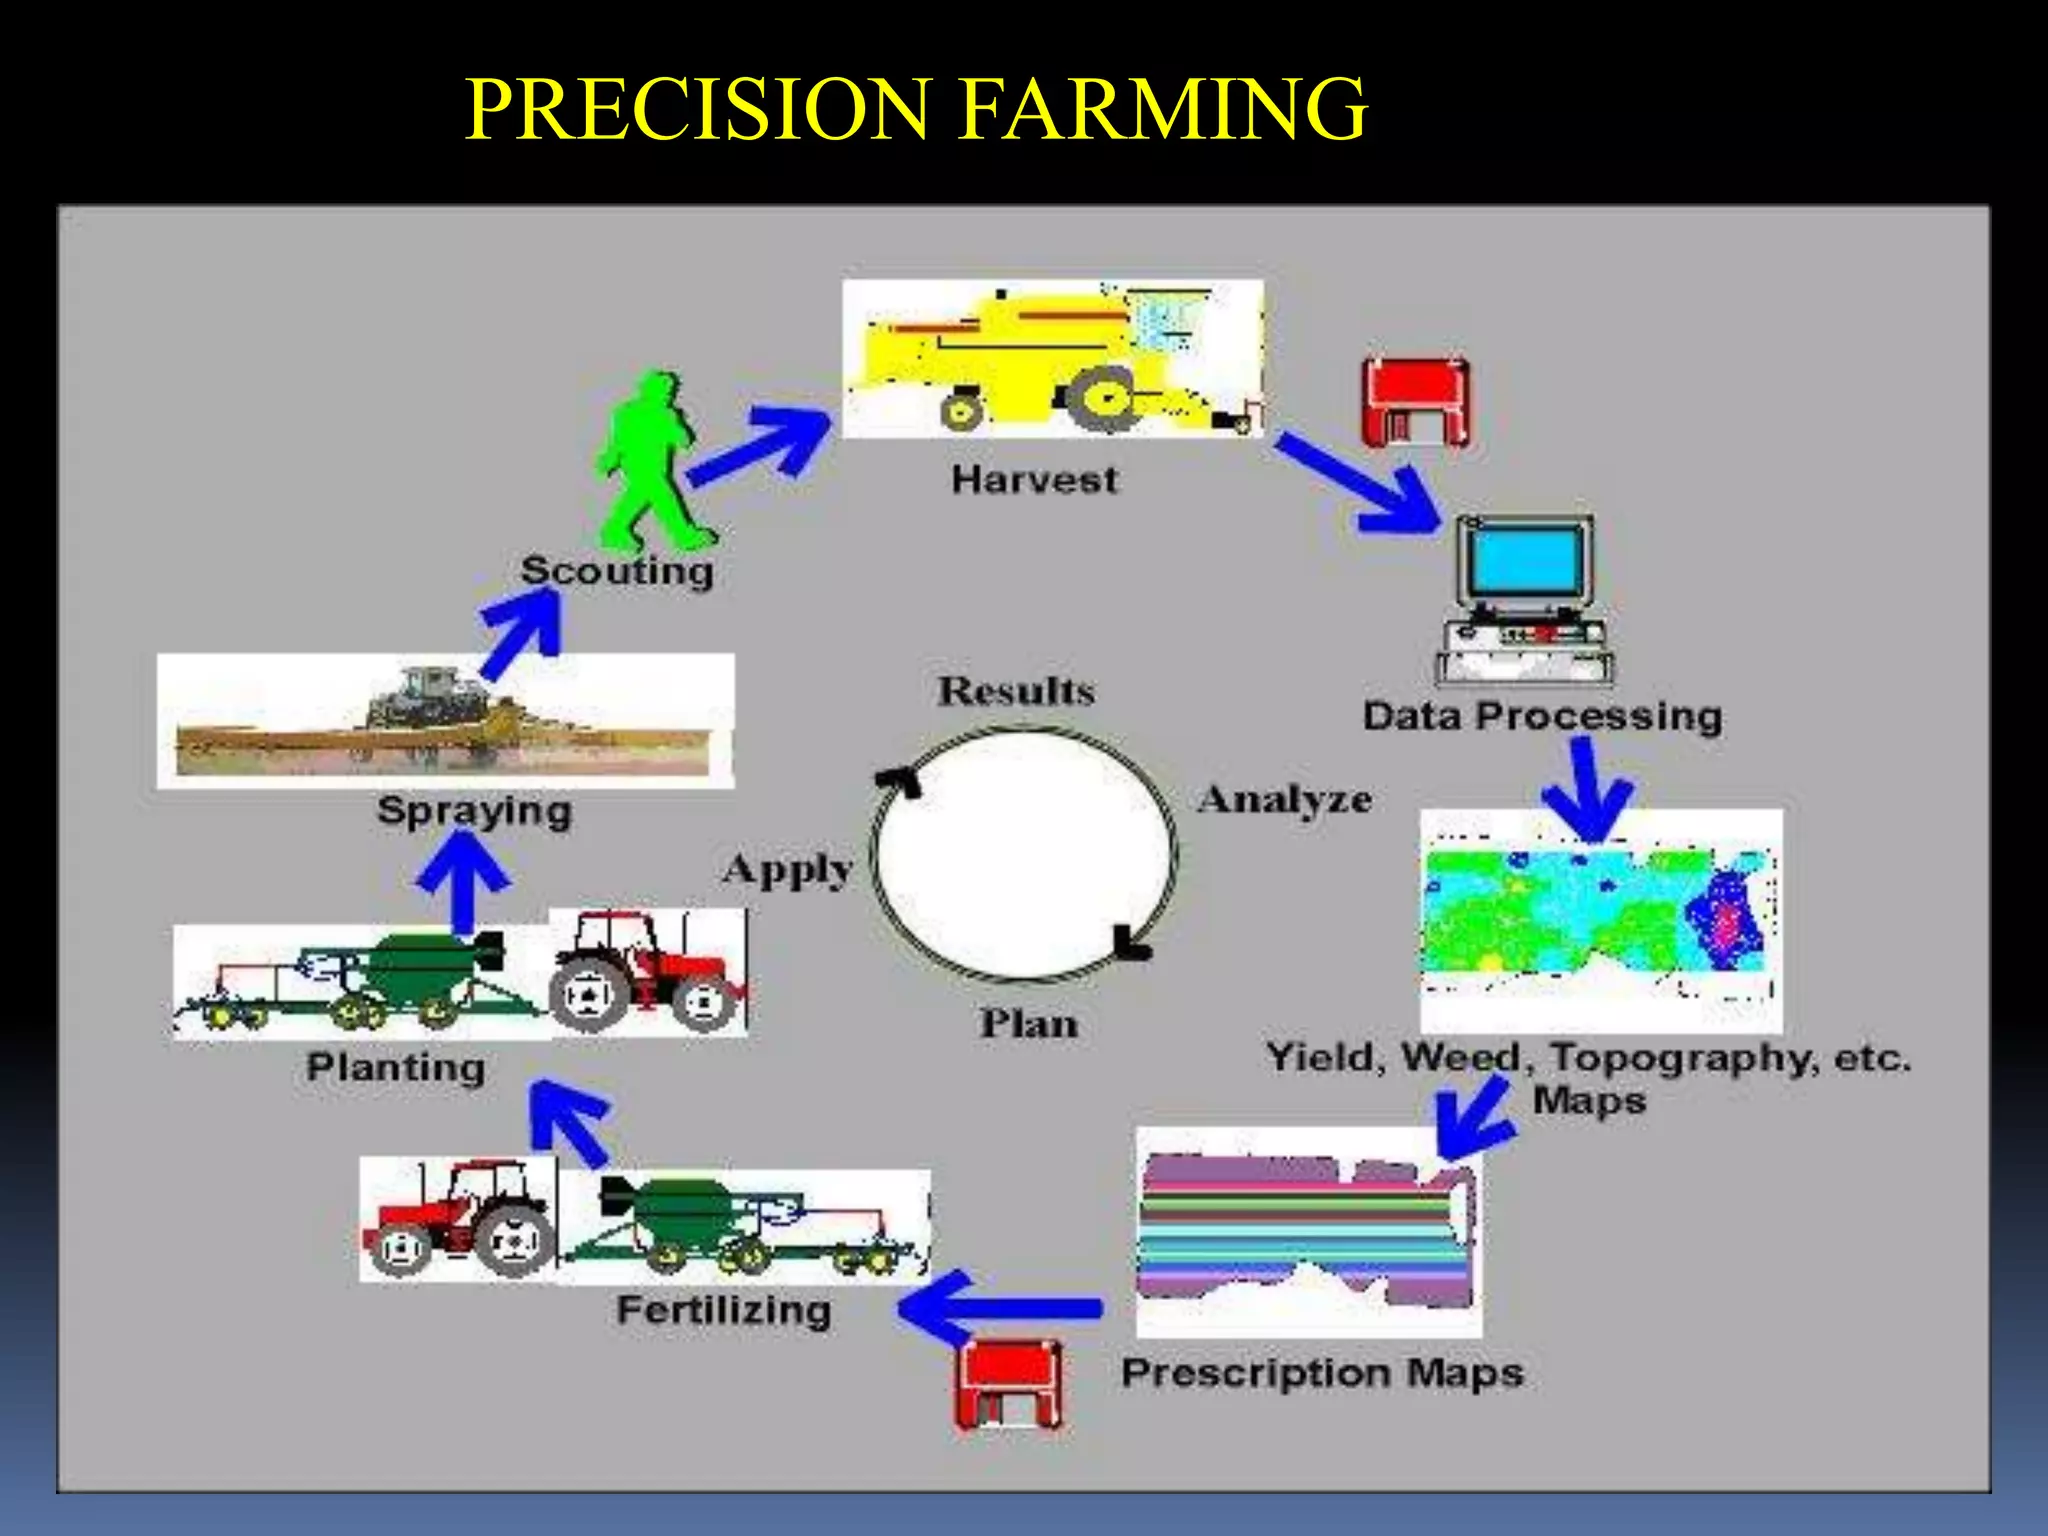
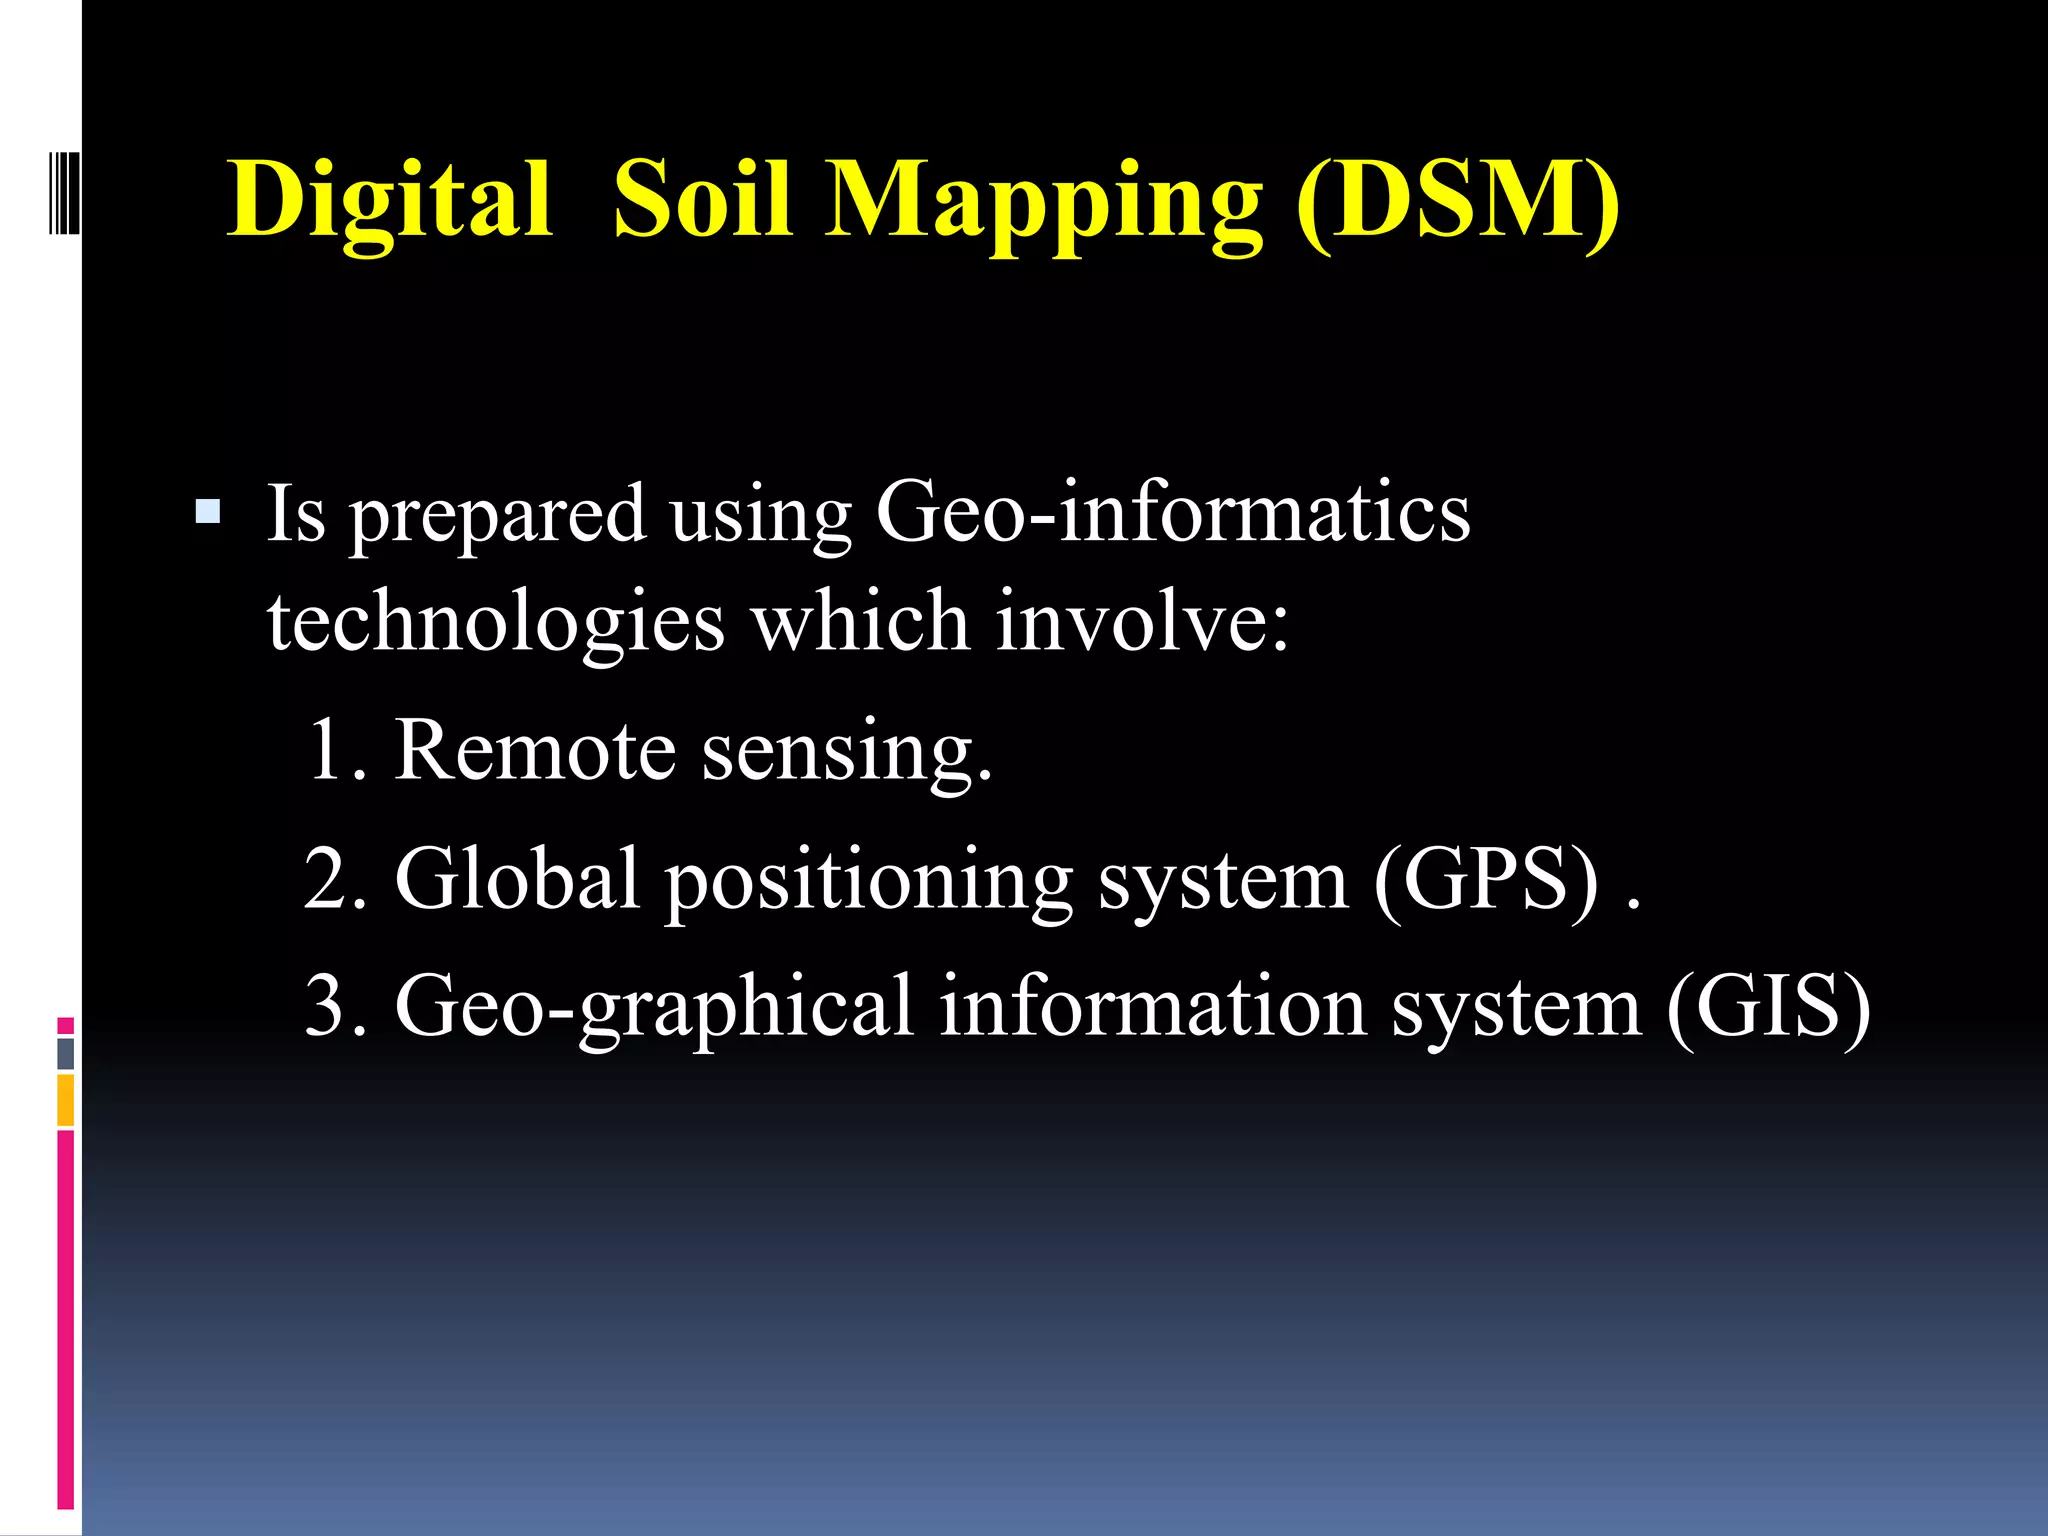
Call Girls In Pratap Nagar꧁❤ 🔝 9953056974🔝❤꧂ Escort ServiCe
use in remote sensing in agriculture
1. Credit Seminar
Use of Remote Sensing In Agriculture
HENA PARVEEN
M. Sc (Ag), 3rd SAMESTER
Department of Soil Science
Rajendra Agricultual University, Pusa
Samastipur, BIHAR
2. Outline of Presentation
Remote Sensing and its principle
Land use planning
Soil monitoring
Crop monitoring and Damage assessment
Precision farming
Thematic map
3. REMOTE SENSING
Remote sensing is a method for getting information
about different objects on the planet, without any
physical contacts with it.
Image Source: cimss.ssec.wisc.edu
4. GIS
GIS is a computer based tool for mapping and analysing
things that exist and events that happen on earth.
GIS operation requires two things – Computer system
and Geographic data.
Traditional GIS
New GIS
COMPUTER PLOTTER
MAP TYPEWRITER
5. GPS
GPS is a space-based satellite
navigation system.
Provides location in term of
Longitudinal, Latitudinal,
Altitudinal and time
information in all weather
condition, anywhere on or near
the Earth.
6. How remote sensing satellites work
Scientists have developed sensors and cameras
which can detect and record the energy
transmitted from the surface of the earth. These
cameras and sensors are placed aboard earth-
orbiting satellites that record and transmit the data
to receiving stations on the earth in digital form.
Technologists use computers and other devices to
produce images that can be analysed and
interpreted to obtain meaningful information on
conditions on the earth.
7.
8. Energy Source or
Illumination(A)
Radiation and the
Atmosphere(B)
Interaction with the Target (C)
Recording of Energy by the
Sensor (D)
Transmission, Reception, and
Processing (E)
Interpretation and Analysis (F)
Application (G
Elements of Remote Sensing
9. Spectral signatures
According to the physics of remote sensing ,
different surface object return different amount of
energy in different wavelength of the
electromagnetic spectrum .
Detection and measurements of these energy called
spectral signature enable identification of surface
objects both from the airborne and from the
spaceborne.
10. Airborne vs Ground-based platforms:
Satellite and airborne platforms offer
opportunities for rapid collection of data over
large areas but not beyond surface soil horizons.
Ground-based sensors on vehicles can provide
more information about the full soil profile.
11.
12. Land Use
Land cover means any surface cover on the
ground which can include vegetation, urban
infrastructure, water, lake, mountain,
transportation networks, buildings or any other.
The attributes measured by remote sensing
techniques relate to land cover.
13. Land use / Land cover Mapping
SCOPE
• Monitoring dynamic changes
• Urban/Rural infrastructure
• Water logging & salinity
BENEFITS
• Assessment of spatial distribution of land resources
• Infrastructure monitoring
• Future planning for better land management for socio-
economic development
14. Generated land use map using GIS technique which correlated
with statistics of India and Punjab .
Area under broad land use/land cover categories
CATEGORY
INDIA PUNJAB
AREA IN ( ha) % TGA AREA IN (ha) % TGA
Built up land 1,39,13,772 4.34 3,88,734 7.72
Agricultural land 16,52,44,359 51.58 39,33,383 78.10
Forests 6,57,10,815 20.51 1,83,900 3.65
Water land 4,43,90,315 13.85 3,03,226 6.02
Water bodies 1,06,10,820 3.31 1,32,832 2.64
other 2,05,26,819 6.41 94,125 1.87
total 32,03,96,900 100.00 50,36,200 100.00
15. Change inArea (%) under different categories of land use
during 1973-1989
Land use
classes
TEHSILE DISTT. TOTAL
Bathinda Talwandi Rampuraphul
URBAN 75.3 69.6 70.0 73.2
RURAL 64.0 82.0 66.0 68.7
CROP LAND -1.46 -1.25 -1.36 -1.37
POND 33.0 71.0 60.4 49.0
17. Normalized Difference Vegetation
Index
The Remote sensing data is used extensively for large area
vegetation monitoring.
NDVI is a mathematical quantity referring to a vegetation
indices.
NDVI = (Near IR – Red)/(Near IR +Red).
Range = -1 to +1
Clouds , water and snow have negative NDVI.
Soil and rock have a broadly similar reflectance giving NDVI
close to ‘0’.
Only active vegetation has a positive NDVI about 0.1 to 0.6
18. Non-Drought Drought
NDVI is responsive to vegetation condition
<0.5 = water
0.05-0.10=
0.10-0.16=
0.16-0.25=
0.26-0.33=
0.33-0.40=
0.41-0.58=
0.59-0.66=
>0.66=
19. Area under detailed land use/ land cover categories
Category India PUNJAB
Area in (ha) % TGA Area in (ha) % TGA
Agriculture land
Karif crop land 1205,86,769 3401258
Rabi crop land 763,00,445 3507019
Double cropped area 531,05,792 3095521
Net sown area 1437,81,426 44.88 3812756 75.75
Wasteland
Salt affected 19,88,380 0.62 51979 1.03
Waterlogged 12,19,666 0.38 26614 0.53
Marshy/Swampy 8,23,876 0.26 36
Water bodies
River/Stream 84,14,852 2.63 132831 2.64
Lake/Reservoir/Tank/
Canal
21,95,968 0.69
20. Classification of area in Punjab (000 ha)
CATEGORY
YEARS
1970-71 1980-81 1990-91 1996-97 2001-02
Total Geog.
area
5036 5036 5036 5036 5036
Forest area 123 216 222 288 281
Culturable
waste
83 41 35 21 5
Uncultivated
land
208 96 83 64 45
Net area
sown
4053 4191 4218 4223 4268
Total cropped
area
5678 6763 7502 7808 7941
Cropping
intensity
140 161 178 185 186
21. Soil Monitoring
Any effective soil monitoring scheme will take
account of differences between soil types and their
spatial distribution.
Remote sensing systems record electromagnetic
radiation (EMR) that has been reflected or emitted
from a target object. The physical and chemical
characteristics of the object, and indeed the choice of
wavelengths of EMR.
22. The broad current requirements for soil monitoring that might
be met by the use of remote sensing are as follows
1.Supporting data for development of adequate soil inventories, including:
a. general physical and chemical properties
b. landscape and land use data, e.g. terrain data
2. Information on soil quantities (on an area basis), that relate to soil
threats, including the extent of
a. erosion
b. landslides
c. soil organic carbon
d. contamination
e. salinity
3. Estimates of soil performance:
a. biomass productivity
b. hydrological performance, specifically flood occurrence
23. Crop monitoring and Damage assessment
Remote sensing imagery also gives the required spatial
overview of the land. Remote sensing can aid in identifying
crops affected by conditions that are too dry or wet, affected
by insect, weed or fungal infestations or weather related
damage .
Detecting damage and monitoring crop health requires
high-resolution, multi-spectral imagery and multi-temporal
imaging capabilities.
24. CROP MONITORING
Crop area estimation
Crop growth monitoring
Crop yield prediction
Satellite image distribution for winter wheat
monitoring
26. PRECISION FARMING
Precision farming is also referred as site specific
farming, Smart farming and GPS based farming.
The site specific application of input such as seed,
fertilizer and crop protection chemicals has the
potential to reduce input cost and maximize crop yield
and benefit environment.
This can be done by new emerging information
technology such as GPS, GIS, Remote Sensing.
28. Thematic Map
A thematic map is especially designed to show a
particular theme connected with a specific
geographical area. It provides:
(i) Specific information about particular location.
(ii) General information about spatial patterns and .
(iii)They can be used to compare patterns on two or
more maps
29. Digital Soil Mapping (DSM)
Is prepared using Geo-informatics
technologies which involve:
1. Remote sensing.
2. Global positioning system (GPS) .
3. Geo-graphical information system (GIS)