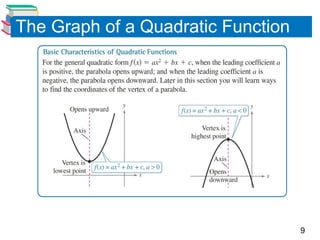
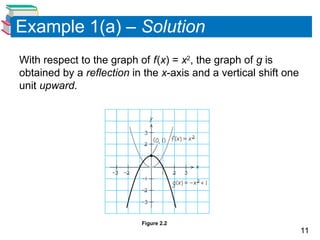
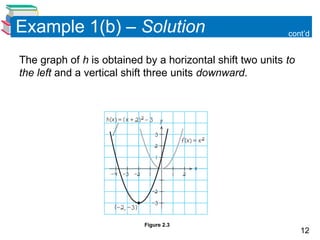
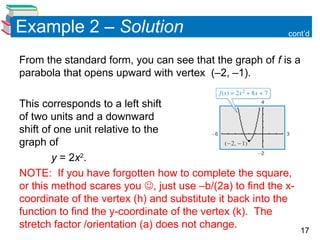
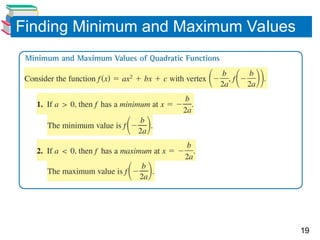
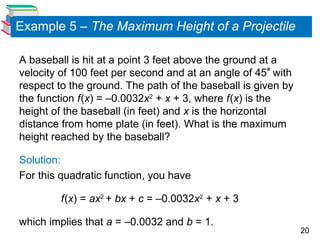
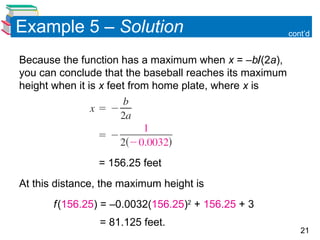
Copyright © Cengage Learning. All rights reserved.
2.1 Quadratic Functions
2
What You Should Learn
• Analyze graphs of quadratic functions.
• Write quadratic functions in standard form and
use the results to sketch graphs of functions.
• Find minimum and maximum values of
quadratic functions in real-life applications.
3
The Graph of a Quadratic Function
4
The Graph of a Quadratic Function
5
The Graph of a Quadratic Function
Polynomial functions are classified by degree. For instance,
the polynomial function
f(x) = a, a  0
has degree 0 and is called a constant function.
We have learned that the graph of this type of function is a
horizontal line. The polynomial function
f(x) = mx + b, m  0
has degree 1 and is called a linear function.
Constant function
Linear function
6
The Graph of a Quadratic Function
We have learned that the graph of f(x) = mx + b is a line
whose slope is m and whose y-intercept is (0, b). In this
section, you will study second-degree polynomial functions,
which are called quadratic functions.
7
The Graph of a Quadratic Function
The graph of a quadratic function is a special type of
U-shaped curve called a parabola.
Parabolas occur in many real-life applications, especially
those involving reflective properties, such as satellite
dishes or flashlight reflectors.
All parabolas are symmetric with respect to a line called the
axis of symmetry, or simply the axis of the parabola. The
point where the axis intersects the parabola is called the
vertex of the parabola.
8
The Graph of a Quadratic Function
9
The Graph of a Quadratic Function
10
Example 1 – Library of Parent Functions: f(x) = x2
Sketch the graph of the function and describe how the
graph is related to the graph of f(x) = x2
.
a. g(x) = –x2
+ 1
b. h(x) = (x + 2)2
– 3
11
Example 1(a) – Solution
With respect to the graph of f(x) = x2
, the graph of g is
obtained by a reflection in the x-axis and a vertical shift one
unit upward.
Figure 2.2
12
Example 1(b) – Solution cont’d
The graph of h is obtained by a horizontal shift two units to
the left and a vertical shift three units downward.
Figure 2.3
13
The Standard Form of a
Quadratic Function
14
The Standard Form of a Quadratic Function
The equation in Example 1(b) is written in the
standard form or “graphing form”
f(x) = a(x – h)2
+ k.
This form is especially convenient for sketching a parabola
because it identifies the vertex of the parabola as (h, k).
15
Example 2 – Identifying the Vertex of a Quadratic Function
Describe the graph of
f(x) = 2x2
+ 8x + 7
and identify the vertex.
Solution:
Write the quadratic function in standard form by completing
the square. We know that the first step is to factor out any
coefficient of x2
that is not 1.
f(x) = 2x2
+ 8x + 7 Write original function.
16
Example 2 – Solution cont’d
= (2x2
+ 8x) + 7
= 2(x2
+ 4x) + 7
= 2(x2
+ 4x + 4 – 4) + 7
= 2(x2
+ 4x + 4) – 2(4) + 7
= 2(x + 2)2
– 1
Factor 2 out of x-terms.
Add and subtract (4/2)2
= 4
Within parentheses to complete
the square
Group x-terms.
Write in standard form.
Regroup terms.
17
Example 2 – Solution
From the standard form, you can see that the graph of f is a
parabola that opens upward with vertex (–2, –1).
This corresponds to a left shift
of two units and a downward
shift of one unit relative to the
graph of
y = 2x2
.
NOTE: If you have forgotten how to complete the square,
or this method scares you , just use –b/(2a) to find the x-
coordinate of the vertex (h) and substitute it back into the
function to find the y-coordinate of the vertex (k). The
stretch factor /orientation (a) does not change.
cont’d
18
Finding Minimum and
Maximum Values
19
Finding Minimum and Maximum Values
20
A baseball is hit at a point 3 feet above the ground at a
velocity of 100 feet per second and at an angle of 45 with
respect to the ground. The path of the baseball is given by
the function f(x) = –0.0032x2
+ x + 3, where f(x) is the
height of the baseball (in feet) and x is the horizontal
distance from home plate (in feet). What is the maximum
height reached by the baseball?
Solution:
For this quadratic function, you have
f(x) = ax2
+ bx + c = –0.0032x2
+ x + 3
which implies that a = –0.0032 and b = 1.
Example 5 – The Maximum Height of a Projectile
21
Because the function has a maximum when x = –b(2a),
you can conclude that the baseball reaches its maximum
height when it is x feet from home plate, where x is
= 156.25 feet
At this distance, the maximum height is
f(156.25) = –0.0032(156.25)2
+ 156.25 + 3
= 81.125 feet.
cont’d
Example 5 – Solution

ENVIRONMENT ABOUT NATURE AND THE THINHS .ppt

  • 1.
    Copyright © CengageLearning. All rights reserved. 2.1 Quadratic Functions
  • 2.
    2 What You ShouldLearn • Analyze graphs of quadratic functions. • Write quadratic functions in standard form and use the results to sketch graphs of functions. • Find minimum and maximum values of quadratic functions in real-life applications.
  • 3.
    3 The Graph ofa Quadratic Function
  • 4.
    4 The Graph ofa Quadratic Function
  • 5.
    5 The Graph ofa Quadratic Function Polynomial functions are classified by degree. For instance, the polynomial function f(x) = a, a  0 has degree 0 and is called a constant function. We have learned that the graph of this type of function is a horizontal line. The polynomial function f(x) = mx + b, m  0 has degree 1 and is called a linear function. Constant function Linear function
  • 6.
    6 The Graph ofa Quadratic Function We have learned that the graph of f(x) = mx + b is a line whose slope is m and whose y-intercept is (0, b). In this section, you will study second-degree polynomial functions, which are called quadratic functions.
  • 7.
    7 The Graph ofa Quadratic Function The graph of a quadratic function is a special type of U-shaped curve called a parabola. Parabolas occur in many real-life applications, especially those involving reflective properties, such as satellite dishes or flashlight reflectors. All parabolas are symmetric with respect to a line called the axis of symmetry, or simply the axis of the parabola. The point where the axis intersects the parabola is called the vertex of the parabola.
  • 8.
    8 The Graph ofa Quadratic Function
  • 9.
    9 The Graph ofa Quadratic Function
  • 10.
    10 Example 1 –Library of Parent Functions: f(x) = x2 Sketch the graph of the function and describe how the graph is related to the graph of f(x) = x2 . a. g(x) = –x2 + 1 b. h(x) = (x + 2)2 – 3
  • 11.
    11 Example 1(a) –Solution With respect to the graph of f(x) = x2 , the graph of g is obtained by a reflection in the x-axis and a vertical shift one unit upward. Figure 2.2
  • 12.
    12 Example 1(b) –Solution cont’d The graph of h is obtained by a horizontal shift two units to the left and a vertical shift three units downward. Figure 2.3
  • 13.
    13 The Standard Formof a Quadratic Function
  • 14.
    14 The Standard Formof a Quadratic Function The equation in Example 1(b) is written in the standard form or “graphing form” f(x) = a(x – h)2 + k. This form is especially convenient for sketching a parabola because it identifies the vertex of the parabola as (h, k).
  • 15.
    15 Example 2 –Identifying the Vertex of a Quadratic Function Describe the graph of f(x) = 2x2 + 8x + 7 and identify the vertex. Solution: Write the quadratic function in standard form by completing the square. We know that the first step is to factor out any coefficient of x2 that is not 1. f(x) = 2x2 + 8x + 7 Write original function.
  • 16.
    16 Example 2 –Solution cont’d = (2x2 + 8x) + 7 = 2(x2 + 4x) + 7 = 2(x2 + 4x + 4 – 4) + 7 = 2(x2 + 4x + 4) – 2(4) + 7 = 2(x + 2)2 – 1 Factor 2 out of x-terms. Add and subtract (4/2)2 = 4 Within parentheses to complete the square Group x-terms. Write in standard form. Regroup terms.
  • 17.
    17 Example 2 –Solution From the standard form, you can see that the graph of f is a parabola that opens upward with vertex (–2, –1). This corresponds to a left shift of two units and a downward shift of one unit relative to the graph of y = 2x2 . NOTE: If you have forgotten how to complete the square, or this method scares you , just use –b/(2a) to find the x- coordinate of the vertex (h) and substitute it back into the function to find the y-coordinate of the vertex (k). The stretch factor /orientation (a) does not change. cont’d
  • 18.
  • 19.
    19 Finding Minimum andMaximum Values
  • 20.
    20 A baseball ishit at a point 3 feet above the ground at a velocity of 100 feet per second and at an angle of 45 with respect to the ground. The path of the baseball is given by the function f(x) = –0.0032x2 + x + 3, where f(x) is the height of the baseball (in feet) and x is the horizontal distance from home plate (in feet). What is the maximum height reached by the baseball? Solution: For this quadratic function, you have f(x) = ax2 + bx + c = –0.0032x2 + x + 3 which implies that a = –0.0032 and b = 1. Example 5 – The Maximum Height of a Projectile
  • 21.
    21 Because the functionhas a maximum when x = –b(2a), you can conclude that the baseball reaches its maximum height when it is x feet from home plate, where x is = 156.25 feet At this distance, the maximum height is f(156.25) = –0.0032(156.25)2 + 156.25 + 3 = 81.125 feet. cont’d Example 5 – Solution