Alg1 ch1101example123
•Download as PPS, PDF•
1 like•446 views
The document provides examples and steps for graphing functions of the form y=ax, y=ax+k, and identifying their domains and ranges. It discusses vertical stretches, shrinks, translations, and reflections of the graph of y=x. Example 1 graphs y=3x, which is a vertical stretch of y=x by a factor of 3. Example 2 graphs y=-0.5x, a vertical shrink and reflection of y=x. Example 3 graphs y=x+2, a vertical translation of y=x up by 2 units. The guided practice graphs additional functions and identifies their transformations compared to y=x.
Report
Share
Report
Share

Recommended
Higher Maths 1.2.2 - Graphs and Transformations
The document discusses different types of transformations that can be applied to functions and their graphs:
1) Translations slide the graph horizontally or vertically by adding or subtracting a value from the x- or y-coordinates.
2) Reflections flip the graph across the x- or y-axis by changing the sign of the x- or y-coordinates.
3) Distortions change the scale of the graph by multiplying all coordinates by a constant value, stretching or compressing the graph vertically or horizontally.
4) Composite transformations apply multiple transformations sequentially, such as reflecting and translating a parent graph to sketch a new transformed graph.
4.1 quadratic functions and transformations
This document discusses quadratic functions and their transformations. It defines key terms like parabola, vertex, and axis of symmetry. The vertex form of a quadratic function makes it easy to identify transformations - the a value determines stretching or compression, the h value shifts the graph horizontally, and the k value shifts it vertically. For any quadratic function, the minimum or maximum value will occur at the vertex. Graphing involves plotting the vertex and axis of symmetry, then using a table of values. Writing quadratic functions starts with identifying the vertex coordinates, then using another point to solve for the a value.
Graph of quadratic function
The document discusses graphing quadratic functions. It provides an example of graphing the function y = x^2 - 2x - 9. The key steps are:
1) Assign values to x ranging from -4 to 5 and calculate the corresponding y-values.
2) Plot the points (x, y) on a graph.
3) The graph will be a parabola, which can open upward, downward, rightward, or leftward depending on the equation.
LESSON-Effects of changing a,h and k in the Graph of Quadratic Function
The document discusses transforming quadratic functions into vertex form and describes how changing the values of a, h, and k affects the graph of the function. It then has students work in groups to graph and describe quadratic functions based on given equations in order to understand how the vertex, opening direction, and any shifts in the vertex position are represented algebraically.
6. 1 graphing quadratics
The document discusses graphing quadratic functions. It defines a quadratic function as an equation of the form y=ax^2 +bx+c where a ≠ 0, forming a U-shaped parabola. It explains that the vertex is the highest/lowest point and the axis of symmetry is the vertical line through the vertex. It provides steps for graphing a quadratic function by finding the vertex coordinates using the standard form equation, choosing x-values on each side of the vertex, calculating corresponding y-values, and plotting points connected with a smooth curve. An example problem demonstrates these steps.
Alg II Unit 4-1 Quadratic Functions and Transformations
The document provides an overview of quadratic functions and their transformations. It defines key concepts like parabolas, quadratic functions, vertex form, and the parent function. It explains how to graph quadratic functions and how their graphs are transformed through reflection, stretching, compression, and translation based on changes to the coefficients in the function. Examples are provided to demonstrate finding features of quadratic functions like the vertex, axis of symmetry, minimum/maximum values, and describing the transformations.
Grafica funciones cuadráticas
This document discusses solving quadratic equations by graphing related quadratic functions. It begins with examples of graphing quadratic functions of the form y=ax^2+bx+c and finding the x-intercepts, which are the solutions to the corresponding quadratic equation. Next, it provides examples of applying this process to solve application problems involving projectile motion. It concludes with a lesson quiz to assess understanding.
5 1 quadratic transformations
The document discusses transformations of quadratic functions, including horizontal and vertical translations, reflections, and stretches or compressions. Horizontal translations move the graph right or left, depending on the value of h in the function f(x) = (x - h)2. Vertical translations move the graph up or down depending on the value of k. The vertex of the parabola after any transformation is located at the point (h, k). Reflections occur when the value of a in the function f(x) = a(x)2 is negative, causing the graph to reflect over the x-axis. Stretches and compressions occur when the absolute value of a is greater or less than 1, respectively.
Graph of a linear function
The document discusses how to graph a linear function. It explains that the graph of a linear function is always a straight line. It recommends assigning at least 3 x-values and calculating their corresponding y-values to accurately plot the line. As an example, it shows how to graph the linear function y = 2x + 4 by assigning x-values from -2 to 2, calculating the corresponding y-values using the equation, and plotting the points on a graph.
IB Maths SL Transformations of functions
This document discusses transformations of graphs including translations, stretches, and reflections. It defines vertical and horizontal translations as shifting the graph of a function up or down by adding a constant c, or shifting it left or right by changing the input by a constant b. Stretches are defined as vertically stretching by a scale factor a or horizontally by 1/a. Reflections are defined as reflecting the graph across the x or y-axis. Examples and exercises are provided to illustrate each type of transformation.
Mathematics 9 Lesson 3: Quadratic Functions
This powerpoint presentation discusses or talks about the topic or lesson Functions. It also discusses and explains the rules, steps and examples of Quadratic Functions.
Parts of quadratic function and transforming to general form to vertex form a...
This document contains notes and materials for a Math 9 class covering quadratic functions for the 6th week of the 1st quarter. It includes:
1. A math prayer to work problems and trust in God's help.
2. An overview of topics to be covered: illustrating quadratic functions, transforming between general and vertex forms, and determining parts of quadratic graphs.
3. A review question asking students to identify which situation represents a quadratic function.
4. Examples of transforming between the general and vertex forms of quadratic functions.
5. Key parts of graphs of quadratic functions including the vertex, axis of symmetry, x- and y-intercepts, and the effect of the leading coefficient on
Graphing Quadratic Functions in Standard Form
This document discusses graphing quadratic functions of the form y = ax^2 + bx + c. It provides the following key points:
- Quadratic functions produce parabolic graphs that open up or down depending on whether a is positive or negative.
- The vertex of the parabola is the point of minimum or maximum, which corresponds to the line of symmetry that passes through it.
- To graph a quadratic, one finds the line of symmetry, determines the vertex coordinates, and plots at least four other points to connect into a smooth curve.
Graphing rational functions
This document discusses how to graph rational functions. It explains that rational functions have vertical and horizontal asymptotes. Vertical asymptotes occur when the denominator is set equal to zero. Horizontal asymptotes depend on the degrees of the numerator and denominator. If the denominator degree is greater, the horizontal asymptote is the x-axis. If the degrees are the same, the asymptote is found by dividing the leading coefficients. If there is a vertical shift, the asymptote is the same as the shift value. Examples are provided to demonstrate graphing different rational functions based on their asymptotes.
Graphs of trigonometric exponential functions lecture
The document describes properties of trigonometric and exponential functions. It discusses:
1) The graphs of sine and cosine functions have a domain of real numbers, range from -1 to 1, and cycle through these values every 2π units of x with a smooth curve.
2) Exponential functions with a base greater than 1 have a domain of all real numbers, range from 0 to infinity, and increase rapidly with horizontal asymptote at y=0.
3) The amplitude and period of trigonometric functions can be adjusted through multiplication and composition with other functions.
Alg1 ch1101example45
The document provides examples and instructions for graphing functions of the form y = x - h and y = a(x - h) + k. It discusses graphing the specific functions y = x - 4 and y = 2x - 1. It identifies that y = x - h involves a horizontal shift of h units, while y = a(x - h) + k involves a horizontal shift of h units and a vertical shift of k units. The document also provides guided practice problems asking to graph y = x + 3 and identify the domain and range of the function in Example 5.
Polynomial and thier graphs
Graphs of polynomial functions are smooth and continuous, with no sharp corners or breaks. They can be drawn without lifting your pencil from the paper. A polynomial graph's behavior as x increases or decreases depends on whether its highest term has an even or odd degree. For even degrees, the graph rises or falls on both sides depending on the leading coefficient's sign. For odd degrees, the graph falls and rises or vice versa.
Graph Quadratics
The document discusses graphing quadratic functions in standard form (y=ax^2 + bx + c). It explains that the graph is a parabola that can open up or down depending on whether a is positive or negative. The line of symmetry for the parabola passes through the vertex and is given by the equation x=-b/2a. The steps to graph are: 1) find the line of symmetry, 2) plug the x-value into the original equation to find the vertex, 3) find two other points and reflect them across the line of symmetry.
Quadratic functions
The document discusses quadratic functions and equations. It defines a quadratic function as a polynomial of the second degree of the form f(x)=ax^2 + bx + c, where a ≠ 0. It describes how the discriminant determines the number of solutions and the relationship between the sign of coefficients a and d and the graph of the quadratic function. Examples are also provided to illustrate key concepts like finding the vertex, zeroes, and maximum/minimum values of quadratic functions.
Alg II Unit 4-2 Standard Form of a Quadratic Function
This document discusses the standard form of a quadratic function y = ax^2 + bx + c and provides examples of:
- Converting quadratic equations between standard and vertex form
- Using the properties of quadratic functions to find the vertex, axis of symmetry, minimum/maximum values, y-intercept
- Graphing quadratic functions by hand and with a calculator to identify key features
It also provides examples of interpreting real world applications that can be modeled with quadratic functions.
Functions for Grade 10
This document discusses functions and their properties. It defines a function as a special relation where each first element is paired with exactly one second element. Functions are represented as sets of ordered pairs. The domain of a function is the set of all possible x-values, while the range is the set of all possible y-values. Functions can be represented graphically and through equations, and can be transformed through shifts, reflections, and stretching/shrinking. Common function families include linear, quadratic, exponential, and trigonometric functions.
Rational function representation
This document discusses rational functions and provides examples of representing rational functions through tables of values, graphs, and equations. It defines a rational function as a function of the form f(x) = p(x)/q(x) where p(x) and q(x) are polynomials and q(x) is not the zero function. Examples are given of using rational functions to model speed as a function of time for running a 100-meter dash and calculating winning percentages in a basketball league.
Graphing Quadratic Functions
Quadratic functions are modeled by the equation y = ax^2 + bx + c, where a ≠ 0. They produce U-shaped parabolic graphs. Many real-world phenomena follow quadratic patterns, like water in a fountain or a basketball's trajectory. The lowest or highest point on a parabola is the vertex. To graph a quadratic function in standard form, you first find the vertex by calculating -b/2a, then plot the axis of symmetry and other points to sketch the parabolic curve.
Linear functions
The document discusses different forms and methods for graphing linear functions, including:
1) The standard, point-slope, and slope-intercept forms of linear equations.
2) Converting between these forms by solving for slope and y-intercept.
3) Graphing linear functions by finding the slope from two points using the point-slope form, making a table of x-y values, or finding the x- and y-intercepts.
4) Determining if two functions are parallel or perpendicular based on having equal or reciprocal slopes.
Rational Function
An asymptote is an imaginary line that a graph approaches but never touches as it goes to infinity. The document provides examples of graphs with rational functions that have vertical and horizontal asymptotes. It also discusses the square root function and how it is the inverse of the quadratic function. The square root function is only defined for non-negative inputs. Changing the parameters a and b in the square root function changes the shape and orientation of the graph.
Semana 22 funciones ii álgebra uni ccesa007
The document discusses key concepts about function graphs including:
- The graph of a function represents all the ordered pairs (x,y) where y=f(x)
- Notable function graphs include constant, sign, identity, and linear functions
- The graph of a quadratic function f(x)=ax^2+bx+c is a parabola that can be used to find the vertex and x-intercepts
April 13, 2015
This document contains information about a math class that is reviewing quadratic functions. It includes:
1. An outline of the class agenda which focuses on reviewing key concepts like how the b-value affects the parabola and completing classwork.
2. Details about grading which includes assignments, homework, tests, the final exam, and notebook checks.
3. Sample problems and class notes focused on quadratic functions, including the axis of symmetry, vertex, graphing techniques, and how changing a, b, and c values impacts the parabola.
4. Examples of completing the steps to graph quadratic functions like plotting points and reflecting over the axis of symmetry.
5HBC: How to Graph Implicit Relations Intro Packet!
This document discusses five methods for graphing implicit functions on a TI-83 graphing calculator:
1. Using function mode, programming, and Euler's method to graph solutions to a differential equation defined by the implicit function.
2. Using parametric mode and the quadratic formula to solve the implicit function for x as a parametric function of t.
3. Using function mode, solving for x as a function of y, and using DrawInv to graph the inverse relation.
4. Using function mode and the Solve() command to numerically solve the implicit equation for y as a function of x.
5. Using polar mode by rewriting the implicit equation in terms of r and θ and graphing r
Continuity endbehavior
All polynomial functions are continuous, while rational functions can be discontinuous at points where the denominator is zero. The document discusses the continuity and end behavior of polynomials, noting there are four possibilities for their end behavior: up on both ends, down on both ends, up on the right and down on the left, or up on the left and down on the right. It provides examples of polynomial functions that demonstrate each type of end behavior.
Graphing Polynomials
Polynomial equations can be graphed based on their degree and end behavior. If the degree is even and positive, the ends will open up, and if odd and positive one end will be down and one up. The ends will both be down if the degree is even and negative, or up and down if odd and negative. Additionally, if the power is even the line will bounce at points, pass through if to the first power, or squiggle through if the power is odd.
More Related Content
What's hot
Graph of a linear function
The document discusses how to graph a linear function. It explains that the graph of a linear function is always a straight line. It recommends assigning at least 3 x-values and calculating their corresponding y-values to accurately plot the line. As an example, it shows how to graph the linear function y = 2x + 4 by assigning x-values from -2 to 2, calculating the corresponding y-values using the equation, and plotting the points on a graph.
IB Maths SL Transformations of functions
This document discusses transformations of graphs including translations, stretches, and reflections. It defines vertical and horizontal translations as shifting the graph of a function up or down by adding a constant c, or shifting it left or right by changing the input by a constant b. Stretches are defined as vertically stretching by a scale factor a or horizontally by 1/a. Reflections are defined as reflecting the graph across the x or y-axis. Examples and exercises are provided to illustrate each type of transformation.
Mathematics 9 Lesson 3: Quadratic Functions
This powerpoint presentation discusses or talks about the topic or lesson Functions. It also discusses and explains the rules, steps and examples of Quadratic Functions.
Parts of quadratic function and transforming to general form to vertex form a...
This document contains notes and materials for a Math 9 class covering quadratic functions for the 6th week of the 1st quarter. It includes:
1. A math prayer to work problems and trust in God's help.
2. An overview of topics to be covered: illustrating quadratic functions, transforming between general and vertex forms, and determining parts of quadratic graphs.
3. A review question asking students to identify which situation represents a quadratic function.
4. Examples of transforming between the general and vertex forms of quadratic functions.
5. Key parts of graphs of quadratic functions including the vertex, axis of symmetry, x- and y-intercepts, and the effect of the leading coefficient on
Graphing Quadratic Functions in Standard Form
This document discusses graphing quadratic functions of the form y = ax^2 + bx + c. It provides the following key points:
- Quadratic functions produce parabolic graphs that open up or down depending on whether a is positive or negative.
- The vertex of the parabola is the point of minimum or maximum, which corresponds to the line of symmetry that passes through it.
- To graph a quadratic, one finds the line of symmetry, determines the vertex coordinates, and plots at least four other points to connect into a smooth curve.
Graphing rational functions
This document discusses how to graph rational functions. It explains that rational functions have vertical and horizontal asymptotes. Vertical asymptotes occur when the denominator is set equal to zero. Horizontal asymptotes depend on the degrees of the numerator and denominator. If the denominator degree is greater, the horizontal asymptote is the x-axis. If the degrees are the same, the asymptote is found by dividing the leading coefficients. If there is a vertical shift, the asymptote is the same as the shift value. Examples are provided to demonstrate graphing different rational functions based on their asymptotes.
Graphs of trigonometric exponential functions lecture
The document describes properties of trigonometric and exponential functions. It discusses:
1) The graphs of sine and cosine functions have a domain of real numbers, range from -1 to 1, and cycle through these values every 2π units of x with a smooth curve.
2) Exponential functions with a base greater than 1 have a domain of all real numbers, range from 0 to infinity, and increase rapidly with horizontal asymptote at y=0.
3) The amplitude and period of trigonometric functions can be adjusted through multiplication and composition with other functions.
Alg1 ch1101example45
The document provides examples and instructions for graphing functions of the form y = x - h and y = a(x - h) + k. It discusses graphing the specific functions y = x - 4 and y = 2x - 1. It identifies that y = x - h involves a horizontal shift of h units, while y = a(x - h) + k involves a horizontal shift of h units and a vertical shift of k units. The document also provides guided practice problems asking to graph y = x + 3 and identify the domain and range of the function in Example 5.
Polynomial and thier graphs
Graphs of polynomial functions are smooth and continuous, with no sharp corners or breaks. They can be drawn without lifting your pencil from the paper. A polynomial graph's behavior as x increases or decreases depends on whether its highest term has an even or odd degree. For even degrees, the graph rises or falls on both sides depending on the leading coefficient's sign. For odd degrees, the graph falls and rises or vice versa.
Graph Quadratics
The document discusses graphing quadratic functions in standard form (y=ax^2 + bx + c). It explains that the graph is a parabola that can open up or down depending on whether a is positive or negative. The line of symmetry for the parabola passes through the vertex and is given by the equation x=-b/2a. The steps to graph are: 1) find the line of symmetry, 2) plug the x-value into the original equation to find the vertex, 3) find two other points and reflect them across the line of symmetry.
Quadratic functions
The document discusses quadratic functions and equations. It defines a quadratic function as a polynomial of the second degree of the form f(x)=ax^2 + bx + c, where a ≠ 0. It describes how the discriminant determines the number of solutions and the relationship between the sign of coefficients a and d and the graph of the quadratic function. Examples are also provided to illustrate key concepts like finding the vertex, zeroes, and maximum/minimum values of quadratic functions.
Alg II Unit 4-2 Standard Form of a Quadratic Function
This document discusses the standard form of a quadratic function y = ax^2 + bx + c and provides examples of:
- Converting quadratic equations between standard and vertex form
- Using the properties of quadratic functions to find the vertex, axis of symmetry, minimum/maximum values, y-intercept
- Graphing quadratic functions by hand and with a calculator to identify key features
It also provides examples of interpreting real world applications that can be modeled with quadratic functions.
Functions for Grade 10
This document discusses functions and their properties. It defines a function as a special relation where each first element is paired with exactly one second element. Functions are represented as sets of ordered pairs. The domain of a function is the set of all possible x-values, while the range is the set of all possible y-values. Functions can be represented graphically and through equations, and can be transformed through shifts, reflections, and stretching/shrinking. Common function families include linear, quadratic, exponential, and trigonometric functions.
Rational function representation
This document discusses rational functions and provides examples of representing rational functions through tables of values, graphs, and equations. It defines a rational function as a function of the form f(x) = p(x)/q(x) where p(x) and q(x) are polynomials and q(x) is not the zero function. Examples are given of using rational functions to model speed as a function of time for running a 100-meter dash and calculating winning percentages in a basketball league.
Graphing Quadratic Functions
Quadratic functions are modeled by the equation y = ax^2 + bx + c, where a ≠ 0. They produce U-shaped parabolic graphs. Many real-world phenomena follow quadratic patterns, like water in a fountain or a basketball's trajectory. The lowest or highest point on a parabola is the vertex. To graph a quadratic function in standard form, you first find the vertex by calculating -b/2a, then plot the axis of symmetry and other points to sketch the parabolic curve.
Linear functions
The document discusses different forms and methods for graphing linear functions, including:
1) The standard, point-slope, and slope-intercept forms of linear equations.
2) Converting between these forms by solving for slope and y-intercept.
3) Graphing linear functions by finding the slope from two points using the point-slope form, making a table of x-y values, or finding the x- and y-intercepts.
4) Determining if two functions are parallel or perpendicular based on having equal or reciprocal slopes.
Rational Function
An asymptote is an imaginary line that a graph approaches but never touches as it goes to infinity. The document provides examples of graphs with rational functions that have vertical and horizontal asymptotes. It also discusses the square root function and how it is the inverse of the quadratic function. The square root function is only defined for non-negative inputs. Changing the parameters a and b in the square root function changes the shape and orientation of the graph.
Semana 22 funciones ii álgebra uni ccesa007
The document discusses key concepts about function graphs including:
- The graph of a function represents all the ordered pairs (x,y) where y=f(x)
- Notable function graphs include constant, sign, identity, and linear functions
- The graph of a quadratic function f(x)=ax^2+bx+c is a parabola that can be used to find the vertex and x-intercepts
April 13, 2015
This document contains information about a math class that is reviewing quadratic functions. It includes:
1. An outline of the class agenda which focuses on reviewing key concepts like how the b-value affects the parabola and completing classwork.
2. Details about grading which includes assignments, homework, tests, the final exam, and notebook checks.
3. Sample problems and class notes focused on quadratic functions, including the axis of symmetry, vertex, graphing techniques, and how changing a, b, and c values impacts the parabola.
4. Examples of completing the steps to graph quadratic functions like plotting points and reflecting over the axis of symmetry.
5HBC: How to Graph Implicit Relations Intro Packet!
This document discusses five methods for graphing implicit functions on a TI-83 graphing calculator:
1. Using function mode, programming, and Euler's method to graph solutions to a differential equation defined by the implicit function.
2. Using parametric mode and the quadratic formula to solve the implicit function for x as a parametric function of t.
3. Using function mode, solving for x as a function of y, and using DrawInv to graph the inverse relation.
4. Using function mode and the Solve() command to numerically solve the implicit equation for y as a function of x.
5. Using polar mode by rewriting the implicit equation in terms of r and θ and graphing r
What's hot (20)
Parts of quadratic function and transforming to general form to vertex form a...
Parts of quadratic function and transforming to general form to vertex form a...
Graphs of trigonometric exponential functions lecture
Graphs of trigonometric exponential functions lecture
Alg II Unit 4-2 Standard Form of a Quadratic Function
Alg II Unit 4-2 Standard Form of a Quadratic Function
5HBC: How to Graph Implicit Relations Intro Packet!
5HBC: How to Graph Implicit Relations Intro Packet!
Viewers also liked
Continuity endbehavior
All polynomial functions are continuous, while rational functions can be discontinuous at points where the denominator is zero. The document discusses the continuity and end behavior of polynomials, noting there are four possibilities for their end behavior: up on both ends, down on both ends, up on the right and down on the left, or up on the left and down on the right. It provides examples of polynomial functions that demonstrate each type of end behavior.
Graphing Polynomials
Polynomial equations can be graphed based on their degree and end behavior. If the degree is even and positive, the ends will open up, and if odd and positive one end will be down and one up. The ends will both be down if the degree is even and negative, or up and down if odd and negative. Additionally, if the power is even the line will bounce at points, pass through if to the first power, or squiggle through if the power is odd.
Notes - Graphs of Polynomials
The document discusses graphing and interpreting various polynomial functions using a graphing calculator. It examines the graphs of y=x-1, y=x^2-4, and y=x^3+x^2-12 to note their similarities and differences in terms of degree, number of turns, and x-intercepts. It then explores how changing the coefficients of a cubic function impacts its graph. Finally, it interprets key features of the graph of y=x^3-5x^2+x-5 such as its degree, number of turns, x-intercept, maximum and minimum points.
5.1 part 1
This document summarizes key concepts about polynomial functions including:
- Definitions of monomials, polynomials, and polynomial functions
- The standard form and classification of polynomials by degree and number of terms
- How the degree of a polynomial affects the shape of its graph, including the number of turning points and end behavior
- Examples of determining the end behavior and classifying increasing and decreasing parts of polynomial graphs
6.4 Graphing Polynomials (Relative Max/Min, Zeros)
This document provides information on key concepts for graphing polynomial functions such as relative maximums and minimums, finding zeros of a function, and making tables of values to graph functions. It includes examples of making tables and graphs for the functions f(x) = -x3 - 4x2 + 5 and f(x) = x4 – x3 - 4x2 + 1. For the latter function, the document identifies that the zeros occur between -2 and -1, -1 and 0, and 0 and 1. It also shows working through an example to find the relative maximum and minimum values for the function f(x) = x3 – 4x2 + 5, identifying the relative max near x
Teaching Graphs of Polynomial Functions
This presentation helps the user to Examine the graph of polynomial functions with the use of Geogebra Application.
Add/Subtracting Polynomials
The student will learn to:
1. Add and subtract polynomials by grouping like terms.
2. Use column form to add and subtract polynomials with three terms.
3. Simplify polynomial expressions involving addition and subtraction.
SIM for Mathematics; Addition and Subtraction of Rational Numbers
This document provides guidance and activities for teaching addition and subtraction of rational numbers (fractions). It includes an overview, learning competencies, and 4 activities - identifying similar and dissimilar fractions, adding and subtracting similar fractions, determining the least common denominator, and adding and subtracting dissimilar fractions. Assessment cards and an enrichment problem are also included to check understanding.
Viewers also liked (8)
6.4 Graphing Polynomials (Relative Max/Min, Zeros)
6.4 Graphing Polynomials (Relative Max/Min, Zeros)
SIM for Mathematics; Addition and Subtraction of Rational Numbers
SIM for Mathematics; Addition and Subtraction of Rational Numbers
Similar to Alg1 ch1101example123
April 10, 2015
The document discusses graphing quadratic functions. It begins with reviewing key concepts like the vertex and axis of symmetry. The effects of the a, b, and c coefficients on the parabola are explained. Examples are provided to show how changing these values affects the width, direction opened, and vertical translation of the graph. The class will graph various quadratic functions by finding the axis of symmetry, vertex, y-intercept, and other points to plot the parabola. Students are assigned class work problems to graph quadratic functions and show their work.
Graph a function
This document provides an overview of various types of functions and their graphs. It begins with linear functions of the form y=mx+c and discusses how shifting these functions along the x- or y-axis changes their graphs. It then covers quadratic, square root, cube, reciprocal, constant, identity and absolute value functions. Piecewise, polynomial, algebraic, and transcendental functions are also defined. The document discusses bounded vs unbounded functions and concludes by examining circular and hyperbolic functions and their graphs.
April 9, 2015
The document discusses graphing quadratic functions. It begins with reviewing key concepts like the vertex and axis of symmetry and how the a, b, and c coefficients affect the graph. Examples are provided for determining the width, direction opened, and vertical shift based on these coefficients. The remainder of the document provides step-by-step examples of graphing quadratic functions by finding the axis of symmetry, vertex, y-intercept, and other points to plot the parabolic curve.
Quadratic Function.pptx
This document defines and provides examples of quadratic functions. A quadratic function is a polynomial function of degree two in the form f(x) = ax^2 + bx + c, where a ≠ 0. It must have the highest degree of 2, a non-zero coefficient for x^2, and no negative or rational exponents. Examples are provided to identify quadratic functions from sets of equations. The graph of a quadratic function is a parabola that can open upward or downward depending on the sign of a. Additional examples demonstrate how changing the coefficients affects the graph shape. The vertex form of a quadratic function is given as f(x) = a(x-h)^2 + k, where the vertex is (
02.21.2020 Algebra I Quadraic Functions.ppt
The document provides an agenda and lesson plan for an Algebra I class that includes the following:
1. The class will begin with a D.E.A.R activity called "Jaguar Ascensions" followed by taking Cornell notes on the lesson.
2. Students will then summarize their notes and have a teacher dialogue.
3. A number sense routine involving finding a missing number in an equation will be completed.
4. The remainder of the class will cover topics on quadratic functions including graphing quadratic functions in standard, vertex, and intercept forms as well as solving quadratic equations through factoring and using the quadratic formula.
Calc 7.1a
This document discusses calculating the area between two curves using integration. It explains that the area between curves f(x) and g(x) from x=a to x=b can be found by integrating f(x)-g(x) from a to b. It provides examples of finding the area between curves, including when the curves intersect multiple times, requiring splitting the region into separate intervals. The key steps are sketching the region, identifying intersection points, determining which curve is above the other in each interval, and setting up the correct integral expressions with the proper limits of integration. Representative rectangles are used to visualize the accumulation of area, whether vertical or horizontal depending on the problem.
Algebric Functions.pdf
This document discusses algebraic functions, including polynomial and rational functions. Polynomial functions are functions of the form y = p(x) = a0 + a1x + a2x2 + ... + anxn, where ai ∈ R and an ≠ 0. Rational functions are functions of the form y = R(x) = P(x)/Q(x), where P(x) and Q(x) are polynomial functions. The document outlines how to analyze the domain, intercepts, symmetries, asymptotes, and graph of algebraic functions. It provides examples of discussing these "aids to graphing" and sketching the graphs of specific rational functions.
6.6 analyzing graphs of quadratic functions
This document discusses analyzing and graphing quadratic functions. It defines key terms like vertex, axis of symmetry, and vertex form. It explains that the graph of y=ax^2 is a parabola, and how the value of a affects whether the parabola opens up or down. It also describes how to graph quadratic functions in vertex form by plotting the vertex and axis of symmetry, and using symmetry.
Calculus and Numerical Method =_=
This document outlines a course on Calculus and Numerical Methods over two parts. Part one covers calculus topics like functions, graphs, limits, differentiation, integration and differential equations over 7 weeks. Part two covers numerical methods topics like errors, root finding, interpolation, numerical differentiation and integration, and solving ordinary differential equations over 6 weeks. There are three learning outcomes focusing on applying calculus and numerical methods concepts, solving problems using programming, and solving real-life problems. Students will be assessed through tests, assignments, midterms and a final exam testing the different learning outcomes. The course then provides details on the topics and subtopics to be covered in the first part on functions and graphs.
Graphing rational functions
This document discusses graphing rational functions. It defines key concepts like domain, range, intercepts, zeros, and asymptotes. An example rational function f(x)=x-2/(x+2) is used to demonstrate how to find these values and graph the function. The domain is all real numbers except -2, the x-intercept is 2, and the y-intercept is -1. The vertical asymptote is at x=-2. Horizontal asymptotes occur when the degree of the numerator is less than, equal to, or greater than the degree of the denominator.
Função quadrática
The document is about quadratic polynomial functions and contains the following information:
1. It discusses investigating relationships between numbers expressed in tables to represent them in the Cartesian plane, identifying patterns and creating conjectures to generalize and algebraically express this generalization, recognizing when this representation is a quadratic polynomial function of the type y = ax^2.
2. It provides examples of converting algebraic representations of quadratic polynomial functions into geometric representations in the Cartesian plane, distinguishing cases in which one variable is directly proportional to the square of the other, using or not using software or dynamic algebra and geometry applications.
3. It discusses characterizing the coefficients of quadratic functions, constructing their graphs in the Cartesian plane, and determining their zeros (
Lecture 2 family of fcts
This document provides an overview of various mathematical models and functions, including:
1) Linear, polynomial, power, rational, algebraic, trigonometric, exponential, and logarithmic functions.
2) It describes the key properties of each type of function, such as their domains, ranges, and graph shapes.
3) It also discusses how functions can be transformed through stretching, shrinking, shifting, and reflection.
Module 4 exponential and logarithmic functions
This document provides an overview of a module on logarithmic functions. It discusses the definition of logarithmic functions as the inverse of exponential functions, how to graph logarithmic functions by reflecting the graph of the corresponding exponential function across the line y=x, and properties of logarithmic function graphs like their domains, ranges, asymptotes, and behavior. It also covers laws of logarithms and how to solve logarithmic equations. The document is designed to teach students to define logarithmic functions, graph them, use laws of logarithms, and solve simple logarithmic equations.
How to graph Functions
This lesson discusses graphing functions. It begins with examples of graphing functions given a limited domain by finding ordered pairs that satisfy the function and plotting the points. It then covers graphing functions with a domain of all real numbers by choosing values of x, finding corresponding y-values, plotting points to see a pattern, and drawing a line with arrowheads. The lesson shows how to use graphs to find function values and solve real-world problems by limiting domains to non-negative values.
4 4 graphingfx
This lesson discusses graphing functions. It begins with examples of graphing functions given a limited domain by finding the y-values that correspond to the given x-values. It then covers graphing functions with an unlimited domain by choosing sample x-values and connecting the points with a line or curve. The document provides examples of interpreting graphs to find function values and solving real-world word problems by graphing and interpreting functions.
Modeling with Quadratics
- The document discusses quadratic functions and their graphs. It explains that the graph of a quadratic function is a parabola, which is a U-shaped curve.
- It describes how to write quadratic functions in standard form and use that form to sketch the graph and find features like the vertex and axis of symmetry.
- Examples are provided to demonstrate how to graph quadratic functions in standard form and how to find the minimum or maximum value of a quadratic function by setting its derivative equal to zero.
1. Graph the exponential function by hand. Identify any asymptotes.docx
1. Graph the exponential function by hand. Identify any asymptotes and intercepts and determine whether the graph of the function is increasing or decreasing. (Enter NONE in any unused answer blanks.)
Equation of horizontal asymptote:
Equation of vertical asymptote:
Value of y-intercept
Value of x-intercept
The function is
2. Use the graph of y = 2x to match the function with its graph.
A
B
C
D
y = 2x – 4
y = 2x – 5
y = 2x + 4
y = 2–x
3. Use the graph of f to describe the transformation that yields the graph of g. Then sketch the graphs of f and g by hand.
f(x) = −2x, g(x) = 5 − 2x
The graph of g(x) = 5 − 2x is a vertical shift five units downward of f(x) = −2x.
The graph of g(x) = 5 − 2x is a horizontal shift five units to the left of f(x) = −2x.
The graph of g(x) = 5 − 2x is a vertical shift five units upward of f(x) = −2x.
The graph of g(x) = 5 − 2x is a horizontal shift five units to the right of f(x) = −2x.
Sketch the graphs of f and g.
4. Use a graphing utility to construct a table of values for the function. (Round your answers to three decimal places.)
x
f(x) = 5x − 3
-1
0
1
2
3
Sketch the graph of the function.
Identify any asymptotes of the graph. (Enter NONE in any unused answer blanks.)
vertical asymptote
x
=
horizontal asymptote
y
=
5. Use a graphing utility to construct a table of values for the function. (Round your answers to three decimal places.)
x
g(x) = 4 − e−3x
-4
-3
-2
-1
0
Sketch the graph of the function.
Identify any asymptotes of the graph. (Enter NONE in any unused answer blanks.)
vertical asymptote
x
=
horizontal asymptote
y
=
6. Fill in the blank.
If
x = ey,
then y = .
7. For what value of x is
ln x = ln 9?
x =
8. Write the logarithmic equation in exponential form. For example, the exponential form of
log5 25 = 2 is 52 = 25.
log2 512 = 9
=
9. Write the logarithmic equation in exponential form. For example, the exponential form of log5 25 = 2 is 52 = 25.
log
1
100,000,000
= -8
=
10. Write the exponential equation in logarithmic form. For example, the logarithmic form of
23 = 8 is log2(8) = 3.
43/2 = 8
log
=
11. Use a calculator to evaluate the function at the indicated value of x. Round your result to three decimal places.
f(x) = log10(x) x = 4/5
12. Solve the equation for x.
log10(102) = x
13. Write the logarithmic equation in exponential form. For example, the exponential form of ln(5) = 1.6094... is e1.6094... = 5. (Do not use ... in your answer.)
=
14. Write the exponential equation in logarithmic form. For example, the logarithmic form of
e2 = 7.3890 is ln 7.3890 = 2.
(Do not use ... in your answer.)
e2.2 = 9.0250
ln
=
15. Use the properties of natural logarithms to rewrite the expression.
5 ln(e5)
16. Use the properties of logarithms to rewrite and simplify the logarithmic expression.
ln
9
e9
17. Use the properties of logarithms to expand the expression as a ...
Function evaluation, termination, vertical line test etc
The document discusses functions and their inverses. It defines key terms like domain, range, and inverse functions. It provides examples of determining if a relationship is a function using the vertical line test or one-to-one mapping. The document also covers finding inverses of straight lines, parabolas, exponential graphs and logarithmic graphs. It shows how to sketch these graphs and determine their domains and ranges. Finally, it discusses solving cubic expressions through finding factors and remainders.
Polynomial functionsandgraphs
This document discusses polynomial functions and their graphs. It defines polynomial functions as functions of the form P(x) = anxn + an-1xn-1 + ... + a1x + a0, where an is the leading coefficient. The degree of the polynomial determines features of its graph like the maximum number of x-intercepts. The leading coefficient test determines the end behavior of the graph. Key features of polynomial graphs are intercepts, extrema, and end behavior.
Graph of functions
The document discusses different types of functions and their graphs. It provides examples of constant functions, linear functions, quadratic functions, and absolute value functions. It shows how to graph each type of function by plotting points and describes their domains and ranges. For linear functions, the domain is all real numbers and the range is also all real numbers. For quadratic functions, the graph is a parabola and the range only includes positive values. Absolute value functions have a domain of all real numbers and a range that is positive and excludes negative values below the constant.
Similar to Alg1 ch1101example123 (20)
1. Graph the exponential function by hand. Identify any asymptotes.docx
1. Graph the exponential function by hand. Identify any asymptotes.docx
Function evaluation, termination, vertical line test etc
Function evaluation, termination, vertical line test etc
More from amymallory
Alg1 ch0407example5
The document describes two functions that model the cost of cable service over time. Function f(x) = 60x + 40 models the original cost with a $40 installation fee and $60 monthly fee. Function g(x) = 60x + 5 models the reduced cost with a $5 installation fee. Both functions have a slope of 60, so their graphs are parallel lines. The y-intercept of g is 35 less than f, so g's graph is a vertical translation of f's graph. A third function h(x) = 70x + 40 with a $70 monthly fee is discussed. Its graph rises faster than f due to the greater slope, but they have the same y-intercept of 40.
Alg1 ch0407example4
The document compares the graphs of several functions to the graph of f(x)=x.
It states that the graphs of g(x)=x+3 and f(x)=x are parallel lines because they have the same slope of 1, but g(x) has a y-intercept 3 units higher than f(x).
It then explains that the graph of h(x)=2x rises faster than f(x)=x because h(x) has a greater positive slope, though they both pass through the origin since their y-intercept is 0.
Finally, it notes that the graph of h(x)=-3x falls from left to right compared to f(x)=
Alg1 ch0407example23
The document discusses modeling and graphing functions. It provides examples of writing a function to model a real-world situation, finding the value of x given a function f(x), and using a function to predict a value. Specifically, it shows a function f(x) = 37x + 7 that models the gray wolf population in Idaho over time, and asks to find the value of x when f(x) = 155 using that model.
Alg1 ch0407example1
The document provides an example of substituting a value into a function and simplifying. It gives the original function f(x) = 3x - 15 and substitutes -3 for x, simplifying to get the answer of -24. It then gives a guided practice problem of evaluating the function h(x) = -7x when x = 7, with the answer being -49.
Solving Applications Using Substitution
The document describes a multi-step problem to determine when the total cost of website hosting will be the same for a website hosting company and an internet service provider. It provides the monthly costs for each company in a table and shows setting up equations to model the total cost over time. The solution shows solving the system of equations to find that the total cost will be equal after 20 months.
Alg1 ch0702example12(1)
The document provides examples of using the substitution method to solve systems of linear equations. In Example 1, the system is solved to get the solution (1, 5). Example 2 is similarly worked through, yielding the solution (-2, 2). The guided practice exercises ask to use substitution to solve three additional systems of linear equations.
Parallel and perpendicular Lines
This document discusses parallel and perpendicular lines. Parallel lines have equal slopes and will never intersect. Perpendicular lines intersect at a right angle, and their slopes are negative reciprocals of each other. The document provides examples of determining if lines are parallel or perpendicular based on their slopes, graphing parallel and perpendicular lines, and finding equations of lines parallel or perpendicular to a given line through a specified point.
More from amymallory (7)
Alg1 ch1101example123
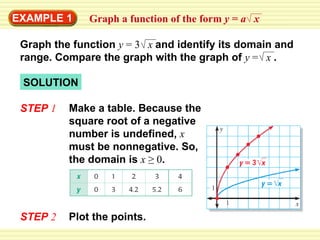
- 1. EXAMPLE 1 SOLUTION STEP 1 Graph the function y = 3 x and identify its domain and range. Compare the graph with the graph of y = x . Make a table. Because the square root of a negative number is undefined, x must be nonnegative. So, the domain is x ≥ 0 . STEP 2 Plot the points. Graph a function of the form y = a x
- 2. EXAMPLE 1 STEP 3 STEP 4 Draw a smooth curve through the points. From either the table or the graph, you can see the range of the function is y ≥ 0 . Graph a function of the form y = a x Compare the graph with the graph of y = x . The graph of y = 3 x is a vertical stretch (by a factor of 3 ) of the graph of y = x .
- 3. EXAMPLE 2 Graph a function of the form y = a x SOLUTION Graph the function y = –0.5 x and identify its domain and range. Compare the graph with the graph of y = x . To graph the function, make a table, plot the points, and draw a smooth curve through the points. The domain is x ≥ 0 . The range is y ≤ 0 .The graph of y = –0.5 x is a vertical shrink (by a factor of 0.5 ) with a reflection in the x- axis of the graph of y = x .
- 4. EXAMPLE 3 Graph a function of the form y = x + k SOLUTION Graph the function y = x + 2 and identify its domain and range. Compare the graph with the graph of y = x . To graph the function, make a table, then plot and connect the points. The domain is x ≥ 0 . The range is y ≥ 2 .The graph of y = x + 2 is a vertical translation (of 2 units up) of the graph of y = x .
- 5. GUIDED PRACTICE for Examples 1, 2 and 3 Graph the function and identify its domain and range. Compare the graph with the graph of y = x . 1. y = 2 x Domain: x ≥ 0 , Range: y ≥ 0 Vertical stretch by a factor of 2 ANSWER
- 6. GUIDED PRACTICE for Examples 1, 2 and 3 Graph the function and identify its domain and range. Compare the graph with the graph of y = x . 2. y = –2 x Domain: x ≥ 0 , Range: y ≤ 0 Vertical stretch by a factor of 2 and a reflection in the x -axis ANSWER
- 7. GUIDED PRACTICE for Examples 1, 2 and 3 Graph the function and identify its domain and range. Compare the graph with the graph of y = x . 3. y = x – 1 Domain: x ≥ 0 , Range: y ≥ 0 – 1 Vertical translation of 1 unit down ANSWER
- 8. GUIDED PRACTICE for Examples 1, 2 and 3 Graph the function and identify its domain and range. Compare the graph with the graph of y = x . 4. y = x + 3 Domain: x ≥ 0 , Range: y ≤ 0 Vertical translation of 3 units up ANSWER