This document presents a new natural gas compressibility factor correlation developed specifically for Niger Delta gas fields in Nigeria. Laboratory PVT reports from 22 gas reservoirs in the Niger Delta were compiled into a database and used to evaluate existing compressibility factor correlations. A new correlation was then developed using the database. The performance of the new correlation was found to have the lowest standard error and absolute error compared to other evaluated correlations when calculating z-factors for different Niger Delta reservoir systems. Statistical analysis also showed the new correlation had the highest correlation coefficients and best matched experimental and other estimated z-factor values. It was concluded that the new developed correlation and that of Papay correlation are the most appropriate for calculating natural gas compressibility factors in Niger Delta gas fields
The document discusses different types of flowmeters used to measure volumetric and mass flow rates of fluids, including orifice meters, rotameters, magnetic flowmeters, and Coriolis mass flowmeters. It explains the basic operating principles of rotameters, which measure flow using a float inside a tapered tube, and magnetic flowmeters, which induce a voltage in conductive fluids using the Faraday's law of induction. It also describes how Coriolis mass flowmeters measure the mass flow rate of a fluid using sensors to detect distortions in the vibration of oscillating measuring tubes caused by the Coriolis force.
This document outlines topics covered in a reservoir engineering course, including reservoir fluid behaviors, properties of petroleum reservoirs, gas behavior, and properties of crude oil systems. It specifically discusses properties of interest like density, solution gas, bubble point pressure, formation volume factor, viscosity and more. It provides empirical correlations to estimate properties like gas solubility, bubble point pressure, and formation volume factor as a function of parameters like solubility, gas gravity, oil gravity and temperature. The document is focused on understanding physical properties of crude oil and gas reservoirs which is important for reservoir engineering applications and problem solving.
This document discusses hydrocarbon phase behavior and provides several key points:
1. Hydrocarbons can exist in liquid, gas, and solid phases depending on pressure and temperature conditions. Phase changes occur as these conditions vary.
2. Understanding phase behavior is important for predicting subsurface fluid conditions and planning surface facilities as pressure and temperature change during production.
3. During production, liquid may condense from gas or gas may evolve from liquid as pressure and temperature decrease at the surface and within reservoirs.
4. Phase diagrams are used to represent phase relationships under various pressure and temperature conditions for pure components and mixtures.
Este documento describe los diferentes tipos de perfiles de pozos, incluyendo registros de diámetros, registros eléctricos, registros radioactivos y registros de porosidad. Los perfiles de pozos proporcionan información sobre las características petrofísicas y fluidos contenidos en las formaciones geológicas a lo largo del pozo, lo que ayuda a predecir el potencial hidrocarburífero y tomar decisiones sobre operaciones de completación.
This document discusses wellbore performance and flow modeling. It covers:
1) Single phase liquid, gas, and two phase flow models based on mechanical energy balance equations. Pressure drops are calculated considering elevation change, kinetic energy, and friction.
2) Methods for calculating friction factors including Fanning, Darcy, and Moody charts. Correlations for gas properties like viscosity and deviation factor are also presented.
3) Examples of calculating pressure drops in single phase liquid and gas flows. Numerical methods for solving gas flow equations are described.
4) Multiphase flow is more complex due to different flow regimes affecting pressure gradients. Models include homogeneous and separated flow approaches.
Production Optimization using nodal analysis. The nodal systems analysis approach is a very flexible method
that can be used to improve the performance of many well
systems. The nodal systems analysis approach may be used to analyze
many producing oil and gas well problems. The procedure can
be applied to both flowing and artificial
Nodal Analysis introduction to inflow and outflow performance - nextgusgon
This document discusses nodal analysis concepts for analyzing inflow and outflow performance in fluid systems. It introduces key terms like nodal analysis, inflow, outflow, upstream and downstream components, and graphical solutions. It provides an example problem calculating system capacity and the impact of changing pipe diameters. It also covers topics like single-phase and multiphase fluid flow, flow regimes, flow patterns, and calculating pressure drops and flow performance in pipes.
The document provides information on production optimization through system analysis using nodal analysis. It discusses key components of the production system including reservoir fluid properties, inflow performance, tubing performance, and how to analyze the combined system. The objectives are to understand inflow, vertical lift, and combined performance. Nodal analysis is introduced as a technique to simulate fluid flow by breaking the system into nodes and ensuring pressure continuity. An example application optimizes a well's production rate by analyzing effects of tubing size, wellhead pressure, water cut, and skin on the combined inflow and outflow curves. The optimized design achieves a production rate of 114 MMscf/d with a 6.18" tubing and 2,000 psi
Porosity is a key property of reservoir rocks that represents the pore volume as a fraction of bulk volume. It can be measured through laboratory analysis of rock samples or estimated from well logs. Several factors influence porosity, including grain size, sorting, cementation, and compaction. Common techniques to determine porosity include measuring pore volume directly through fluid extraction or injection methods, or calculating it by finding the grain volume and subtracting it from bulk volume. Understanding porosity distribution is important for reservoir characterization and fluid flow modeling.
This document discusses key properties of crude oil, including:
1) Oil is classified based on properties like specific gravity, viscosity, density, etc. with specific gravity and viscosity most commonly used. Specific gravity is represented by API gravity which ranges from 8 to 58 degrees.
2) Bubble point pressure is the pressure at which a small amount of gas is in equilibrium with oil. When pressure drops below this point, gas is liberated from the oil.
3) Other properties discussed include formation volume factor (ratio of reservoir to surface volumes), solution gas-oil ratio (amount of gas dissolved in oil), and compressibility (change in volume with pressure change).
production optimization nowadays is a vital thing to capture for every gas field to get proper production rate. That's they need proper way to optimize there production. Here I have discussed about the process of production optimization using prosper softer from petroleum expert.
Design Considerations for Antisurge Valve SizingVijay Sarathy
This document provides guidelines for sizing an anti-surge valve for a centrifugal compressor. It begins with definitions of surge and how it can damage compressors. It then outlines the methodology for sizing an anti-surge valve, which involves calculating the valve coefficient based on parameters like mass flow rate, pressure ratio, piping geometry, and gas properties. The document provides a case study applying this methodology to size a 4" anti-surge valve for a gas compressor system operating between 11.61 and 30.13 bara.
This document provides an overview of reservoir engineering 1 course material covering reservoir fluids and gas properties. It discusses:
1. Classification of oil and gas reservoirs based on pressure-temperature diagrams and fluid compositions. Reservoir fluids can exist as gas, liquid, solid, or combinations and behave differently based on reservoir conditions.
2. Key gas properties like compressibility factor, density, viscosity that are important for reservoir calculations. Real gases deviate from ideal gas behavior more at high pressures.
3. Methods for determining gas properties including compressibility factor charts and equations of state that account for non-ideal behaviors and non-hydrocarbon gas components.
This document provides an overview of key reservoir fluid properties including methods for calculating z-factors, gas properties such as compressibility and viscosity, crude oil properties like density and solution gas, and empirical correlations for determining properties like gas solubility, bubble point pressure, and formation volume factors. The document discusses various correlations for estimating properties in the absence of laboratory measurements and defines important concepts such as gas solubility, solution gas, and bubble point pressure.
This document provides an overview of petroleum engineering and related topics. It discusses:
- The definition and chemistry of hydrocarbons and how petroleum is formed from the remains of ancient organisms.
- How petroleum migrates and can accumulate in reservoirs trapped by impermeable rock layers.
- The different types of hydrocarbon molecules and traps that can form reservoirs.
- The roles of reservoir engineers in evaluating fields, modeling reservoirs, and planning development to maximize oil and gas recovery.
This document provides an overview of reservoir engineering fundamentals including:
- Three types of reservoir fluids based on compressibility: incompressible, slightly compressible, and compressible.
- Three flow regimes in reservoirs: steady-state, unsteady-state, and pseudosteady-state.
- Common reservoir geometries that influence fluid flow including radial, linear, spherical, and hemispherical.
- Darcy's law and its applications to steady-state fluid flow in reservoirs, including for different fluid types and geometries.
This document provides an introduction and overview of pressure transient testing and analysis. It discusses:
I. The importance of production data analysis for reservoir evaluation, management, and description.
II. Basic definitions like drawdown tests, buildup tests, and flow regimes. The objectives of well testing like determining permeability, skin, pore volume, and detecting heterogeneity.
III. The ideal reservoir model and assumptions made in pressure transient analysis, like radial flow, homogenous properties, and infinite-acting reservoirs. Equations used like the diffusivity equation.
This document is a book summarizing the state of the art in well test interpretation. It discusses the fundamentals of well testing including the diffusivity equation, wellbore storage effects, type curves, and controlling the downhole environment. It also reviews interpretation methodology, specialized test types like layered reservoirs and horizontal wells, and using downhole flow rate measurements to improve interpretations. The goal is to provide operators with the knowledge to design effective well testing programs to characterize reservoirs.
This 5 day training course is designed to give you a comprehensive account of methods and techniques used in modern well testing and analysis. Subsequently to outlining well test objectives and general methodologies applied, the course will provide real case studies and practice using modern software for Pressure Transient Analysis. These exercises will demonstrate clearly the limitations, assumptions and applicability of various techniques applied in the field.
This document provides an overview of reservoir engineering concepts for predicting vertical oil well performance, including productivity index, inflow performance relationship, and methods for modeling these relationships. It discusses key topics like:
- Defining and measuring productivity index using stabilized well test data
- How productivity index, inflow performance relationship, and well flow rates relate under pseudosteady state conditions
- Factors influencing productivity index like fluid properties and relative permeability
- Empirical methods like Vogel's method for generating inflow performance curves over the life of depleting reservoirs
The document is from a course on reservoir engineering concepts for vertical wells, with the goal of teaching practical equations to model well performance and factors governing fluid flow.
The document discusses well deliverability and pressure drop in oil and gas wells. It explains that pressure drop is affected by properties of the reservoir fluids, production rates, and the mechanical configuration of the wellbore. Pressure loss is highest in the tubing and can be estimated using charts, correlations, or equations that consider fluid properties, flow rates, and well geometry. Matching inflow and outflow pressures gives the stabilized flow rate. The document compares methods for estimating pressure drop in single-phase and multiphase flow.
The document discusses variable density logs (VDL), which provide a color or grayscale representation of acoustic wave amplitude received during sonic or ultrasonic measurements. VDLs are commonly used alongside cement bond logs to provide better interpretation. It also discusses density logs, which measure formation density using gamma rays emitted from a borehole tool. Density is plotted on a bulk density scale and used to indicate porosity, derive total porosity, and identify lithology when used with neutron logs. Limitations include needing uniform mudcake/washouts less than 0.75 inches.
This document provides an overview of methods for calculating key gas properties including:
1. The z-factor, which can be calculated using correlations like Hall-Yarborough or Dranchuk-Abu-Kassem that were developed based on the Standing-Katz chart.
2. Isothermal gas compressibility (Cg), which can be determined from the z-factor or using models that relate it to reduced gas density.
3. Gas formation volume factor (Bg) and gas expansion factor (Eg), which relate the volume of gas at reservoir conditions to standard conditions.
4. Gas viscosity, which can be estimated using correlations like Carr-Kobayashi-Burrows that are functions of
A drill stem test (DST) is used to test characteristics of a newly drilled well while the drilling rig is still on site. It can provide estimates of permeability, reservoir pressure, fluid types, wellbore damage, barriers and fluid contacts. There are three main methods to analyze DST data: Horner's plot method, type curve matching method, and computer matching. Type curve matching involves matching pressure change over time data from the DST to standard type curves to determine properties like permeability and skin factor. Gringarten type curves are commonly used and account for variations in pressure over time based on reservoir-well configurations.
There are several types of pressure transducers commonly used to measure pressure, including mechanical devices like the manometer and dead-weight tester, as well as the bourdon tube, diaphragm, and bellows gauges. The manometer uses fluid columns to measure pressure differences simply and is well-suited for steady laboratory measurements. Dead-weight testers are used to calibrate other pressure gauges by applying precisely known pressures. Bourdon tube, diaphragm, and bellows gauges all function by elastically deforming in response to pressure differences, which can then be converted to an electrical signal or mechanical readout.
Este documento describe una herramienta para medir presiones y tomar muestras de fluidos de formación a diferentes profundidades en un pozo de petróleo. Explica que esta prueba permite determinar la presión de formación, posible comunicación entre zonas, gradientes de presión y contactos de fluidos para comprender mejor las características del yacimiento.
Este documento describe técnicas para tomar muestras de crudos y gases en tanques y tuberías de manera representativa. Explica que es importante tomar muestras a diferentes profundidades en tanques para promediar resultados y obtener valores precisos. Describe equipos como extractores y botellas para tomar muestras, así como métodos como muestras compuestas, continuas y corridas. También cubre técnicas para muestrear crudos y gases naturales que fluyen en tuberías, incluyendo el uso de válvulas muestreador
Faidhi Fahmi discussed his experience as a petroleum engineering student who interned with MISC, describing his work analyzing offshore business unit projects as an economic evaluator; he outlined his career goals of working as a production technologist for Shell after graduation and eventually becoming a manager and later a university lecturer before opening his own business.
This document provides procedures for determining the density of soil cement base courses in place using a sand cone test. Key steps include: 1) calibrating the sand cone apparatus to determine the unit weight of sand; 2) excavating a hole and collecting soil samples on site; 3) filling the hole with pre-weighed sand to determine the volume; and 4) calculating dry density from the measured weight and volume. The dry density and moisture content are reported as test results. Care must be taken when excavating and measuring to obtain accurate volume and avoid disturbing surrounding material.
This document discusses hypothesis testing using z- and t-tests. It explains key concepts like sampling distributions, the central limit theorem, and how these concepts allow us to compute z-scores and conduct hypothesis tests on sample means. An example is provided testing the hypothesis that a sample of children has a mean IQ greater than the population mean of 100. The document shows how to calculate a z-score for the sample mean, compare it to critical values, and use this to determine the probability of obtaining the sample mean or an even higher one assuming the null hypothesis is true.
The document discusses Z tests and the limitations of tests of significance. It describes how to perform a Z test to test the significance of a correlation coefficient in a small sample by transforming the coefficient into a Z value. It also explains how to use a Z test to test the significance of the difference between two sample correlation coefficients. Finally, it outlines some limitations of relying solely on significance testing, including that tests with small samples can lack power and tests with large samples can find even small effects to be significant.
The objective of this lab is to measure and study density and specific gravity of different liquids by using hydrometer. This gives information how light or heavy a crude oil is.
The properties of a gas mixture depend on the properties of its individual components and their relative amounts. There are two ways to describe the composition of a mixture: molar analysis specifies the moles of each component, and gravimetric analysis specifies the mass of each component. For ideal gas mixtures, Dalton's law and Amagat's law can be used to determine pressure and volume behavior. For real gas mixtures, these laws are approximate and equations of state must be used. The properties of gas mixtures can be determined by weighted averages of the component properties.
Soil mechanics is the application of principles of mechanics and hydraulics to engineering problems dealing with settlement of foundations, slope stability of earth fills, and design of retaining structures, braced excavations, anchored bulkheads, cofferdams, etc. It involves identification and characterization of soils, laboratory and field testing of soils, evaluation of soil properties such as compressibility, shear strength, permeability, consolidation, etc. and design of foundations, retaining structures, earth structures, and other soil-structure interactions.
SAMPLE DATA TO SHOW THE SIZE OF COARSE AND FINE AGGREGATES. THIS REPORT IS FROM CONCRETE LAB OF UCE&T BZU MULTAN PAKISTAN. THE SAND USED HAS A FINENESS MODULUS OF .95.
The document discusses the benefits of exercise for mental health. Regular physical activity can help reduce anxiety and depression and improve mood and cognitive functioning. Exercise boosts blood flow, releases endorphins, and promotes changes in the brain which help regulate emotions and stress levels.
Specific Gravity, and API Gravity for petroleum productsMuhammad Akram
1) The document describes an experiment to determine the specific gravity and API gravity of kerosene and gasoline using two methods: the hydrometer method and pycnometer method.
2) The pycnometer method was found to be more accurate than the hydrometer method for measuring API and specific gravity, as the hydrometer can be affected by temperature, carbon dioxide, and alcohol content.
3) The API gravity value provides information about the quality and composition of petroleum products, with higher API gravity indicating a product contains more desirable and valuable components like gasoline.
Gases have no definite volume and assume the volume of any vessel. The behavior of gases is described by gas laws including Boyle's law, Charles' law, Avogadro's law, and the ideal gas law. Real gases deviate from ideal behavior at high pressures and low temperatures and are better described by equations like van der Waals. Key gas properties include gas formation volume factor, gas compressibility factor, gas viscosity, and gas solubility in oil. Gas formation volume factor relates the volume of gas at reservoir conditions to standard surface conditions.
Chem II - Real Gases: Van der Waals (Liquids and Solids)Lumen Learning
This document discusses real gases and the van der Waals equation. It explains that real gases interact with each other at low temperatures and high pressures, deviating from ideal gas behavior. The van der Waals equation corrects the ideal gas law for these interactions using constants a and b which account for molecular attractions and size. The document provides examples comparing ideal and real gas behavior and predicting which of two gases would produce a lower pressure based on their van der Waals constants.
The sand replacement test determines the in situ density of natural or compacted soils using sand pouring cylinders. The test involves excavating a soil sample, measuring its mass, and replacing the excavated volume with sand of a known density to find the sample volume. This allows calculating the dry density based on the sample mass and volume. The test establishes a relationship between dry density and moisture content. It is used to evaluate compaction levels in the field according to acceptance criteria for different depths.
Petroleum Properties - Density and relative densityStudent
1. The document describes an experiment to determine the density and API gravity of kerosin and gas oil samples using two methods: a hydrometer and a pycnometer.
2. The results found the API gravity of kerosin to be 48.53 using the hydrometer method but 35.56 using the pycnometer method, showing a difference between the methods.
3. The pycnometer method is considered more accurate as it is less affected by factors like temperature, bubbles, and alcohol content that influence the hydrometer readings.
This document describes the sieve analysis test of sand. The test involves sieving various sizes of sand particles through a series of sieves and calculating the percentage of sand retained on each sieve. This determines the particle size distribution. Well graded sand has a wide range of particle sizes, uniformly graded sand has similar sized particles, and gap graded sand is missing some sizes. The test procedure, equipment used, and results/conclusions are explained.
This document provides information on sieve analysis testing of soils based on IS 2720 Part 4. It discusses the objectives of classification of soils, coefficient of curvature, uniformity coefficient, and fineness modulus. Sieve analysis is used to determine gradation of soils, mix design proportions, and filter design. The test involves sieving soil samples through a series of sieves and weighing the material retained on each sieve. Calculations are made to determine coefficients and fineness modulus.
This document provides instructions for performing a sieve analysis test to determine the particle size distribution of fine aggregates or sand. The key steps include: 1) preparing a representative sample, 2) arranging sieves in order of decreasing size, 3) sieving the sample and weighing the material retained on each sieve, 4) calculating the percentage retained, cumulative percentage retained, and cumulative percentage passing through each sieve. The results are used to evaluate whether the sand is well graded or poorly graded and to calculate metrics like the uniformity coefficient.
This document discusses soil classification methods including sieve analysis and hydrometer analysis. Sieve analysis is used to determine the distribution of coarser soil particles by size, while hydrometer analysis determines the distribution of finer particles. The tests are used to classify soil type and evaluate properties like permeability, density and shear strength. Procedures are described for conducting the analyses, calculating relevant particle sizes and distribution, and classifying soils based on the unified soil classification system.
Efficient estimation of natural gas compressibility factor usingAbelardo Contreras
This document presents a new method for estimating natural gas compressibility factor (Z-factor) using least square support vector machine (LSSVM) modeling. The LSSVM model is developed and tested using a database of over 2,200 samples of sour and sweet gas compositions. The model predicts Z-factor as a function of gas composition, molecular weight, pressure, and temperature. Statistical analysis shows the LSSVM model outperforms existing empirical correlations with an average absolute relative error of 0.19% and correlation coefficient of 0.999. The accurate prediction of Z-factor is important for natural gas engineering calculations.
This document summarizes a study evaluating correlations for calculating the compressibility factor of natural gases containing non-hydrocarbon components. It discusses how the compressibility factor is used to calculate important gas properties and outlines standard methods like correlations, equations of state, and laboratory measurements. The document focuses on evaluating correlations that account for components like nitrogen, carbon dioxide, and hydrogen sulfide which make predicting the compressibility factor more difficult compared to sweet gases containing only hydrocarbons. It also discusses how these non-hydrocarbon components can affect pseudo-critical temperature and pressure values used in correlations.
The document discusses advances in gas data acquisition systems and gas ratio analysis that enable more accurate interpretation of hydrocarbon zones from drilling mud gas returns. Key points:
- New constant volume degassers extract gas samples more representative of formation fluids, improving consistency. Improved detection also provides high-resolution analysis.
- Gas ratio analysis, comparing quantities of heavier and lighter hydrocarbon fractions, effectively identifies fluid types when validated data is carefully applied. Ratios like LH, LM, and HM have exceptional results determining reservoirs in Southeast Asia.
- Presenting basic gas data alongside ratios and variables affecting the data brings out features to characterize fluids and reach final judgments through cut-offs and comparisons. These advances enable more reliable real-
IJCER (www.ijceronline.com) International Journal of computational Engineerin...ijceronline
The document presents a numerical investigation of exhaust gas emissions from a dual fuel engine configuration using hydrogen and compressed natural gas (CNG). A simulation program was developed using MATLAB to calculate mole fractions of various exhaust species like NOx, CO, and CO2 based on input parameters like hydrogen fraction, equivalence ratio, combustion temperature and pressure. Simulations were conducted to analyze the effects of these parameters on emissions. Results showed that CO emissions increased with equivalence ratio and temperature due to incomplete combustion. CO2 emissions decreased with increasing hydrogen fraction and temperature due to dissociation.
An Offshore Natural Gas Transmission Pipeline Model and Analysis for the Pred...IOSRJAC
The purpose of this paper is to model and analyze an existing natural gas transmission pipeline – the 24-inch, 5km gas export pipeline of the Amenam-Kpono field, Niger Delta, Nigeria – to determine properties such as pressure, temperature, density, flow velocity and, in particular, dew point, occurring at different segments of the pipeline, and to compare these with normal pipeline conditions in order to identify the segments most susceptible to condensation/hydrate formation so that cost-effective and efficient preventive/remedial actions can be taken. The analysis shows that high pressure and low temperature favor condensation/hydrate formation, and that because these conditions are more likely in the lower half of the pipeline system, remedial/preventive measures such as heating/insulation and inhibition injection should be channeled into that segment for cost optimization..
International Journal of Engineering Research and Development (IJERD)IJERD Editor
International Journal of Engineering Research and Development is an international premier peer reviewed open access engineering and technology journal promoting the discovery, innovation, advancement and dissemination of basic and transitional knowledge in engineering, technology and related disciplines.
This document discusses a study conducted to calibrate and validate air quality models used in environmental impact assessments in India. The study involved collecting emissions data from point, area, and line sources as well as meteorological data. Air quality was then monitored and models were used to predict pollutant concentrations, which were compared to observed values. The model that took into account emissions from all source types (point, area, and line) produced predictions closest to observed concentrations. Additional scenarios were run varying the stability class input to the model.
This document summarizes a study that performed a life assessment of a fighter jet engine annular combustor liner using a combined fluid/structural approach. Computational fluid dynamics analyses were conducted to obtain the thermal loading on the combustor liner from the combustion process. Finite element analyses were then performed to calculate the resulting temperature and stress/strain distributions in the liner. A method was developed to analyze a complete measured flight profile with limited computational effort. The creep and fatigue life for a measured flight were calculated and compared to field experience data. While the exact number of cycles to crack initiation was difficult to predict, the locations and directions of cracking correlated well with field data.
Dr Dev Kambhampati | DOE NETL Report- Cost & Performance Baseline for Fossil ...Dr Dev Kambhampati
This document provides a summary of cost and performance baselines for fossil energy power plants, including integrated gasification combined cycle (IGCC), pulverized coal (PC), and natural gas combined cycle (NGCC) configurations. Key findings include:
- IGCC, PC, and NGCC plants without carbon capture can achieve efficiencies of 39%, 39%, and 58% respectively. With capture, efficiencies drop to 32-35%, 30-33%, and 45-48%.
- Total overnight capital costs for non-capture plants are $718/kW for NGCC, $2,010/kW for PC, and $2,505/kW for IGCC on average. Capture increases
The use of Cooking Gas as Refrigerant in a Domestic RefrigeratorIJERA Editor
The application of cooking gas refrigerants in refrigeration system is considered to be a potential way to improve
energy efficiency and to encourage the use of environment-friendly refrigerants. Refrigeration operation has
been met with many challenges as it deals with environmental impact, how it affects humans and how it
contributes to the society in general. Domestic refrigerators annually consume several metric tons of traditional
refrigerants, which contribute to very high Ozone Depletion Potential (ODP) and Global Warming Potential
(GWP). The experiment conducted employs the use of two closely linked refrigerants, R600a (Isobutene) and
cooking gas which is varied in an ideal refrigerant mixture of 150 g of refrigerant and 15 ml of lubricating oil (to
a rating of 40 wt % expected in the compressor). The Laboratory process involved the use of Gas
Chromatography machine to ascertain the values of the mole ratio, molecular weight and critical temperatures.
Prode properties and Refprop softwares were used to ascertain other refrigerant properties of the mixture. The
results indicated that the mixture of R600a with lubricant confirm mineral oil as being the most appropriate for
the operation. The experimental results indicated that the refrigeration system with cooking gas refrigerant
worked normally and was found to attain high freezing capacity and a COP value of 2.159. It is established that
cooking gas is a viable alternative refrigerant to replace R600a in domestic refrigerators. Hence, its application
in refrigerating systems measures up to the current trend on environmental regulations with hydrocarbon
refrigerants
International Journal of Engineering Research and Applications (IJERA) is an open access online peer reviewed international journal that publishes research and review articles in the fields of Computer Science, Neural Networks, Electrical Engineering, Software Engineering, Information Technology, Mechanical Engineering, Chemical Engineering, Plastic Engineering, Food Technology, Textile Engineering, Nano Technology & science, Power Electronics, Electronics & Communication Engineering, Computational mathematics, Image processing, Civil Engineering, Structural Engineering, Environmental Engineering, VLSI Testing & Low Power VLSI Design etc.
This document discusses the behavior of real gases and how they differ from ideal gases. Real gases deviate more from ideal gas behavior at higher pressures and temperatures due to molecular interactions. Equations of state have been developed to better model real gas behavior using factors like compressibility and deviation from ideality. The z-factor relates the actual volume of real gases to the ideal gas volume at the same conditions. Charts have been created to estimate z-factors based on reduced properties and gas composition. Examples are provided to calculate z-factors for initial reservoir conditions using these charts and correlations.
Use of Wind Tunnel Refinements in the Dispersion Modeling Analysis of the Ala...Sergio A. Guerra
The proposed Alaska LNG Gas Treatment Plant project required dispersion modeling to evaluate impacts on ambient air quality standards. Initial modeling found inconsistent results due to complex building arrangements of two nearby facilities. Wind tunnel testing was used to determine equivalent building dimensions to refine building inputs, which significantly reduced predicted concentrations. The environmental regulator approved the wind tunnel analysis approach. The modeling now demonstrates operations will not cause exceedances of air quality standards.
This document presents a comparative study of the thermodynamic and economic performance of three organic Rankine cycle (ORC) configurations - a basic ORC, a regenerative ORC (RORC), and a two-stage evaporation ORC (TSEORC) - for geothermal electricity production in developed and developing countries. The study optimizes operating parameters of the cycles using different methods and evaluates economic performance based on levelized cost of electricity, return on investment, and payback period for 20 countries with geothermal resources. The results show that a TSEORC with working fluid R123 has the highest return on investment and shortest payback period for Australia, while basic ORC with R134a and R
This document describes a study evaluating different steam cycle designs to provide heat and power for a CO2 capture system on an offshore oil and gas installation. Three steam cycle configurations were modeled - an extraction condensing turbine, backpressure turbine, and combination cycle. The backpressure cycle was found to provide all necessary steam and power for CO2 capture and compression with some excess capacity. Weight relationships for major equipment were developed to estimate how cycle components would scale with changes in gas turbine exhaust flow. The study aims to identify the best steam cycle design for offshore CO2 capture applications.
1) The document discusses methods for calculating the geological reserves of natural gas, focusing on using the volumetric method.
2) It takes the S0 group in the Lamadian oilfield as an example to demonstrate how to determine parameters for the volumetric method formula, including the original gas-bearing area, effective thickness, average effective porosity, initial gas saturation, and gas volume factor.
3) By applying the volumetric method formula and using the determined parameters, the geological reserves of natural gas were calculated for different sand bodies in the S0 group, with a total reserve of 12.93×10⁸ m3.
This document summarizes research conducted at Texas A&M University at Qatar on developing correlations between synthetic jet fuel compositions and their properties. The researchers conducted blending studies of gas-to-liquid kerosene with other hydrocarbons and solvents. They analyzed the results statistically and developed visualization models using artificial neural networks to predict properties from compositions. Their goals were to optimize properties like density, freezing point, and heat content to meet standards for jet fuels while minimizing aromatic content.
IRJET- Guidelines to Improve Fiscal Natural Gas Metering Accuracy and Consist...IRJET Journal
This document discusses guidelines for improving the accuracy and consistency of natural gas metering for custody transfers in Nigeria. It identifies key issues affecting measurement accuracy, such as piping configuration, fluid properties, reference conditions, uncertainties, and validation. Addressing these issues can reduce total measurement error to 0.05% or less. Accurate metering is important for profitability and building investor confidence in Nigeria's natural gas industry. Implementing best practices for fiscal gas measurement in production designs will help increase accountability.
In this project we basically studied scope of this project, its feasibility and market assessment, raw material availability, different routes to produce Syngas and their comparison, process selection and its complete description, its P&ID, and environmental consideration.
This document provides technical data and material specifications for the 37 km pipeline system of the Ogabiri Gas Gathering Project in Nigeria. It includes dimensions, quantities, anti-corrosion coatings, and results from pipeline simulations. The pipeline will connect five flow stations and facilities to transport gas to the Nigerian Gas Company's pipeline network. It discusses the project background, scope of work, and acknowledgements. It also provides illustrations of the pipeline routing and network simulations.
Similar to Natural Gas Compressibility Factor Correlation Evaluation for Niger Delta Gas Fields (20)
This document provides a technical review of secure banking using RSA and AES encryption methodologies. It discusses how RSA and AES are commonly used encryption standards for secure data transmission between ATMs and bank servers. The document first provides background on ATM security measures and risks of attacks. It then reviews related work analyzing encryption techniques. The document proposes using a one-time password in addition to a PIN for ATM authentication. It concludes that implementing encryption standards like RSA and AES can make transactions more secure and build trust in online banking.
This document analyzes the performance of various modulation schemes for achieving energy efficient communication over fading channels in wireless sensor networks. It finds that for long transmission distances, low-order modulations like BPSK are optimal due to their lower SNR requirements. However, as transmission distance decreases, higher-order modulations like 16-QAM and 64-QAM become more optimal since they can transmit more bits per symbol, outweighing their higher SNR needs. Simulations show lifetime extensions up to 550% are possible in short-range networks by using higher-order modulations instead of just BPSK. The optimal modulation depends on transmission distance and balancing the energy used by electronic components versus power amplifiers.
This document provides a review of mobility management techniques in vehicular ad hoc networks (VANETs). It discusses three modes of communication in VANETs: vehicle-to-infrastructure (V2I), vehicle-to-vehicle (V2V), and hybrid vehicle (HV) communication. For each communication mode, different mobility management schemes are required due to their unique characteristics. The document also discusses mobility management challenges in VANETs and outlines some open research issues in improving mobility management for seamless communication in these dynamic networks.
This document provides a review of different techniques for segmenting brain MRI images to detect tumors. It compares the K-means and Fuzzy C-means clustering algorithms. K-means is an exclusive clustering algorithm that groups data points into distinct clusters, while Fuzzy C-means is an overlapping clustering algorithm that allows data points to belong to multiple clusters. The document finds that Fuzzy C-means requires more time for brain tumor detection compared to other methods like hierarchical clustering or K-means. It also reviews related work applying these clustering algorithms to segment brain MRI images.
1) The document simulates and compares the performance of AODV and DSDV routing protocols in a mobile ad hoc network under three conditions: when users are fixed, when users move towards the base station, and when users move away from the base station.
2) The results show that both protocols have higher packet delivery and lower packet loss when users are either fixed or moving towards the base station, since signal strength is better in those scenarios. Performance degrades when users move away from the base station due to weaker signals.
3) AODV generally has better performance than DSDV, with higher throughput and packet delivery rates observed across the different user mobility conditions.
This document describes the design and implementation of 4-bit QPSK and 256-bit QAM modulation techniques using MATLAB. It compares the two techniques based on SNR, BER, and efficiency. The key steps of implementing each technique in MATLAB are outlined, including generating random bits, modulation, adding noise, and measuring BER. Simulation results show scatter plots and eye diagrams of the modulated signals. A table compares the results, showing that 256-bit QAM provides better performance than 4-bit QPSK. The document concludes that QAM modulation is more effective for digital transmission systems.
The document proposes a hybrid technique using Anisotropic Scale Invariant Feature Transform (A-SIFT) and Robust Ensemble Support Vector Machine (RESVM) to accurately identify faces in images. A-SIFT improves upon traditional SIFT by applying anisotropic scaling to extract richer directional keypoints. Keypoints are processed with RESVM and hypothesis testing to increase accuracy above 95% by repeatedly reprocessing images until the threshold is met. The technique was tested on similar and different facial images and achieved better results than SIFT in retrieval time and reduced keypoints.
This document studies the effects of dielectric superstrate thickness on microstrip patch antenna parameters. Three types of probes-fed patch antennas (rectangular, circular, and square) were designed to operate at 2.4 GHz using Arlondiclad 880 substrate. The antennas were tested with and without an Arlondiclad 880 superstrate of varying thicknesses. It was found that adding a superstrate slightly degraded performance by lowering the resonant frequency and increasing return loss and VSWR, while decreasing bandwidth and gain. Specifically, increasing the superstrate thickness or dielectric constant resulted in greater changes to the antenna parameters.
This document describes a wireless environment monitoring system that utilizes soil energy as a sustainable power source for wireless sensors. The system uses a microbial fuel cell to generate electricity from the microbial activity in soil. Two microbial fuel cells were created using different soil types and various additives to produce different current and voltage outputs. An electronic circuit was designed on a printed circuit board with components like a microcontroller and ZigBee transceiver. Sensors for temperature and humidity were connected to the circuit to monitor the environment wirelessly. The system provides a low-cost way to power remote sensors without needing battery replacement and avoids the high costs of wiring a power source.
1) The document proposes a model for a frequency tunable inverted-F antenna that uses ferrite material.
2) The resonant frequency of the antenna can be significantly shifted from 2.41GHz to 3.15GHz, a 31% shift, by increasing the static magnetic field placed on the ferrite material.
3) Altering the permeability of the ferrite allows tuning of the antenna's resonant frequency without changing the physical dimensions, providing flexibility to operate over a wide frequency range.
This document summarizes a research paper that presents a speech enhancement method using stationary wavelet transform. The method first classifies speech into voiced, unvoiced, and silence regions based on short-time energy. It then applies different thresholding techniques to the wavelet coefficients of each region - modified hard thresholding for voiced speech, semi-soft thresholding for unvoiced speech, and setting coefficients to zero for silence. Experimental results using speech from the TIMIT database corrupted with white Gaussian noise at various SNR levels show improved performance over other popular denoising methods.
This document reviews the design of an energy-optimized wireless sensor node that encrypts data for transmission. It discusses how sensing schemes that group nodes into clusters and transmit aggregated data can reduce energy consumption compared to individual node transmissions. The proposed node design calculates the minimum transmission power needed based on received signal strength and uses a periodic sleep/wake cycle to optimize energy when not sensing or transmitting. It aims to encrypt data at both the node and network level to further optimize energy usage for wireless communication.
This document discusses group consumption modes. It analyzes factors that impact group consumption, including external environmental factors like technological developments enabling new forms of online and offline interactions, as well as internal motivational factors at both the group and individual level. The document then proposes that group consumption modes can be divided into four types based on two dimensions: vertical (group relationship intensity) and horizontal (consumption action period). These four types are instrument-oriented, information-oriented, enjoyment-oriented, and relationship-oriented consumption modes. Finally, the document notes that consumption modes are dynamic and can evolve over time.
The document summarizes a study of different microstrip patch antenna configurations with slotted ground planes. Three antenna designs were proposed and their performance evaluated through simulation: a conventional square patch, an elliptical patch, and a star-shaped patch. All antennas were mounted on an FR4 substrate. The effects of adding different slot patterns to the ground plane on resonance frequency, bandwidth, gain and efficiency were analyzed parametrically. Key findings were that reshaping the patch and adding slots increased bandwidth and shifted resonance frequency. The elliptical and star patches in particular performed better than the conventional design. Three antenna configurations were selected for fabrication and measurement based on the simulations: a conventional patch with a slot under the patch, an elliptical patch with slots
1) The document describes a study conducted to improve call drop rates in a GSM network through RF optimization.
2) Drive testing was performed before and after optimization using TEMS software to record network parameters like RxLevel, RxQuality, and events.
3) Analysis found call drops were occurring due to issues like handover failures between sectors, interference from adjacent channels, and overshooting due to antenna tilt.
4) Corrective actions taken included defining neighbors between sectors, adjusting frequencies to reduce interference, and lowering the mechanical tilt of an antenna.
5) Post-optimization drive testing showed improvements in RxLevel, RxQuality, and a reduction in dropped calls.
This document describes the design of an intelligent autonomous wheeled robot that uses RF transmission for communication. The robot has two modes - automatic mode where it can make its own decisions, and user control mode where a user can control it remotely. It is designed using a microcontroller and can perform tasks like object recognition using computer vision and color detection in MATLAB, as well as wall painting using pneumatic systems. The robot's movement is controlled by DC motors and it uses sensors like ultrasonic sensors and gas sensors to navigate autonomously. RF transmission allows communication between the robot and a remote control unit. The overall aim is to develop a low-cost robotic system for industrial applications like material handling.
This document reviews cryptography techniques to secure the Ad-hoc On-Demand Distance Vector (AODV) routing protocol in mobile ad-hoc networks. It discusses various types of attacks on AODV like impersonation, denial of service, eavesdropping, black hole attacks, wormhole attacks, and Sybil attacks. It then proposes using the RC6 cryptography algorithm to secure AODV by encrypting data packets and detecting and removing malicious nodes launching black hole attacks. Simulation results show that after applying RC6, the packet delivery ratio and throughput of AODV increase while delay decreases, improving the security and performance of the network under attack.
The document describes a proposed modification to the conventional Booth multiplier that aims to increase its speed by applying concepts from Vedic mathematics. Specifically, it utilizes the Urdhva Tiryakbhyam formula to generate all partial products concurrently rather than sequentially. The proposed 8x8 bit multiplier was coded in VHDL, simulated, and found to have a path delay 44.35% lower than a conventional Booth multiplier, demonstrating its potential for higher speed.
This document discusses image deblurring techniques. It begins by introducing image restoration and focusing on image deblurring. It then discusses challenges with image deblurring being an ill-posed problem. It reviews existing approaches to screen image deconvolution including estimating point spread functions and iteratively estimating blur kernels and sharp images. The document also discusses handling spatially variant blur and summarizes the relationship between the proposed method and previous work for different blur types. It proposes using color filters in the aperture to exploit parallax cues for segmentation and blur estimation. Finally, it proposes moving the image sensor circularly during exposure to prevent high frequency attenuation from motion blur.
This document describes modeling an adaptive controller for an aircraft roll control system using PID, fuzzy-PID, and genetic algorithm. It begins by introducing the aircraft roll control system and motivation for developing an adaptive controller to minimize errors from noisy analog sensor signals. It then provides the mathematical model of aircraft roll dynamics and describes modeling the real-time flight control system in MATLAB/Simulink. The document evaluates PID, fuzzy-PID, and PID-GA (genetic algorithm) controllers for aircraft roll control and finds that the PID-GA controller delivers the best performance.
Comparative analysis between traditional aquaponics and reconstructed aquapon...bijceesjournal
The aquaponic system of planting is a method that does not require soil usage. It is a method that only needs water, fish, lava rocks (a substitute for soil), and plants. Aquaponic systems are sustainable and environmentally friendly. Its use not only helps to plant in small spaces but also helps reduce artificial chemical use and minimizes excess water use, as aquaponics consumes 90% less water than soil-based gardening. The study applied a descriptive and experimental design to assess and compare conventional and reconstructed aquaponic methods for reproducing tomatoes. The researchers created an observation checklist to determine the significant factors of the study. The study aims to determine the significant difference between traditional aquaponics and reconstructed aquaponics systems propagating tomatoes in terms of height, weight, girth, and number of fruits. The reconstructed aquaponics system’s higher growth yield results in a much more nourished crop than the traditional aquaponics system. It is superior in its number of fruits, height, weight, and girth measurement. Moreover, the reconstructed aquaponics system is proven to eliminate all the hindrances present in the traditional aquaponics system, which are overcrowding of fish, algae growth, pest problems, contaminated water, and dead fish.
Rainfall intensity duration frequency curve statistical analysis and modeling...bijceesjournal
Using data from 41 years in Patna’ India’ the study’s goal is to analyze the trends of how often it rains on a weekly, seasonal, and annual basis (1981−2020). First, utilizing the intensity-duration-frequency (IDF) curve and the relationship by statistically analyzing rainfall’ the historical rainfall data set for Patna’ India’ during a 41 year period (1981−2020), was evaluated for its quality. Changes in the hydrologic cycle as a result of increased greenhouse gas emissions are expected to induce variations in the intensity, length, and frequency of precipitation events. One strategy to lessen vulnerability is to quantify probable changes and adapt to them. Techniques such as log-normal, normal, and Gumbel are used (EV-I). Distributions were created with durations of 1, 2, 3, 6, and 24 h and return times of 2, 5, 10, 25, and 100 years. There were also mathematical correlations discovered between rainfall and recurrence interval.
Findings: Based on findings, the Gumbel approach produced the highest intensity values, whereas the other approaches produced values that were close to each other. The data indicates that 461.9 mm of rain fell during the monsoon season’s 301st week. However, it was found that the 29th week had the greatest average rainfall, 92.6 mm. With 952.6 mm on average, the monsoon season saw the highest rainfall. Calculations revealed that the yearly rainfall averaged 1171.1 mm. Using Weibull’s method, the study was subsequently expanded to examine rainfall distribution at different recurrence intervals of 2, 5, 10, and 25 years. Rainfall and recurrence interval mathematical correlations were also developed. Further regression analysis revealed that short wave irrigation, wind direction, wind speed, pressure, relative humidity, and temperature all had a substantial influence on rainfall.
Originality and value: The results of the rainfall IDF curves can provide useful information to policymakers in making appropriate decisions in managing and minimizing floods in the study area.
Applications of artificial Intelligence in Mechanical Engineering.pdfAtif Razi
Historically, mechanical engineering has relied heavily on human expertise and empirical methods to solve complex problems. With the introduction of computer-aided design (CAD) and finite element analysis (FEA), the field took its first steps towards digitization. These tools allowed engineers to simulate and analyze mechanical systems with greater accuracy and efficiency. However, the sheer volume of data generated by modern engineering systems and the increasing complexity of these systems have necessitated more advanced analytical tools, paving the way for AI.
AI offers the capability to process vast amounts of data, identify patterns, and make predictions with a level of speed and accuracy unattainable by traditional methods. This has profound implications for mechanical engineering, enabling more efficient design processes, predictive maintenance strategies, and optimized manufacturing operations. AI-driven tools can learn from historical data, adapt to new information, and continuously improve their performance, making them invaluable in tackling the multifaceted challenges of modern mechanical engineering.
Design and optimization of ion propulsion dronebjmsejournal
Electric propulsion technology is widely used in many kinds of vehicles in recent years, and aircrafts are no exception. Technically, UAVs are electrically propelled but tend to produce a significant amount of noise and vibrations. Ion propulsion technology for drones is a potential solution to this problem. Ion propulsion technology is proven to be feasible in the earth’s atmosphere. The study presented in this article shows the design of EHD thrusters and power supply for ion propulsion drones along with performance optimization of high-voltage power supply for endurance in earth’s atmosphere.
An improved modulation technique suitable for a three level flying capacitor ...IJECEIAES
This research paper introduces an innovative modulation technique for controlling a 3-level flying capacitor multilevel inverter (FCMLI), aiming to streamline the modulation process in contrast to conventional methods. The proposed
simplified modulation technique paves the way for more straightforward and
efficient control of multilevel inverters, enabling their widespread adoption and
integration into modern power electronic systems. Through the amalgamation of
sinusoidal pulse width modulation (SPWM) with a high-frequency square wave
pulse, this controlling technique attains energy equilibrium across the coupling
capacitor. The modulation scheme incorporates a simplified switching pattern
and a decreased count of voltage references, thereby simplifying the control
algorithm.
Use PyCharm for remote debugging of WSL on a Windo cf5c162d672e4e58b4dde5d797...shadow0702a
This document serves as a comprehensive step-by-step guide on how to effectively use PyCharm for remote debugging of the Windows Subsystem for Linux (WSL) on a local Windows machine. It meticulously outlines several critical steps in the process, starting with the crucial task of enabling permissions, followed by the installation and configuration of WSL.
The guide then proceeds to explain how to set up the SSH service within the WSL environment, an integral part of the process. Alongside this, it also provides detailed instructions on how to modify the inbound rules of the Windows firewall to facilitate the process, ensuring that there are no connectivity issues that could potentially hinder the debugging process.
The document further emphasizes on the importance of checking the connection between the Windows and WSL environments, providing instructions on how to ensure that the connection is optimal and ready for remote debugging.
It also offers an in-depth guide on how to configure the WSL interpreter and files within the PyCharm environment. This is essential for ensuring that the debugging process is set up correctly and that the program can be run effectively within the WSL terminal.
Additionally, the document provides guidance on how to set up breakpoints for debugging, a fundamental aspect of the debugging process which allows the developer to stop the execution of their code at certain points and inspect their program at those stages.
Finally, the document concludes by providing a link to a reference blog. This blog offers additional information and guidance on configuring the remote Python interpreter in PyCharm, providing the reader with a well-rounded understanding of the process.
Batteries -Introduction – Types of Batteries – discharging and charging of battery - characteristics of battery –battery rating- various tests on battery- – Primary battery: silver button cell- Secondary battery :Ni-Cd battery-modern battery: lithium ion battery-maintenance of batteries-choices of batteries for electric vehicle applications.
Fuel Cells: Introduction- importance and classification of fuel cells - description, principle, components, applications of fuel cells: H2-O2 fuel cell, alkaline fuel cell, molten carbonate fuel cell and direct methanol fuel cells.
Natural Gas Compressibility Factor Correlation Evaluation for Niger Delta Gas Fields
1. IOSR Journal of Electrical and Electronics Engineering (IOSR-JEEE)
e-ISSN: 2278-1676,p-ISSN: 2320-3331, Volume 6, Issue 4 (Jul. - Aug. 2013), PP 01-10
www.iosrjournals.org
www.iosrjournals.org 1 | Page
Natural Gas Compressibility Factor Correlation Evaluation for
Niger Delta Gas Fields
Obuba, J*.1
, Ikiesnkimama, S.S.2
, Ubani, C. E.3
, Ekeke, I. C.4
12
Petroleum/Gas, Engineering/ University of Port Harcourt, Nigeria
3
Department of Petroleum and Gas Engineering University of Port Harcourt Port Harcourt, Rivers State.
4
Department of Chemical Engineering Federal University of Technology Oweri, Imo State Nigeria.
Abstract: Natural gas compressibility factor (Z) is key factor in gas industry for natural gas production and
transportation. This research presents a new natural gas compressibility factor correlation for Niger Delta gas
fields. First, gas properties databank was developed from twenty-two (22) laboratory Gas PVT Reports from
Niger Delta gas fields. Secondly, the existing natural gas compressibility factor correlations were evaluated
against the developed database (comprising 22 gas reservoirs and 223 data sets). The developed new
correlation was used to compute the z-factors for the four natural gas reservoir system of dry gas, solution gas,
rich CO2 gas and rich condensate gas reservoirs, and the results were compared with some exiting correlations.
The performances of the developed correction indicated better statistical ranking, good graph trends and best
crossplots parity line when compared with correlations evaluated. From the results the new developed
correlation has the least standard error and absolute error of (stdEr) of 1.461% and 1.669% for dry gas;
6.661% and 1.674% for solution; 7.758% and 6.660% for rich CO2 and 7.668% and 6.661 % for rich
condensate gas reservoirs. The new correlation also show high correlation coefficient of: 93.39%, for dry gas;
89.24% for solution gas; 83.56% for rich CO2 and 83.34% for rich Condensate gas reservoirs. Also the
proposed new model maintained good graphical trends for four z-factors matched it: experimental, estimated
(Standing – Katz) and the best evaluated correlation when matched. Very good crossplots parity line
performance when compared with the evaluated correlations. It could then be concluded that the new developed
correlation and that of Papay correlation are most appropriate correlations for calculating natural
compressibility for Niger Delta gas fields. Carr, Kobayashi, and Burrows (1954) and Wichert–Aziz (1972),
correction factor methods; were applied to correct the presence of non-hydrocarbons. But the major setbacks
on laboratory analyses for PVT behavior are sometimes expensive and time consuming. Correlations, which are
used to predict gas compressibility factor, are much easier and faster than equations of state, invariably save
cost.
Key words: Niger Delta Gas, developing Compressibility factor, Evaluation, Correlations.
I. Introduction
The world now is shifting its energy demand to natural gas. This could be as result of the environmental
friendly of natural gas, rapid depletion of world‟s crude oil reserves and higher degree of calories of natural gas
when compared with that of crude oil. Nigeria is counted as one of the world‟s largest gas nation. As stated by
Oil and Gas Overview MBendi,[1]
„ informed that Nigeria‟s Natural gas proved reserves is 5.29 trillion cubic
meters, ranking 8th
positions of the world‟s natural gas proved reserves, as reported in BP Statistics Energy
Survey[2]
.
Recent studies show that, if Nigeria could rigorously pursue the production of natural gas as that of
crude oil in next couple of years will boost the country‟s income to 15 billion US dollars. Although, Nigeria is
now turning to its vast gas reserves as the money spinner of the future to the country. With exports from the
LNG plant on Bonny Island rising, Nigeria said it expects to see gas bringing in as much income in 10 years as
oil does, World Energy [3]
. For these reasons this study was orchestrated to proffers natural gas compressibility
factor correlations that will be suitable for Niger delta gas fields. The natural gas compressibility factor is a
measure of the amount of the gas deviate from perfect gas behavior. In gas industry, it is an important tool for
computing reservoir fluid properties either directly or indirectly. The application of this important factor ranges:
evaluation of gas, gas flow in pipes, material balance calculations, well analysis, numerical reservoir
simulations, etc.
The industry standard is to measure gas properties: Pressure – Volume – Temperature (PVT) of
reservoir in laboratory using reservoir sample. The compressibility factor (Z) was introduced into gas industry
to correct the deviation of ideal gas behaviour. The deviation of gases from the ideal gas behaviour at high
Submitted date 07 May 2013 Accepted Date: 13 May 2013
2. Natural Gas Compressibility Factor Correlation Evaluation For Niger Delta Gas Fields
www.iosrjournals.org 2 | Page
temperature and pressure depends on the composition of the gas. Many equation of state have been developed
by many authors in the attempt to correct the pressure-volume-temperature variables for real gas with
experimental data. To correct some assumptions so far made in relationship to ideal gas deviation, a correction
factor known as gas compressibility factor was introduced.
Many correlation methods for compressibility factor have been developed by many authors. Generally,
computation of compressibility factor can be done by empirical method, correlation method, corresponding state
method and as well as use of equation of state. The position of gas deviation factor in today‟s gas industry is
still a prominent one. It is one of the factors oil and gas industries cannot do without. In today standard
treatment of phase behavior requires the use of gas compressibility factor to operate. To this end Nigerian
natural gas industries need to relied on as more and more natural gas reservoirs are been discovered in onshore
and offshore of Nigeria. Therefore, it becomes a necessity to have a simple and robust correlation(s) to be able
to determine z-factor values accurately. This project presents methods that allow accurate determination of z-
factor values both for pure components and gas mixtures including significant amounts of non-hydrocarbon
components.
Accurate estimation of compressibility factor (Z) is very essential, most especially when it comes to
quick estimation of initial gas in place. It is also an important factor to rely on when dealing on gas metering,
where the volume flow of gas obtained from the orifice meter depends on the accuracy of the Z-factor.
Moreover, now that clean energy is in demand, it therefore stands that accurate estimate of existing gas reserves
and developing methods for the recovery of gas from reservoir as well as the capacity to design surface facilities
to handle this gas. For instance, percent error (21%) in the value of compressibility factor cause about 9% error
in the volume of metering gas which many eventually lead to loss of dollar by the supplier or the buyer of gas.
Standing and Katz Z-factor correlation is very reliable and has been used with confidence by industry
for more than 35 years for estimation of mixtures composed of pure hydrocarbon gases. Ikoku, [11]
; Ahmed [5]
.
The main issue for this study is that Nigeria has been rated 7th
world largest gas nation with estimated reserve
about 184 trillion cubic feet of natural gas reserves found mainly in Niger Delta region Kupolokun,[14]
. The
exploitation of the Niger Delta enrich gas reservoir for commercial purpose is new and therefore, there is the
need to evaluate exist correlations to determine the most suitable Z-factor for proper estimate and exploration of
the natural gas reserves in this region. This is the main aim of this study. Moreover, some of the correlations
perform better depending on geographical and geological of particular area they were developed for.
The knowledge of the pressure, volume, and temperature relationship plays a significant role in studying
ideal gas behaviour. According to Ahmed,[5]
, use of equations of state high at pressure could leads to errors of
500%, which is so high when compared with atmospheric pressure of 2-3%. Ideally, as pointed by Savidge
2000[12]
, gas compressibility factor was conceived as the means to account for the deviation of real gas behavior
from the behaviour of an ideal gas. The value of natural gas deviation factor Z, can be obtained in two major
different ways: laboratory experimental and equations of states.
The industry standard is to measure gas properties, Pressure–Volume– Temperature (PVT), in laboratory
using reservoir samples Standing,[9]
. But the major setbacks on laboratory analyses for PVT behavior are
sometimes expensive and time consuming. Correlations, which are used to predict gas compressibility factor,
are much easier and faster than equations of state. Therefore, the objective of this work is to develop a robust z-
factor correlation which can use to predict Niger Delta natural gas easily. As defined by Perrot, Pierre[16]
, an
equation of state is a thermodynamics equation describing the state of matter under a given set of physical
conditions. Mathematically, equation of state is defined ideally, as;
nRTpV (1)
While n is defined as the weight of the gas m divided by the molecular weight M. Terak[5]
, , by definition
M
m
n (2)
Combining Eqns 2.1 with 2.2 gives;
RT
M
m
Pv
(3)
Where m = molecular of gas, lb
M = molecular weight, lb/ft3
but m = m/v = density
and
RT
pM
v
m
g (4)
Where:
3. Natural Gas Compressibility Factor Correlation Evaluation For Niger Delta Gas Fields
www.iosrjournals.org 3 | Page
P = pressure, psia
V = volume of gas, ft3
n = number of pound moles of gas
R = universal gas constant = 10.732 psiaft3
/ o
R-lbm-mol;
T = temperature, o
R.
Z = dimensionless gas deviation factor or compressibility factor
and thus:
(5)
Principle of Corresponding State
The unique relationship between the compressibility factor and the reduced temperature, , and the
reduced pressure, , was first recognized by van der Waals in 1873 and is known as the two-parameter
principle of corresponding states. The principle of corresponding states expresses the generalization that the
properties of a gas which are dependent on molecular forces are related to the critical properties of the gas in a
universal way. That provides a most important basis for developing correlations of molecular properties. Hong
Wei Xiang [10]
.
As for the compressibility of gases, the principle of corresponding states indicates that any pure gas at
the same reduced temperature, , and reduced pressure, , should have the same compressibility factor..
The reduced temperature and pressure are defined as:
c
r
T
T
T
(6)
and
c
r
P
P
P (7)
Tc and Pc are known as the critical temperature and critical pressure of a gas. They are characteristics
of each specific gas with being the temperature above which it is not possible to liquefy a given gas and
is the minimum pressure required to liquefy a given gas at its critical temperature IUPAC GoldBook,[11]
.
Together they define the critical point of a fluid above which distinct liquid and gas phases of a given fluid do
not exist. In natural gas calculation pseudocritical pressure and temperature help to correlate the physical
properties of mixtures with the principle of corresponding states. This explained that similar gases have the
same gas deviation of Z-factor. (Lee, et al,[15]
Empirical Correlations Method (Standing-Katz Compressibility Factor Chart)
Standing and Katz[13]
presented a generalized z-factor chart, which has become an industry standard for
predicting the volumetric behavior of natural gases. To be able to use this chart, knowledge of reduced
temperature and reduced pressure are required, which further needs determination of critical properties (namely,
critical pressure and critical temperature of the system). Numerous methods have been suggested to predict
pseudocritical properties of the gases as a function of their specific gravity. The point to be noted here is that
these methods predict pseudo critical values which are evidently not accurate values of the gas mixtures. The
existing methods fail to predict accurate values of pseudocritical values when non-hydrocarbon components are
present in significant amounts.
Natural Gas Compressibility Factor Correlations (Direct Calculation)
After the Standing and Katz [7]
compressibility Z-factor chart breakthrough, although it was industrially
accepted as standard, but direct methods for computing natural gas Z-factor was obviously necessary due to the
tedious and high expensive of Stand-Katz laboratory method. As result, numerous equations state have been
developed in the attempt to correlate the pressure-volume-temperature variables for real gases outside
experimental data, Ahmed,[5]
. Several empirical calculations for computing Z-factor have been introduced by
many authors over the years. Most of these equations of state will be used to test the possibility for developing
the needed Z-factor for the Niger Delta gas fields.
4. Natural Gas Compressibility Factor Correlation Evaluation For Niger Delta Gas Fields
www.iosrjournals.org 4 | Page
II. Methodology
Data Acquisition:
A standard pressure-volume-temperature (PVT) natural gas data reports from renowned laboratories of
exploration and producing Petroleum Company operating in Niger Delta Gas fields in Nigeria were used to
prepare a database used for the study. Twenty –three (22) natural gas reservoirs were separated into four
categories according to natural gas compositions: two (2) dry gas reservoirs, with 24 data sets, twelve (12)
solution gas reservoirs consisting 144 data sets, two (2) carbon dioxide rich gas composition 24 data sets and
six (6) rich condensate gas reservoirs comprising 45 data sets respectively totaling 237 data sets. These different
gas well composition were then computed into different natural properties using Microsoft excel environment.
The computed gas properties are; Tc, Pc, Ppr, Tpr, apparent molecular weight, gas density etc, which were used
for the development of new Z-factor correlation for Niger Delta gas fields. But before then, the properties were
used to evaluate eight different equations of state (EOS): Yarborough and Hall (1973), Burnett (1979), Papp
(1979), Dranchuk; Purvis and Robison[8]
, Dranchuk and Abou Kaseem[7], Briggs and Brill[17]
, Papay (1968)
and Shell Oil Company. The EOS was used as a guide for the development of the new correlation for
determining the best correlation(s) for Niger Delta gas fields. Pseudo-reduced pressure (Pr) and temperature (Tr)
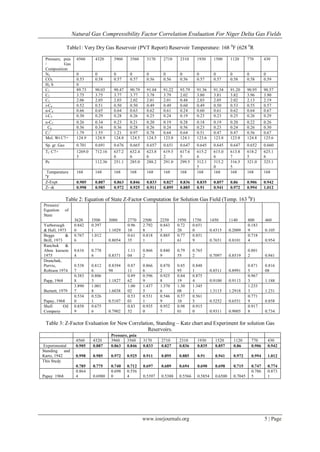
range were; 0.2≤Pr≤8 and 1.26≤Tr≤1.7805 respectively. Tables 1 show sample of the different PVT reports
from different gas fields in Niger Delta used for the correlations.
2.1 Correlation Developmeent And Comparison
One of the technical objectives of this study is to develop a new correlation for natural gas
compressibility factor for Niger Delta gas fields. This has been achieved by using the developed data bank for
Niger Delta gas fields.
TprPprZ 351293.3013363.041824.6 (6)
The steps followed for the development of the new z-factor were the normal application of all the roles
used for the computation of natural gas critical pressures and temperatures. We started by separating the gas
PVT report into its components, then applying Kay‟s mixing rule and Carr, Kohayashi-Burrows (1954)
correlation to account for the natural gas impurities for accurate z-factor values. Since Nigerian gas is sweet
type, i.e. no surphur, as result the Wichert-Aziz correlation were not considered.
Then, in order to know the integrity of the newly developed model the experimental Z- factor and
Standing and Katz chart was used to match the new developed correlation. Figures 1 to 4 show the graphical
trends of the combined Z-factors: experimental, Standing and Katz, EOS as well as the new correlation.
Also, the new z-facto correlation of natural gas compressibility factor presented in the study show great
accuracy statistically. The new compressibility factor Z, has the smallest errors. Among the compressibility
factor correlations considered in this study (the equations of state) the new correlation shows the smallest
standard error (Er%), absolute standard (Ea%), least skewness, better centralized kurtosis and highest coefficient
of correlation.
III. Results
The accuracy of eight (8) different equations of state most often used in natural gas industry for the
calculation of gas compressibility factor for natural gases are discussed in this section while the new developed
z-factor for Nigerian gas and steps taking for the development are explained (for new developed z-factor
correlation for Niger Delta gas fields) the results of eight equations of state used for the computation of the
various z-factors and that of Standing and Katz estimated chart are shown on Tables 1 to 4. Prior to the
calculations, the concept of Kay‟s (1936) mixing rule and Stewart-Burkhardt- Voo (1959); were applied to
determine the accuracy of the Niger Delta gas mixture compositions (since it is a sweet gas) and low molecular
weight, while Wincher–Aziz (1972), correction factor for the presence of non-hydrocarbons, was applied to
take care of the presence of Carbon dioxide. Then, a database was established, first of its kindly in Nigerian gas
industry for a standard correlation of these different equations of state. Four different reservoir systems: dry gas
system, solution gas system, rich carbon dioxide system and condensate rich gas system were computed using
the eight different correlation models. At the end, a new correlation model was developed for Niger Delta gas
fields, which shows a good fitting when matched with Standing Katz chart. See SK chart.
6. Natural Gas Compressibility Factor Correlation Evaluation For Niger Delta Gas Fields
www.iosrjournals.org 6 | Page
Table 4: Rich Carbon Dioxide Z-Factor Evaluation for New Correlation, Standing – Katz chart and Experiment
for Gas Reservoirs
Pressure, psia
486 4430 4050 3680 3350 2980 2680 2250 1750 1200 890 540
Experiment
al 0.968 0.934 0.906 0.882 0.863 0.846 0.834 0.826 0.828 0.851 0.877 0.915
Standing
and Kartz,
1942 0.971 0.962 0.935 0.926 0.946 0.906 0.911
0.910
1 0.931 0.941 0.975 0.982
This Study 0.955 0.943 0.875 0.751 0.749 0.651 0.756 0.785 0.752 0.764 0.855 0.958
Papay, 1968
0.668
6 0.642
0.598
8
0.570
6
0.563
6
0.606
3
0.559
4
0.568
1 0.6651
0.682
0
0.776
5 0.872
Table 5: Condensate Z-Factor Evaluation for New Correlation, Standing – Katz chart and Experiment for Gas
Reservoirs
PRESSURE, psia
5295 4700 4100 3500 2700 2300 1700 1100
Papay, 1968 0.88531 0.74298 0.54725 0.55532 0.53474 0.5588 0.6198 0.71889
Experimental 1.008 0.938 0.89 0.855 0.833 0.829 0.848 0.883
Standing And
Kartz, 1942 1.055 1.001 0.9001 0.9101 0.8901 0.862 0.885 0.9302
This Study 1.0006 1.0005 0.9895 0.78051 0.73515 0.7854 0.8523 0.9015
Table 6: Grading of Correlation Performance
EOS Dry gas Solution
Gas
Rich
CO2 gas
Condensate
rich gas
Average
Yarborough & Hall, 1973 7 9 9 9 8.5
Beggs & Brill, 1973 9 6 8 8 7.75
Ranchuk & Abou kassem 1975 5 2 6 4 4.5
Dranchuk, Purvis, Robison 1974 2 7 3 1 3.25
Papp, 1968 4 1 5 7 4.25
Burnett, 1979 8 5 7 2 5.5
Papay, 1968 3 3 2 5 3.25
Shell Oil Company 6 8 4 3 5.25
This Study 1 4 1 6 3.00
IV. Discussion
Several mathematical expressions fitting the SK chart have been proposed to calculate the gas
compressibility factor (Papay, 1968; Yarborough and Hall, 1974; Dranchuk and Abou Kassem,[18]
; Dranchk et
al., 1974; Brill and Beggs,[20]
, Burne 1979, Shell Oil Company. The main objectives of this study is to
develop of suitable correlation(s) to estimate accurately the natural gas compressibility factor for Niger Delta
gas fields, moreover, when natural gas composition is not available. Using available of natural gas database.
Tables 1 through 5 show the comparison of different correlations for the four natural gas reservoirs used for
this study. From the results it could be deducted that the performance of the various correlations are significant
to individual reservoir due to changes in temperature and pressure.
Graphical Analysis
Figures 1 to 4 are graphical comparative results of the evaluated existing correlation, the experimental, and that
of Standing and Katz chart values for the components of the four reservoirs system are shown below. This
performance results shows that the proposed correlation for Niger Delta gives a brilliant result when
compared with other z-factors.
Another method we applied for selection of best correlation is called crossplots parity line. This
method illustrates how most data points fall on the angle of 45o
parity line, and also it indicates how perfect data
distribution at the centre of chart is. Figure 5 through 8 illustrate this for the new z-factor correlation. This
results show a remarkable brilliant performance for that of new correlation when compared with existing
correlation used for the comparisons and can be used to predict z-factor calculation for natural gas reservoirs in
Niger Delta.
7. Natural Gas Compressibility Factor Correlation Evaluation For Niger Delta Gas Fields
www.iosrjournals.org 7 | Page
4.2 Grading of Correlation Performance
Grading of correlation performance method is used to select the best correlation (s) for the natural gas
compressibility factor for Niger Delta gas fields. This method also known as ranking is generally apply in
natural gas industry when selecting the best predicting natural gas deviation factor. Table 6, shows the grading
performance of the new z-factor and eight (8) equations of state tested with Niger Delta natural gas. The Table
shows that our new developed correlation has the least average ranking of 3.00 followed by Papay and
Dranchuk, Purvis and Robison with 3.25 each. While Yarborough – Hall and Beggs – Brills have the highest of
8.5 and 7.75 respectively. This therefore, means that our new developed correlation shows best correlation
performance.
Fig.1: Plot of experiment, Papay Equation of State and Standing and Katz Chart Z-Factors for Very Dry Gas
Reservoir in Niger Delta gas Fields.
Fig. 2: Plot of experiment, Papay Equation of State and Standing and Katz Chart Z-Factors for Solution Gas
Reservoir in Niger Delta gas Fields
Figure. 3: Plot of experiment, Papay Equation of State and Standing and Katz Chart Z-Factors for Rich Carbon
Dioxide Gas Reservoir in Niger Delta gas Fields
8. Natural Gas Compressibility Factor Correlation Evaluation For Niger Delta Gas Fields
www.iosrjournals.org 8 | Page
Figure. 4: Plot of experiment, Papay Equation of State and Standing and Katz Chart Z-Factors for Rich
Condensate Gas Reservoir in Niger Delta gas Fields
Figure. 5: Cross Plot for Z-factor Experiment vs New Z-factor Correlation for Dry Gas
Figure. 6: Cross Plot for Z-factor Experiment vs. New Z-factor Correlation for Solution Gas Reservoir
Figure. 7 : Cross Plot for Z-factor Experiment vs New Z-factor Correlation for Rich CO2 Gas Reservoir
9. Natural Gas Compressibility Factor Correlation Evaluation For Niger Delta Gas Fields
www.iosrjournals.org 9 | Page
Fig. 8: Cross Plot for Z-factor Experiment vs New Z-factor Correlation for Condensate Rich Gas Reservoir
V. Conclusions
The objective of this work is to develop a robust z-factor correlation which can use to predict Niger
Delta natural gas easily; this was made possible with the following steps:
a. A database for Niger Delta gas field has been generated and applied to computation of z-factor. This was
achieved by using PVT reports from multinational oil and gas exploration and producing companies in
Niger Delta.
b. Z-factors for various equations of state and a new model equation were calculated and used for the
correlations. These equations of state are routinely used in gas industries.
c. Four natural gas reservoirs system: dry gas, solution gas, rich carbon dioxide and condensate rich gas wells
were separated and tested with eight equations of state and as well as the new developed compressibility
factor correlation for Niger Delta gas for the finding the best correlation for Niger Delta gas fields.
d. Appropriate steps were taken for calculation of the equation z-factors; such as application of the Carr,
Kohayashi-Burrows (1954) correlation to account for the natural gas impurities for accurate z-factor values.
Since Nigerian gas is sweet type, i.e. no surphur, as result the Wichert-Aziz correlation were not
considered.
e. Statistical analysis of the data and graphical trends were used to be able draw the conclusions of the best
correlation. And also to test performance of the new model.
f. From all the techniques applied, it was conclusively shown that the our new developed compressibility
factor correlation show perfect correlation performance with the lowest standard and absolute average and
best coefficient correlation (R) for the four reservoir systems tested. Best performance graphical trends
when compared with the evaluated eight (EOSs). Papay Correlation was the best of the EOSs tested with
least percent standard error and absolute standard error, lowest skewness and moderate kurtosis symmetry,
highest correlation coefficient. Graphically, the Papay correlation shows the best trends performance in the
four reservoirs system.
References
[1] MBend Statistics & Energy Survey, Nigeria oil and gas production , 2012. Extract from Internet. 2012.
[2] World Energy, Nigeria Position in World Oil and Gas reserve as 2011.
[3] T. Ahmed, Reservoir engineering Handbook. (Butterworth –Heinemann. US. , 2001, 2nd Edition. Pp. 29-66.)
[4] O. Redlich, and J. Kwong, “On Thermodynamics of Solutions. An Equation of State. Fugacities of Gaseous Solutions.” Chemical
Reviews. 44, (233), 1949
[5] J. P. Brill. and H. D. Beggs, “Two-Phase flow in pipes”. (Intercomp Course, The Huge, 1974)
[6] M. Benedict, G. B. Webb, and L. C. Rubin, “An Empirical Equations for Thermodynamics Properties of Light Hydrocarbons and
their Mixtures: Methane, Ethane, Propane and n-Butane.” Journal of Chemistry and Physics. (8), 334, 1940.
[7] P. M. Dranchuk, and J. H Abou-Kassem, Calculation of Z Factors For Natural Gases Using Equations of State. Society of Petroleum
Engineers [successor to Petroleum Society of Canada. 14( 3), 1975.
[8] P. M. Dranchuk,.; R. A Purvis,.; and D. B. Robison, “Natural Gas Compressibility Factors Using the Stranding and Katz
Correlations.” Inst. Of petroleum Technicals Institute Series No. IP 74-008. 1974
[9] Gas Compressibility Factor With Hall-Yarborough Method. Petroleum Support. 2011.
[10] Hong Wei Xiang, The Corresponding States Principle and Its Practice: Thermodynamic, Transport and Surface Properties of Fluids.
Elsevier. 2005, ISBN 0-444-52062-7.
[11] C. U. Ikoku, Natural Gas Production Engineering (Krieger Publishing Company, Malabar, Florida, 1992).
[12] J. L. Savidge Compressibility of Natural Gas. “ The first requirement of gas measurement is accuracy” 2000
[13] D. L. Katz, Natural Gas Compressibility Factor in McGraw (Ed), Handbook of Natural Gas Engineering, New York 1959
[14] F. M. Kupolokun, Nigeria and the Future Global Gas Market: A Speech at the Baker Institute Energy Forum, Houston, USA, 2nd
May 2006.
10. Natural Gas Compressibility Factor Correlation Evaluation For Niger Delta Gas Fields
www.iosrjournals.org 10 | Page
[15] J. Leed and R. A. Wattenbarger, Gas Reservoir Engineering. Society of Petroleum Engineers (SPE) Textbook Series, Vol. 5. USA.,
1999
[16] P. Perrot, A to Z of Thermodynamics. (Oxford University Press 1998), ISBN 0-19-856552-6 1998
[17] D. Y. Peng,., and D. B. Robinson, “A New Two Constants Equation of State,”
Ind. Eng. Chem. Fund., 15,( 59) 1976
[18] Starling, K.E., and Savidge, J. L.,(1994) Compressibility Factors of Natural Gas and Other Related Hydrocarbon Gases, American
Gas Association, Transmission Measurement Committee Report