Download as PDF, PPTX


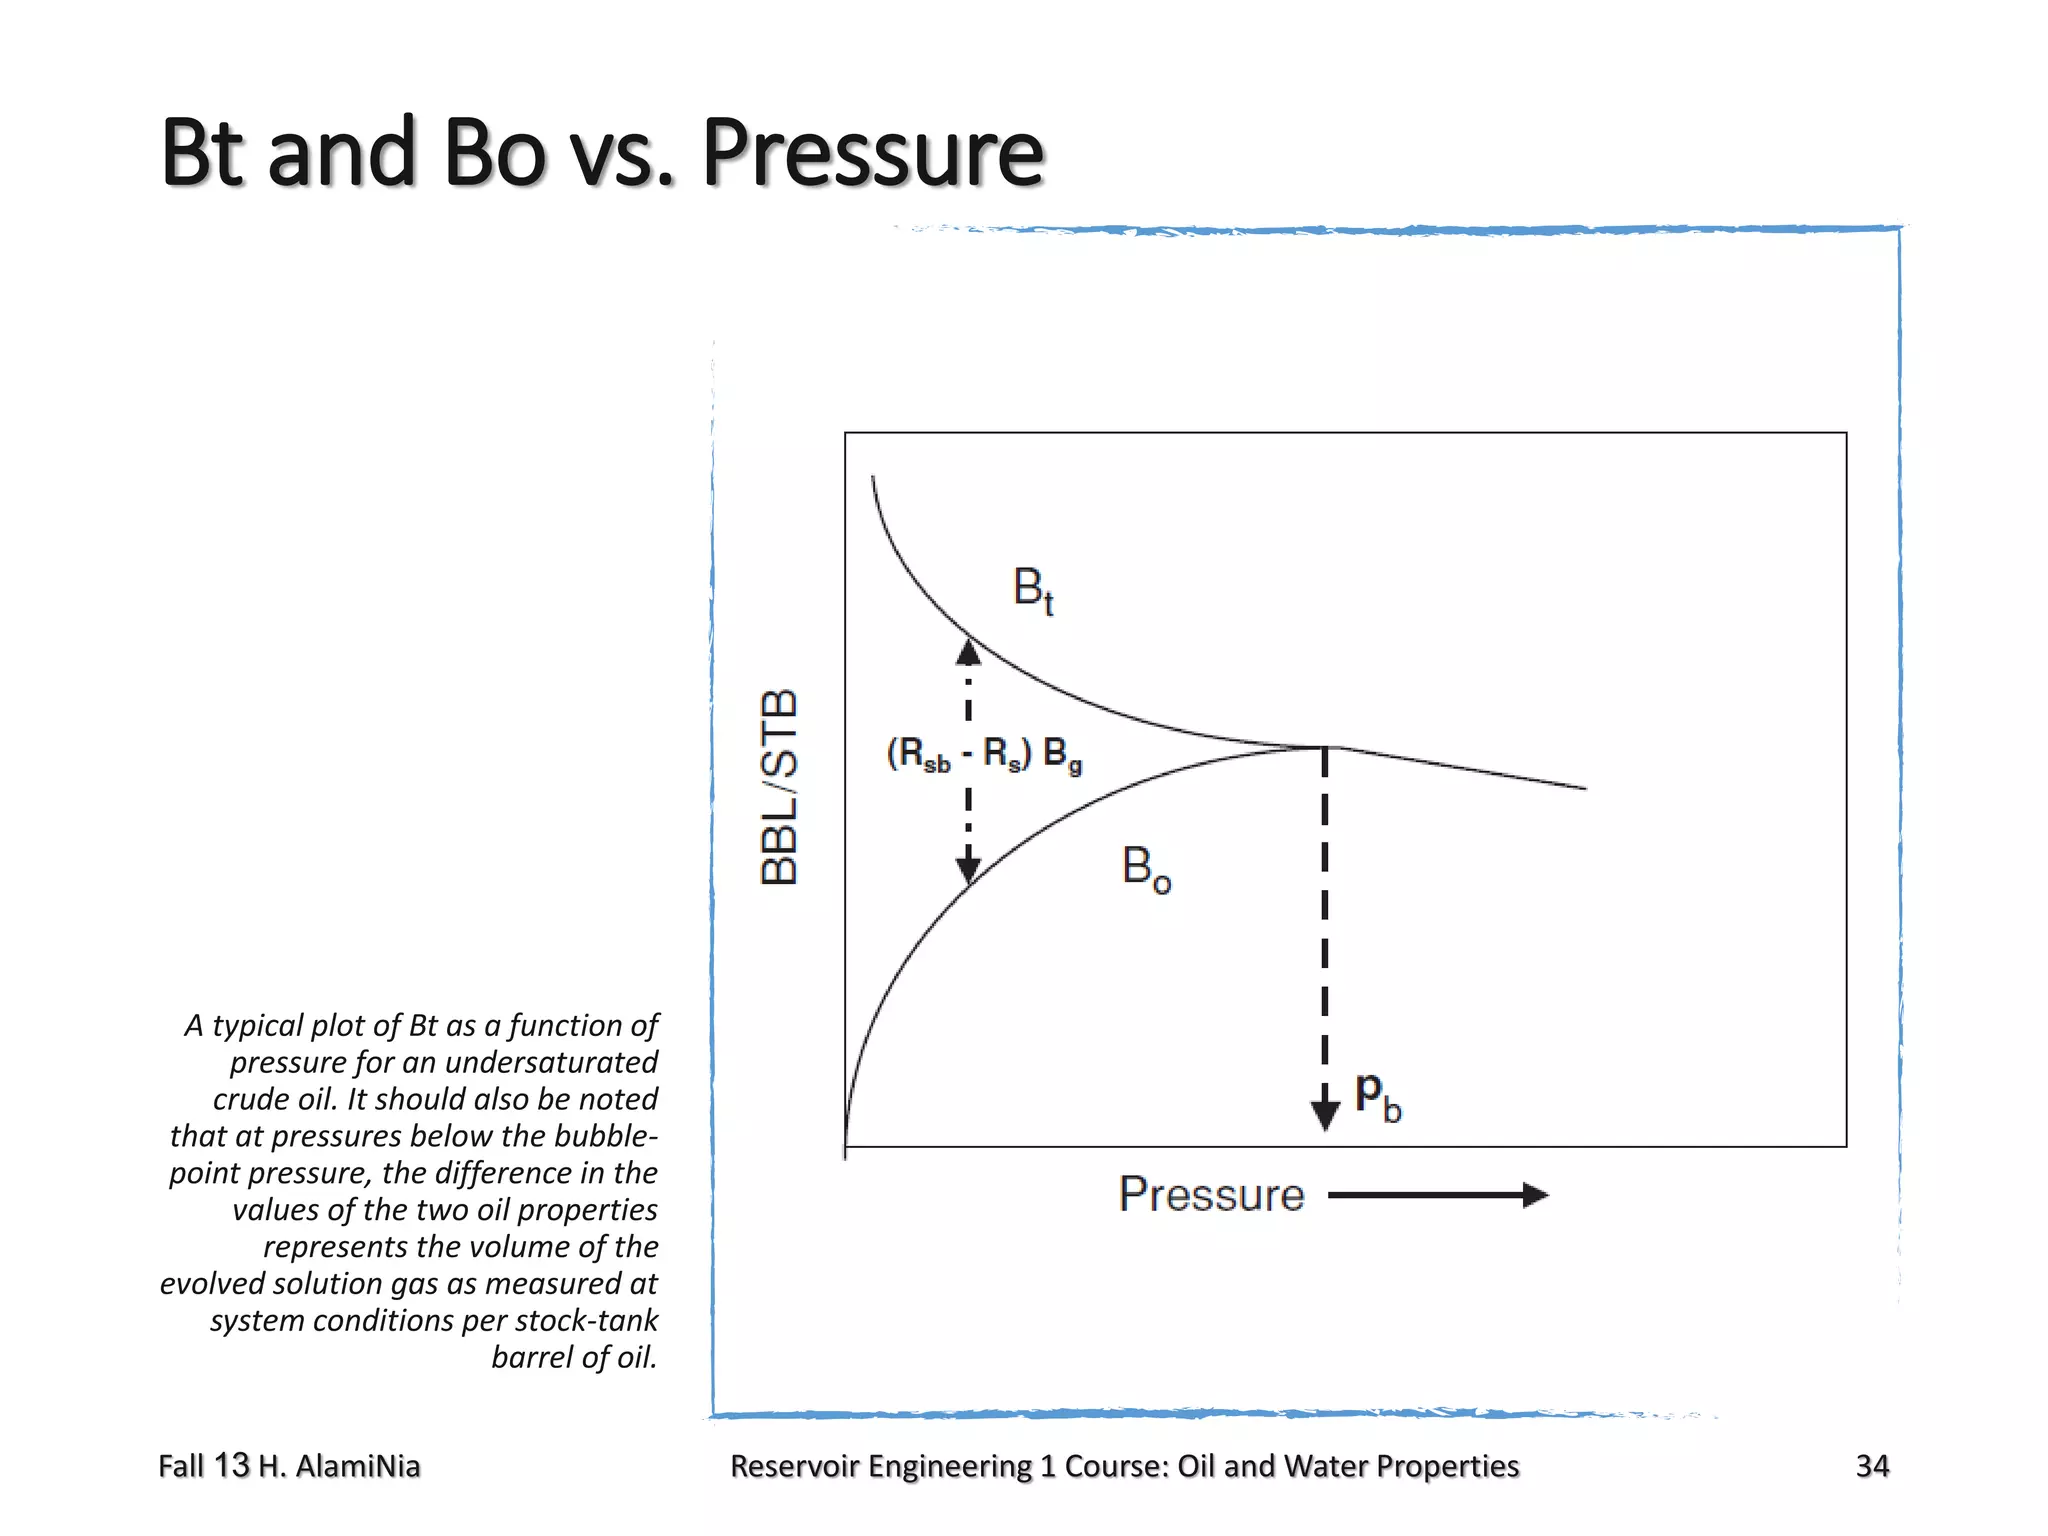

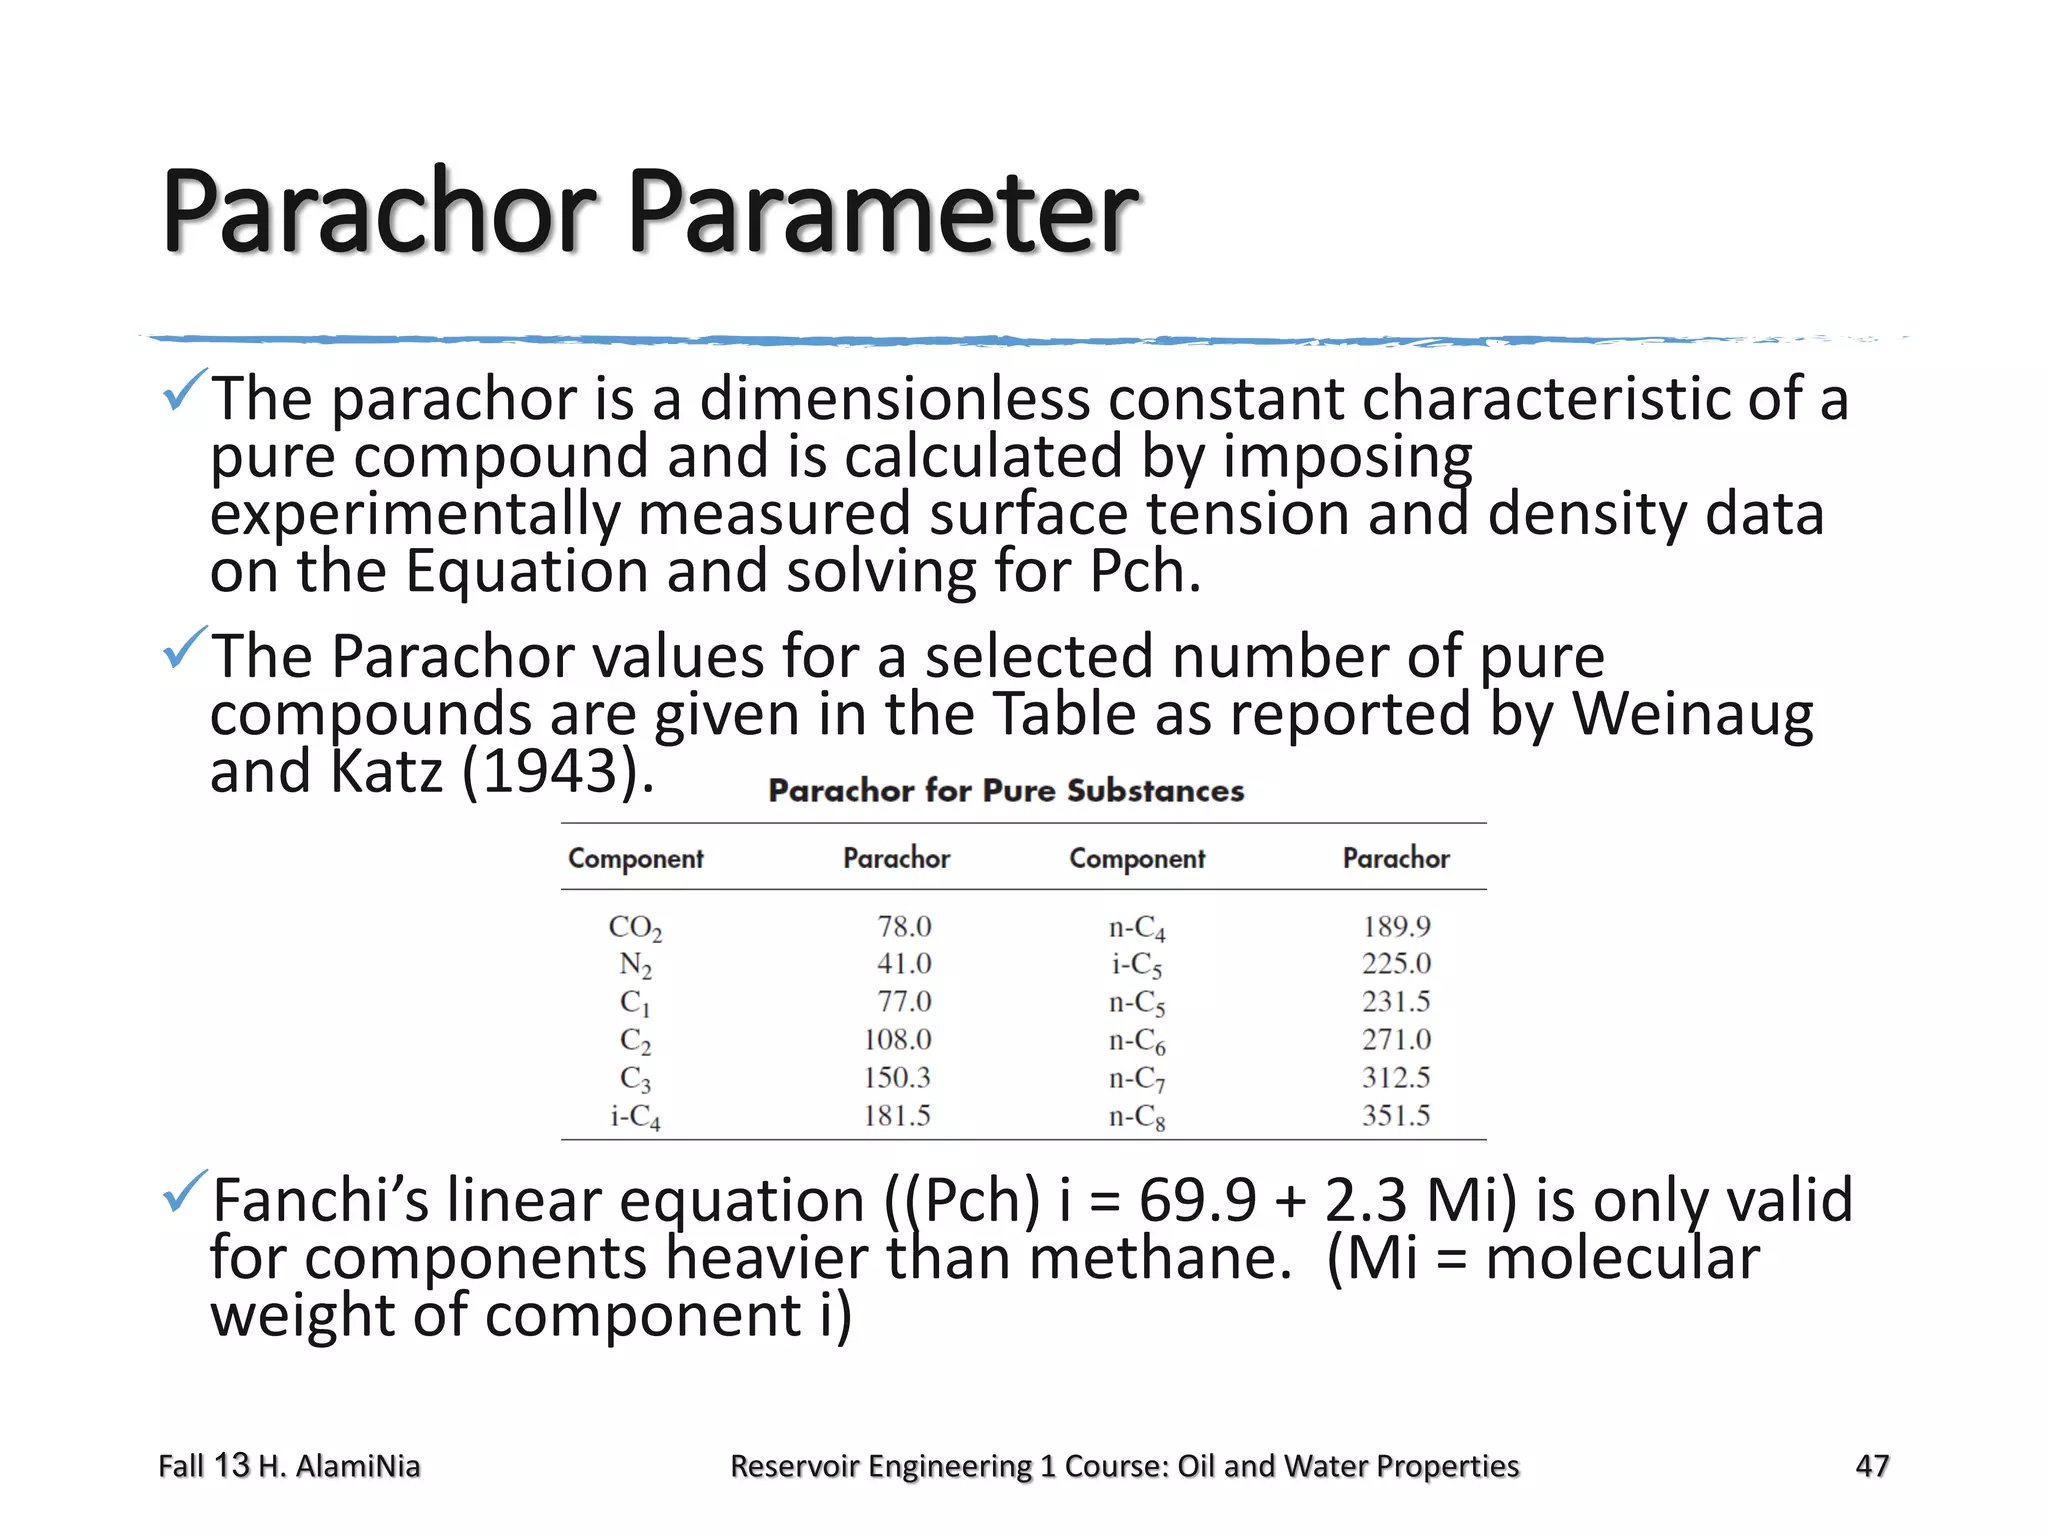

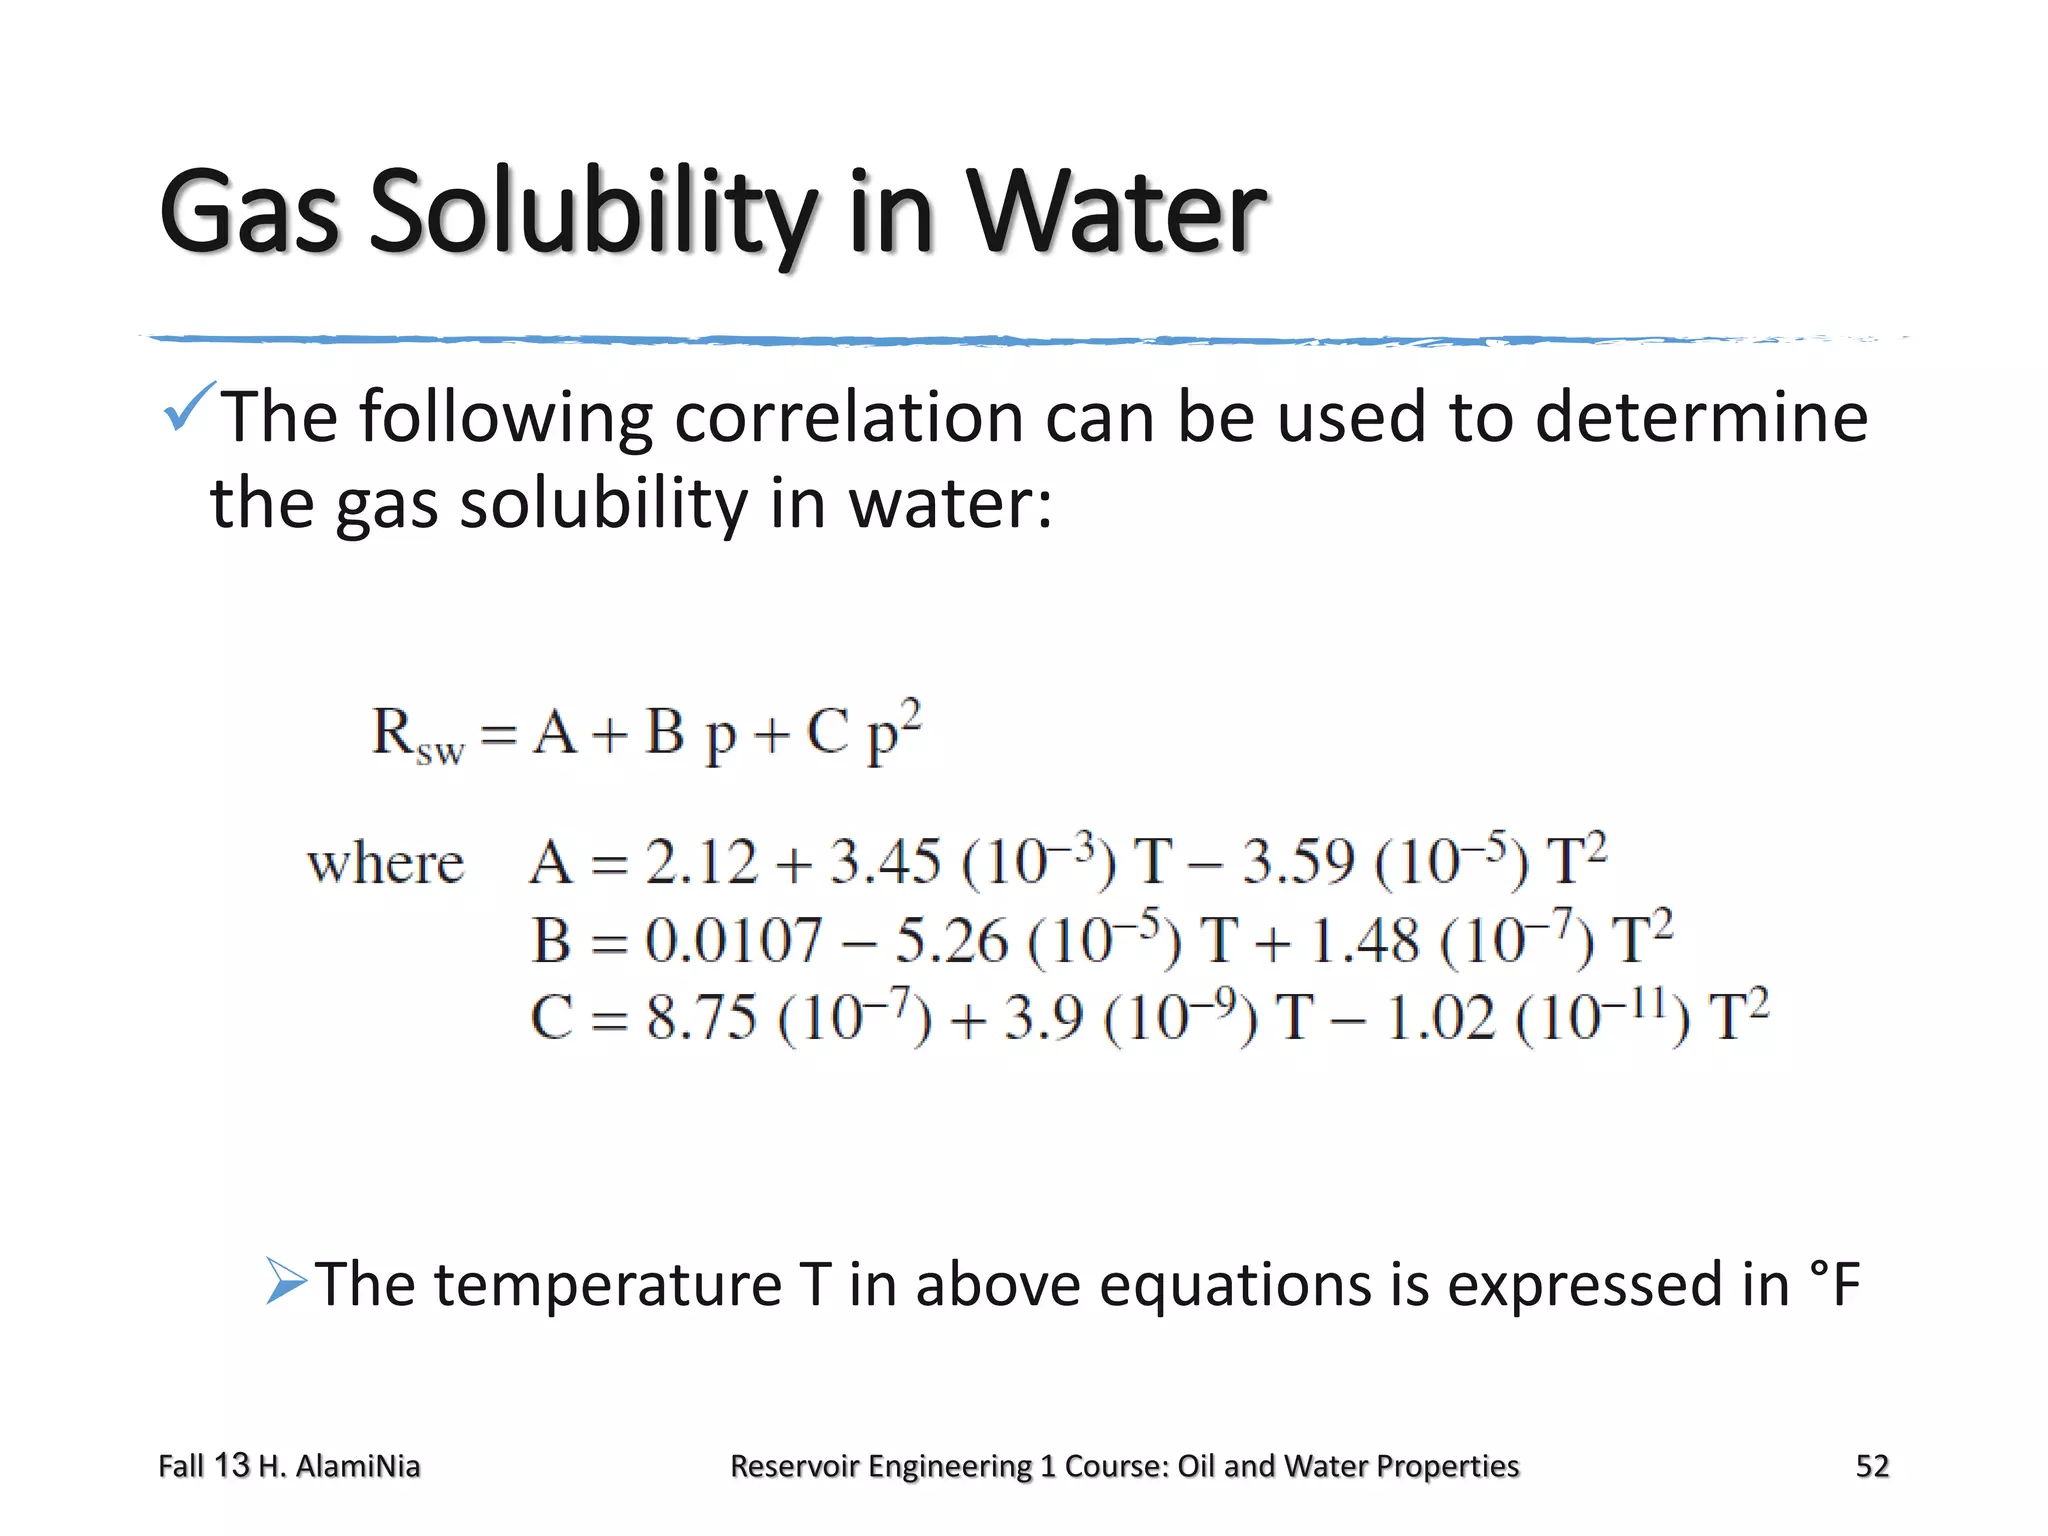
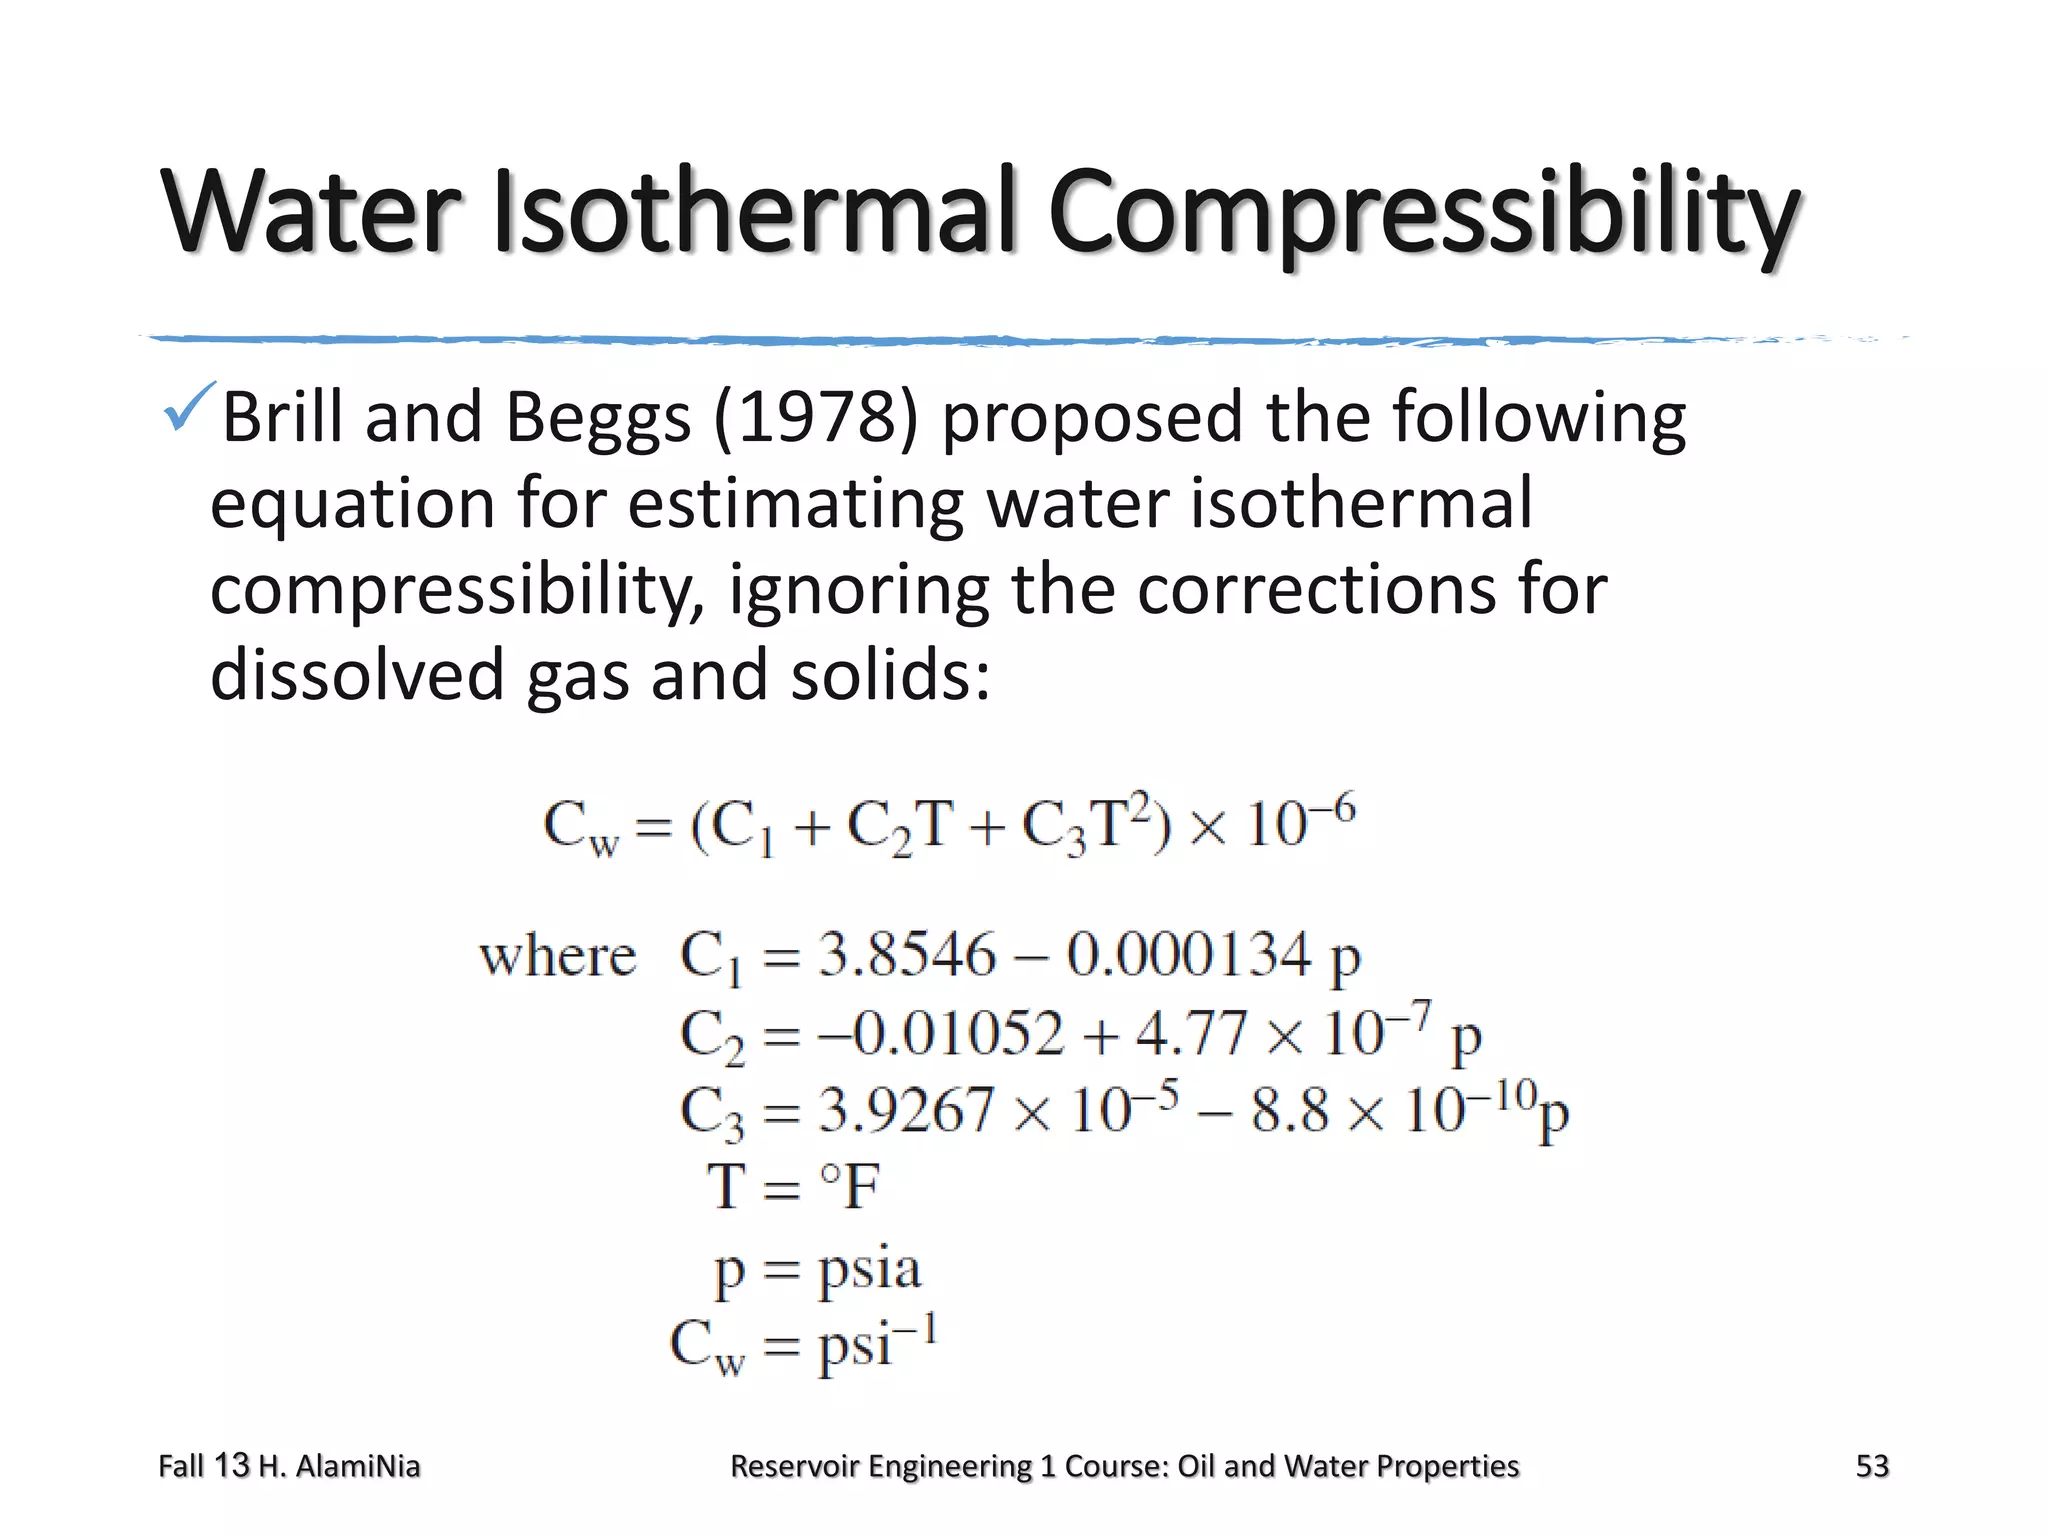


This document outlines topics covered in a reservoir engineering course, including reservoir fluid behaviors, properties of petroleum reservoirs, gas behavior, and properties of crude oil systems. It specifically discusses properties of interest like density, solution gas, bubble point pressure, formation volume factor, viscosity and more. It provides empirical correlations to estimate properties like gas solubility, bubble point pressure, and formation volume factor as a function of parameters like solubility, gas gravity, oil gravity and temperature. The document is focused on understanding physical properties of crude oil and gas reservoirs which is important for reservoir engineering applications and problem solving.


![Heinemann zoltán e[1]._-_petroleum_recovery_](https://cdn.slidesharecdn.com/ss_thumbnails/heinemannzoltne1-150111211406-conversion-gate02-thumbnail.jpg?width=640&height=640&fit=bounds)