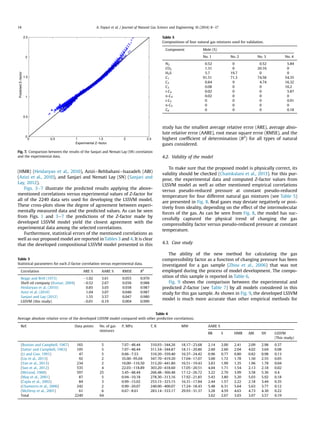
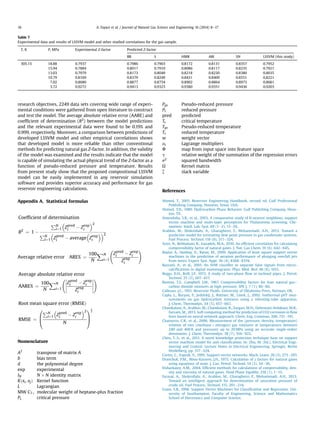
This document presents a new method for estimating natural gas compressibility factor (Z-factor) using least square support vector machine (LSSVM) modeling. The LSSVM model is developed and tested using a database of over 2,200 samples of sour and sweet gas compositions. The model predicts Z-factor as a function of gas composition, molecular weight, pressure, and temperature. Statistical analysis shows the LSSVM model outperforms existing empirical correlations with an average absolute relative error of 0.19% and correlation coefficient of 0.999. The accurate prediction of Z-factor is important for natural gas engineering calculations.
An Offshore Natural Gas Transmission Pipeline Model and Analysis for the Pred...IOSRJAC
The purpose of this paper is to model and analyze an existing natural gas transmission pipeline – the 24-inch, 5km gas export pipeline of the Amenam-Kpono field, Niger Delta, Nigeria – to determine properties such as pressure, temperature, density, flow velocity and, in particular, dew point, occurring at different segments of the pipeline, and to compare these with normal pipeline conditions in order to identify the segments most susceptible to condensation/hydrate formation so that cost-effective and efficient preventive/remedial actions can be taken. The analysis shows that high pressure and low temperature favor condensation/hydrate formation, and that because these conditions are more likely in the lower half of the pipeline system, remedial/preventive measures such as heating/insulation and inhibition injection should be channeled into that segment for cost optimization..
This document summarizes a study that used the SAFT-VR Mie equation of state to model transport properties like viscosity and interfacial tension of CO2-rich systems relevant to carbon capture and storage. The SAFT-VR Mie EoS was used to calculate densities, from which a viscosity model and density gradient theory were used to predict viscosity and interfacial tension, respectively. Results for five binary mixtures and two multicomponent mixtures were compared to experimental data and showed good agreement, supporting the capabilities of the models.
International Journal of Engineering Research and Applications (IJERA) is an open access online peer reviewed international journal that publishes research and review articles in the fields of Computer Science, Neural Networks, Electrical Engineering, Software Engineering, Information Technology, Mechanical Engineering, Chemical Engineering, Plastic Engineering, Food Technology, Textile Engineering, Nano Technology & science, Power Electronics, Electronics & Communication Engineering, Computational mathematics, Image processing, Civil Engineering, Structural Engineering, Environmental Engineering, VLSI Testing & Low Power VLSI Design etc.
The document presents a computational tool and methodology for simulating compact tube bundle heat exchangers used in recuperated gas turbine engines. Computational fluid dynamics analyses were performed on an oval tube bundle heat exchanger to derive resistance tensors for modeling the heat exchanger as a porous medium. The porous media model was validated against experimental hot gas channel and isothermal flow test data, showing acceptable agreement between calculated and measured velocity profiles and less than 10% deviation in pressure drop. While cold side heat transfer correlations predicted results reasonably well, hot gas calculations overpredicted heat transfer likely due to assumptions about flow regime.
This document presents a comparative study of the thermodynamic and economic performance of three organic Rankine cycle (ORC) configurations - a basic ORC, a regenerative ORC (RORC), and a two-stage evaporation ORC (TSEORC) - for geothermal electricity production in developed and developing countries. The study optimizes operating parameters of the cycles using different methods and evaluates economic performance based on levelized cost of electricity, return on investment, and payback period for 20 countries with geothermal resources. The results show that a TSEORC with working fluid R123 has the highest return on investment and shortest payback period for Australia, while basic ORC with R134a and R
Greenhouse Gas Emissions From Land Applied Swine Manure: Development of Metho...LPE Learning Center
For more: http://www.extension.org/67579 A new method was used at the Ag 450 Farm Iowa State University (41.98N, 93.65W) from October 24, 2012 through December 14, 2012 to assess GHG emission from land-applied swine manure on crop land. Gas samples were collected daily from four static flux chambers. Gas method detection limits were 1.99 ppm, 170 ppb, and 20.7 ppb for CO2, CH4 and N2O, respectively. Measured gas concentrations were used to estimate flux using four different models, i.e., (1) linear regression, (2) non-linear regression, (3) non-equilibrium, and (4) revised Hutchinson & Mosier (HMR). Sixteen days of baseline measurements (before manure application) were followed by manure application with deep injection (at 41.2 m3/ha), and thirty seven days of measurements after manure application.
This document discusses the use of pedotransfer functions (PTFs) to estimate soil hydraulic properties for use in soil water balance models. The performance of published PTFs developed by Vereecken et al. (1989, 1990) were evaluated by comparing simulated soil moisture contents, pressure heads, and drainage fluxes using estimated soil hydraulic properties against measured field data from a test site. Simulations using estimated properties overpredicted soil moisture contents and drainage fluxes compared to simulations using measured soil hydraulic properties from the test site. The study highlights the need for further evaluation of PTFs against field measurements of soil water balance components before widespread application in models.
With increasing pollution worldwide, the emission standards for diesel engines has become more stringent. The Euro 6 limits the NOxemission from diesel engine to 0.08 g Km. The current paper presents the various analysis method of EGR cooler operating under different conditions. The primary causes of EGR failures i.e. fouling is also studied by various scholars. The numerical method CFD encompassing 1D geometry and experimental techniques of evaluating EGR cooler is also studied. The effect of geometry, material and operating conditions on performance of EGR cooler are investigated by various scholars and the results obtained by such tests are also presented. Dwarika Sahu | Dr. S. S. K. Deepak "Review on Numerical Analysis of EGR Cooler" Published in International Journal of Trend in Scientific Research and Development (ijtsrd), ISSN: 2456-6470, Volume-4 | Issue-6 , October 2020, URL: https://www.ijtsrd.com/papers/ijtsrd33570.pdf Paper Url: https://www.ijtsrd.com/engineering/mechanical-engineering/33570/review-on-numerical-analysis-of-egr-cooler/dwarika-sahu
This document discusses data-driven methodologies for forecasting oil and gas production in unconventional reservoirs using historical production data. It introduces the bootstrapping module, clustering module, and data mining workflow that are part of the methodology. The bootstrapping module uses modified model-based bootstrap and Monte Carlo simulation to generate multiple production scenarios and build reliable confidence intervals for forecasts. The clustering module helps group similar wells. The data mining workflow identifies patterns and correlations to develop predictive models. The methodology aims to provide more accurate, probabilistic forecasts of well performance and reserves estimates compared to traditional decline curve analysis approaches.
A strategy for an efficient simulation of countcorrent flows in the iron blas...Josué Medeiros
This document summarizes a strategy for efficiently simulating countercurrent gas and solids flows in an iron blast furnace. Key aspects of the strategy include:
1) Modeling the gas flow using an anisotropic Ergun equation that accounts for layered porous media and can be solved using a computationally efficient algorithm.
2) Modeling the slow descending solids flow using an irrotational flow assumption and conservation of mass.
3) Modeling heat transfer between the gas and solids using energy balance equations that account for convection and heat exchange, with appropriate enthalpy-temperature relationships.
4) Accounting for the stagnant central "deadman" zone and high-flow "race
Shortcut Design Method for Multistage Binary Distillation via MS-ExceIJERA Editor
Multistage distillation is most widely used industrial method for separating chemical mixtures with high energy consumptions especially when relative volatility of key components is lower than 1.5. The McCabe Thiele is considered to be the simplest and perhaps most instructive method for the conceptual design of binary distillation column which is still widely used, mainly for quick preliminary calculations. In this present work, we provide a numerical solution to a McCabe-Thiele method to find out theoretical number of stages for ideal and non-ideal binary system, reflux ratio, condenser duty, reboiler duty, each plate composition inside the column. Each and every point related to McCabe-Thiele in MS-Excel to give quick column dimensions are discussed in details
1. The document numerically investigates turbulent air flow in a coaxial jet burner using Reynolds Averaged Navier Stokes (RANS) modeling.
2. It compares predicted results of air axial velocity, air swirl velocity, and turbulent kinetic energy at different axial positions to experimental measurements from a previous study.
3. The simulation results show good agreement with experimental data, except at side regions where air velocity is under estimated, demonstrating RANS is a reasonably accurate approach for modeling industrial turbulent flows.
International Journal of Engineering Research and DevelopmentIJERD Editor
Electrical, Electronics and Computer Engineering,
Information Engineering and Technology,
Mechanical, Industrial and Manufacturing Engineering,
Automation and Mechatronics Engineering,
Material and Chemical Engineering,
Civil and Architecture Engineering,
Biotechnology and Bio Engineering,
Environmental Engineering,
Petroleum and Mining Engineering,
Marine and Agriculture engineering,
Aerospace Engineering.
A two-dimensional mathematical, model is developed to simulate the flow regime,
of the upper part of Dibdibba Formation. The proposed, conceptual model, which is
advocated to simulate the flow regime of aquifer is fixed for one layer, i.e. the activity
of the deeper aquifer is negligible. The model is calibrated using, trial and error
method. According to the calibration process, the hydraulic characteristics of the
upper aquifer has been identified the hydraulic conductivity in the study area ranged
(60-200) m/day while the specific, yield ranges, between, (0.08- 0.45).In this research,
the obtaining of the optimum management of groundwater flow by linked simulationoptimization
model. MODFLOW packages are used to simulate the flow in the system
of groundwater. This model is completed with an optimization model which is
depending on the Genetic Algorithm (GA) and Tabu Search (TS). Two management
cases (fixed well location and flexible well location with the moving, well option)
were considered by executing the model with adopting calibratedparameters. In the,
first case the objective function is converged to a maximum value of (3.35E+5 m3/day)
by using GA, while this function is closed to 4.00E+5 m3/day by using TS. The
objective function in second case converges to the maximum value (7.64E+05m3/day)
and (8.25E+05m3/day) when using GA and TS respectively. The choice option for the
optimal location of the wells in the second case leads to an increase of 106%
CFD Analysis and Melting Performance of PCMs in Two Dimensional SphereIRJET Journal
This document summarizes a numerical study comparing the melting performance of three phase change materials (PCMs) - paraffin wax, sodium acetate trihydrate, and lauric acid - in a two-dimensional hollow spherical container. The study uses computational fluid dynamics (CFD) simulations to analyze melt fraction contours and temperature distributions over time as each PCM melts. Grid independence and time independence tests were performed to select appropriate mesh and time step sizes for the simulations. Results show the energy stored by each PCM and compare their melting performances.
การนำเสนอบทความวิชาการในการประชุมวิชาการวิศวกรรมโยธาแห่งชาติ ครั้งที่ 25
ระหว่างวันที่ 15-17 กรกฎาคม 2563 ในรูปแบบออนไลน์ จังหวัดชลบุรี
หัวข้อ Impacts of Future Climate Change on Inflow to Pasak Jolasid Dam
in Pasak River Basin, Thailand
Optimization of performance and emission characteristics of dual flow diesel ...eSAT Journals
Abstract
Depleting sources of fossil fuels coupled with after effects of exhaust gases on environment i.e. global warming and climate change has necessitated the need for development and use of alternate biodegradable fuels. In this present study optimization of performance and emission characteristics has been carried out using dual flow of CNG and Diesel with varying EGR under varying load by Taguchi method. Optimum values of output response parameters have been calculated with the help of regression equation and influence of various factors on output response has carried out with the help of analysis of variance.
Keywords: Taguchi method, CNG, EGR, biodegradable fuels
On assessing the accuracy of offshore wind turbine reliability based designabelkrusnik02
This document discusses assessing the accuracy of design loads derived using the environmental contour method for offshore wind turbines. It compares design loads from this method to exact solutions using full integration over the failure domain. The environmental contour method makes two key assumptions that are often violated: 1) the limit state surface is well approximated by a tangent hyperplane at the design point, and 2) only a single failure mode is considered. This can introduce errors since wind turbine failure can occur under different operating conditions. The document examines these sources of error using an offshore wind turbine located at two Danish sites, Rødsand and Horns Rev, and their differing environmental conditions.
Validation of Results of Analytical Calculation of Steady State Heat Transfer...IRJET Journal
The document summarizes the analytical calculation and ANSYS simulation of steady state heat transfer in a nuclear fuel element. It presents the analytical solution to the heat conduction equations and plots the temperature profile. The simulation results for temperature, heat flux, and thermal gradient contours along with their corresponding graphs are also presented. Comparison shows that the analytical and simulation results match, validating the analytical model. Observation of boundary effects on axial thermal properties is also noted.
This document analyzes the relationship between various environmental and human factors and sea level rise in Florida over a 30-year period using statistical time series analysis. It examines factors like CO2 emissions, methane emissions from rice production and livestock, average surface temperature, vehicle production and fuel consumption. It uses tests like Granger causality, vector autoregression and correlation analysis to determine the significance and causal relationships between these factors and sea level rise. The analysis finds several factors have a causal impact on sea level rise and each other, like CO2 emissions impacting temperature, methane emissions from rice impacting overall methane levels, and fuel consumption impacting temperature, vehicle production and sea level rise.
Fundamental Aspects of Droplet Combustion ModellingIJERA Editor
This document summarizes research on modeling liquid droplet combustion. It first describes developing a model that solves transient energy and species equations to simulate an isolated, spherically symmetric single-component droplet burning over time. Results show the flame diameter initially increases then decreases and the flame to droplet ratio changes throughout burning unlike quasi-steady models. The model is extended to include forced convection effects. Emission profiles for species like CO, CO2, H2O and NO are also determined. Finally, the document discusses modeling multicomponent droplets, high-pressure combustion, and the governing equations involved.
IRJET- Experimental Evaluation of Shell & Tube Heat Exchanger with P – Toluid...IRJET Journal
The document describes an experimental study of a shell and tube heat exchanger using p-Toluidine as the phase change material (PCM). P-Toluidine has a melting temperature of 44°C and was selected as the PCM due to its suitable thermo-physical properties. Water was used as the working fluid flowing through the tubes. Experiments were conducted to evaluate the temperature differences in the shell and tube heat exchanger with variations in the mass flow rate. The results showed that the effectiveness was higher when the PCM was fully melted compared to during the melting process. Equations related to heat exchanger effectiveness, maximum possible heat transfer, and the number of transfer units were also presented.
SIMULATION OF VAPOR AND HEAT FLUXES OVER WET AND DRY REGIME IN PADDY FIELD EN...IAEME Publication
Alternating dry-wet paddy field management such as System of Rice Intensification
(SRI) had become an interesting subject in research and development in paddy
cultivation which also been subject for trial for its implementation. The field’s
environment’s variation of biophysical parameters related to production had also
become important to be studied. This study aims to simulate the variation of
evaporation and thermal condition over a wet and dry regime of paddy field. The
simulation model used in this study was a combination of numerical surface energy
balance and soil water flow model consisting two layered resistance energy balance
model for non-ponded field, one-dimensional atmospheric boundary layer model of
wind, temperature and vapor changes, and soil heat transfer and soil water flow
models. Meteorological parameters at the site were measured and utilized as input for
the simulation. The simulation shows the fluctuating latent, sensible and ground heat
flux and also the variation of temperature, and soil condition for wet and dry regime
of paddy field.
CFD investigation of coal gasification: Effect of particle sizeIRJET Journal
This document presents a computational fluid dynamics (CFD) investigation of the effect of coal particle size on coal gasification in a fluidized bed. The CFD model uses Eulerian-Eulerian two-fluid modeling approach with kinetic theory of granular flow to simulate gas-solid flow behavior. Simulations were performed with two particle sizes - 0.00062 m and 0.001 m - at fluidization velocities ranging from 0.16 to 1 m/s. The results show that smaller particle size leads to better solid distribution, easier generation of bubbles, and faster fluidization. At high velocities, particle size has little effect other than on bed height expansion. The study provides insights into how particle size impacts hydrodynamics in fluid
Impact of the Hydrographic Changing in the Open Drains Cross Sections on the ...IJMER
International Journal of Modern Engineering Research (IJMER) is Peer reviewed, online Journal. It serves as an international archival forum of scholarly research related to engineering and science education.
Double Diffusive Convection and the Improvement of Flow in Square Porous AnnulusIJERA Editor
There has been increased interest shown in recent years to investigate the behavior of heat and mass transfer in a square annulus with a porous medium fixed between the inner and outer walls. This paper aims to evaluate the Soret effect arising in the case of heat and mass transfer in a porous medium bounded by a square annulus and subjected to isothermal heating of the inner surfaces as well as the outer horizontal surfaces. The phenomenon is governed by 3 partial differential equations, the momentum, energy and concentration equations, that are coupled together and result in a situation where change in one variable affects the other equations and vice versa. The partial differential equations are converted into finite element equations with the help of the Galerkin method and then solved to predict solution variables such as temperature, stream function and concentration in the porous medium. It is found that the heat transfer rate at the hot wall decreases with increasing viscous dissipation effect in the porous medium.
This document summarizes a study on predicting the form factor of a ship hull through computational fluid dynamics simulations. Researchers conducted single-phase CFD simulations of flow around a Japanese Bulk Carrier hull model at various velocities within the Prohaska range. They evaluated mesh dependency, calculated friction coefficients compared to empirical data, and analyzed the effect of Reynolds number on predicted form factors. The study found that the form factor depends on ship velocity, contrary to Prohaska's theory, and suggests further investigation of scale effects on form factor predictions.
The document provides information about Prince George's County Public Schools' dual enrollment program, which allows high school students to take college courses for free. It outlines the eligibility requirements, enrollment process, key dates, and contact information. To enroll, students must have a minimum 2.5 GPA, be at least 16 years old, and meet the college admissions requirements. PGCPS will pay tuition and fees for qualified courses at Maryland public colleges. Interested students should meet with their counselor and submit a completed application packet by April 29th.
Do you quality for special enrollment period?Tax Garden
The open enrollment period under the Affordable Care Act officially closed on February 15th. Got questions? Need Help?
Feel free to reach us +1 855 615 1040
This document provides procedures for determining the density of soil cement base courses in place using a sand cone test. Key steps include: 1) calibrating the sand cone apparatus to determine the unit weight of sand; 2) excavating a hole and collecting soil samples on site; 3) filling the hole with pre-weighed sand to determine the volume; and 4) calculating dry density from the measured weight and volume. The dry density and moisture content are reported as test results. Care must be taken when excavating and measuring to obtain accurate volume and avoid disturbing surrounding material.
The objective of this lab is to measure and study density and specific gravity of different liquids by using hydrometer. This gives information how light or heavy a crude oil is.
Soil mechanics is the application of principles of mechanics and hydraulics to engineering problems dealing with settlement of foundations, slope stability of earth fills, and design of retaining structures, braced excavations, anchored bulkheads, cofferdams, etc. It involves identification and characterization of soils, laboratory and field testing of soils, evaluation of soil properties such as compressibility, shear strength, permeability, consolidation, etc. and design of foundations, retaining structures, earth structures, and other soil-structure interactions.
SAMPLE DATA TO SHOW THE SIZE OF COARSE AND FINE AGGREGATES. THIS REPORT IS FROM CONCRETE LAB OF UCE&T BZU MULTAN PAKISTAN. THE SAND USED HAS A FINENESS MODULUS OF .95.
The document discusses the benefits of exercise for mental health. Regular physical activity can help reduce anxiety and depression and improve mood and cognitive functioning. Exercise boosts blood flow, releases endorphins, and promotes changes in the brain which help regulate emotions and stress levels.
Specific Gravity, and API Gravity for petroleum productsMuhammad Akram
1) The document describes an experiment to determine the specific gravity and API gravity of kerosene and gasoline using two methods: the hydrometer method and pycnometer method.
2) The pycnometer method was found to be more accurate than the hydrometer method for measuring API and specific gravity, as the hydrometer can be affected by temperature, carbon dioxide, and alcohol content.
3) The API gravity value provides information about the quality and composition of petroleum products, with higher API gravity indicating a product contains more desirable and valuable components like gasoline.
The sand replacement test determines the in situ density of natural or compacted soils using sand pouring cylinders. The test involves excavating a soil sample, measuring its mass, and replacing the excavated volume with sand of a known density to find the sample volume. This allows calculating the dry density based on the sample mass and volume. The test establishes a relationship between dry density and moisture content. It is used to evaluate compaction levels in the field according to acceptance criteria for different depths.
Petroleum Properties - Density and relative densityStudent
1. The document describes an experiment to determine the density and API gravity of kerosin and gas oil samples using two methods: a hydrometer and a pycnometer.
2. The results found the API gravity of kerosin to be 48.53 using the hydrometer method but 35.56 using the pycnometer method, showing a difference between the methods.
3. The pycnometer method is considered more accurate as it is less affected by factors like temperature, bubbles, and alcohol content that influence the hydrometer readings.
Gases have no definite volume and assume the volume of any vessel. The behavior of gases is described by gas laws including Boyle's law, Charles' law, Avogadro's law, and the ideal gas law. Real gases deviate from ideal behavior at high pressures and low temperatures and are better described by equations like van der Waals. Key gas properties include gas formation volume factor, gas compressibility factor, gas viscosity, and gas solubility in oil. Gas formation volume factor relates the volume of gas at reservoir conditions to standard surface conditions.
This document describes the sieve analysis test of sand. The test involves sieving various sizes of sand particles through a series of sieves and calculating the percentage of sand retained on each sieve. This determines the particle size distribution. Well graded sand has a wide range of particle sizes, uniformly graded sand has similar sized particles, and gap graded sand is missing some sizes. The test procedure, equipment used, and results/conclusions are explained.
O 'Infórmate a Fondo' é o boletín trimestral do Fondo Galego. No IAF 141, número 10 da época dixital, poderás atopar toda a información sobre os últimos meses de vida da asociación municipalista, xunto a unha entrevista con Caxade.
This document lists the titles of past campaigns run by various organizations on different lifestyle channels and websites. It includes campaigns by Permanent TSB on running and cycling, Samsung on biking and triathlon, and the RSA on Dublin Bus' mobile app. The campaigns covered topics like active lifestyles, sports, and public transportation.
Natural Gas Compressibility Factor Correlation Evaluation for Niger Delta Gas...IOSR Journals
This document presents a new natural gas compressibility factor correlation developed specifically for Niger Delta gas fields in Nigeria. Laboratory PVT reports from 22 gas reservoirs in the Niger Delta were compiled into a database and used to evaluate existing compressibility factor correlations. A new correlation was then developed using the database. The performance of the new correlation was found to have the lowest standard error and absolute error compared to other evaluated correlations when calculating z-factors for different Niger Delta reservoir systems. Statistical analysis also showed the new correlation had the highest correlation coefficients and best matched experimental and other estimated z-factor values. It was concluded that the new developed correlation and that of Papay correlation are the most appropriate for calculating natural gas compressibility factors in Niger Delta gas fields
This document summarizes a study that performed a life assessment of a fighter jet engine annular combustor liner using a combined fluid/structural approach. Computational fluid dynamics analyses were conducted to obtain the thermal loading on the combustor liner from the combustion process. Finite element analyses were then performed to calculate the resulting temperature and stress/strain distributions in the liner. A method was developed to analyze a complete measured flight profile with limited computational effort. The creep and fatigue life for a measured flight were calculated and compared to field experience data. While the exact number of cycles to crack initiation was difficult to predict, the locations and directions of cracking correlated well with field data.
The document summarizes an experimental study that measured laminar burning velocities and Markstein numbers for mixtures of natural gas enriched with varying amounts of hydrogen. The study used a constant-volume combustion chamber equipped with thermocouples to measure flame propagation speeds. It found that adding hydrogen nonlinearly increased burning velocities at lean mixtures and decreased Markstein lengths, indicating greater flame instability. The results were compared to other studies and showed good agreement.
Biomass is considered as a potential source of energy production.Gasification can be employed to convert
dilute biomass energy source in to gaseous products holding concentrated form of energy. A steady state model for fluidized
bed biomass gasifier is developed based on reaction kinetics and hydrodynamic aspects of fluidization. The presence of
sorbent for absorption of carbon dioxide from the product gas is also incorporated in the model.The developed model
predicts the variation of syngas composition, temperature, pressure and velocity along the height of gasifier. Experiments
were carried out in a lab scale fluidized bed biomass gasifier and the results were used to validate the model.An increase of
50.35% in H2 mole fraction and a decrease of 50.88 % in CO2 mole fraction were observed when CaO was used as the
sorbent.
The document discusses advances in gas data acquisition systems and gas ratio analysis that enable more accurate interpretation of hydrocarbon zones from drilling mud gas returns. Key points:
- New constant volume degassers extract gas samples more representative of formation fluids, improving consistency. Improved detection also provides high-resolution analysis.
- Gas ratio analysis, comparing quantities of heavier and lighter hydrocarbon fractions, effectively identifies fluid types when validated data is carefully applied. Ratios like LH, LM, and HM have exceptional results determining reservoirs in Southeast Asia.
- Presenting basic gas data alongside ratios and variables affecting the data brings out features to characterize fluids and reach final judgments through cut-offs and comparisons. These advances enable more reliable real-
IJCER (www.ijceronline.com) International Journal of computational Engineerin...ijceronline
The document presents a numerical investigation of exhaust gas emissions from a dual fuel engine configuration using hydrogen and compressed natural gas (CNG). A simulation program was developed using MATLAB to calculate mole fractions of various exhaust species like NOx, CO, and CO2 based on input parameters like hydrogen fraction, equivalence ratio, combustion temperature and pressure. Simulations were conducted to analyze the effects of these parameters on emissions. Results showed that CO emissions increased with equivalence ratio and temperature due to incomplete combustion. CO2 emissions decreased with increasing hydrogen fraction and temperature due to dissociation.
This document summarizes a study evaluating correlations for calculating the compressibility factor of natural gases containing non-hydrocarbon components. It discusses how the compressibility factor is used to calculate important gas properties and outlines standard methods like correlations, equations of state, and laboratory measurements. The document focuses on evaluating correlations that account for components like nitrogen, carbon dioxide, and hydrogen sulfide which make predicting the compressibility factor more difficult compared to sweet gases containing only hydrocarbons. It also discusses how these non-hydrocarbon components can affect pseudo-critical temperature and pressure values used in correlations.
Applications of Differential Equations in Petroleum EngineeringRaboon Redar
In modern science and engineering, differential equations are very important. Nearly all known physics and chemistry laws are indeed differential equations. Engineers, in order to investigate systems behavior, it is virtually necessary that they are able to model and solve physical problems with mathematical equations.
The document discusses modeling turbulent premixed and partially premixed combustion. It notes that directly solving transport equations for all reactive species moments is impractical due to the large number of equations and closure terms required. Instead, models track the first two moments of one or two key scalars like mixture fraction and progress variable. The document reviews modeling approaches for lean premixed flames and describes the strained flamelet model and its extension to partially premixed flames. It discusses implementing the model in CFD codes and comparing results.
This document presents a novel approach to optimize oil production from an Iranian oil well considering asphaltene precipitation. The approach uses integrated thermodynamic modeling to develop a distribution profile of asphaltene precipitation in the well. It then investigates the impacts of hydrodynamic parameters on asphaltene precipitation through sensitivity analyses to optimize well completion and production conditions. The goal is to obviate issues from asphaltene deposition and maximize oil production and benefits. A particle swarm optimization algorithm is used to determine optimum tubing size, surface choke size, production rate, wellhead pressure and temperature that achieve high cumulative oil production and minimize asphaltene deposition thickness.
Regressions allow development of compressor cost estimation models print th...zhenhuarui
This article presents 10 regression models to estimate costs of different components for pipeline compressor stations with varying capacities in different US regions. The models show large cost differences between regions, with the Western region having the highest costs. The models also indicate that all compressor station cost components have economies of scale, with unit costs decreasing as capacity increases. Limitations of the models include uneven data distribution and missing variables.
This document provides a review of turbulent combustion modeling closures for large eddy simulations (LES), with a focus on models applicable to propulsion applications. It identifies three classes of models that can provide broad-based modeling: flamelet-library/presumed PDF models, linear eddy based (LEM) models, and transported PDF or filtered density function (FDF) based models. The document discusses the fundamental physical assumptions of these models, particularly regarding the presumed size of the turbulent scalar manifold. It also provides novel results from direct numerical simulations testing some assumptions using flames with detailed and reduced chemistry models.
This paper presents new correlations to calculate Modified Black-Oil (MBO) PVT properties for gas condensate and volatile oil fluids using readily available parameters without needing fluid samples or elaborate calculations. The correlations were developed using data from PVT experiments on 13 fluid samples and validated against material balance calculations and reservoir simulations. Correlations are presented for oil-gas ratio, solution gas-oil ratio, oil formation volume factor, and gas formation volume factor. The correlations showed good matches to experimental data with average errors ranging from 1-15% depending on the property.
232372441 correlation-and-prediction-of-vle-and-lle-by-empirical-eosJohn Barry
This document provides a summary of recent advances from 1980 to 1985 in the use of empirical equations of state for correlating and predicting fluid phase equilibria. It discusses developments in nonanalytical equations of state, virial-type equations of state, and van der Waals-type equations of state, with a focus on cubic equations of state. Key advances discussed include combining classical and nonclassical treatments in nonanalytical equations of state, generalizing parameters in virial equations to reduce input data needs, and improving temperature dependence and volume translations in cubic equations of state to better model vapor pressure and liquid volumes.
Iaetsd computer simulation of compression ignition engine through matlabIaetsd Iaetsd
This document discusses a computer simulation of a compression ignition engine using MATLAB. The simulation models the engine cycle in two zones - a burned zone and unburned zone. It uses a Wiebe function to determine the mass fraction burned and calculates parameters like pressure, temperature, heat release and emissions over the engine cycle. The simulation is first validated against experimental engine test data. Sensitivity studies are then conducted by varying combustion model constants to better understand their impact on predictions and combustion mechanisms. The simulation calculates performance parameters like brake power, fuel consumption and efficiencies over the engine's operating range. It aims to provide insights into combustion and pollutant formation at different loads and injection timings.
This document analyzes and compares the performance of gasoline direct injection (GDI) engines to port fuel injection (PFI) engines using a two-region thermodynamic model. The analysis examines parameters such as pressure, fuel consumption, and work produced during the compression and expansion phases. Key findings include:
1) GDI engines produce considerable work compared to PFI engines, despite higher fuel consumption.
2) A two-region thermodynamic model is used that divides the cylinder volume into burned and unburned regions to model combustion.
3) The analysis finds that while GDI engines have higher fuel utilization, they still generate significant work relative to PFI engines.
Analysis and Optimization of Reactant Column by using FEA ijiert bestjournal
This document discusses the analysis and optimization of a reactant column using finite element analysis. The reactant column is a vertical duct used in chemical processes to mix reactants at high pressure. It aims to optimize the location of holes at the bottom of the column to maximize structural safety. The project involves modeling the column in FEA software, applying expected pressures and temperatures, and analyzing stresses and deflections. The goal is to optimize the column thickness to ensure structural integrity while maintaining efficiency of the chemical process. Key steps include studying operating conditions, modeling the column, performing FEA, and optimizing thickness.
Computational Fluid Dynamics (CFD) Analysis of Natural Convection of Converge...IJERA Editor
Computational Fluid Dynamics (CFD) analysis was carried out for the convergent-divergent fins arranged inline and staggered on the base plate as per the experimental setup provided in the technical paper [1]. This paper reports on the validation of results of modeling and simulation in CFD. The simulation was carried out using the ANSYS 12.0 as the CFD modeling software. The main objective of the CFD analysis was to calculate the temperature distribution on the surface of the base plate and surface of the convergent-divergent fins for the given inline and staggered arrangement of fins due to the effect of natural convection heat transfer for different heat power inputs, and also to compare the CFD results with the experimental results.
2018 - CFD simulation of fluid dynamic and biokinetic processes within activa...WALEBUBLÉ
This document describes a CFD simulation of fluid dynamics and biokinetic processes within an activated sludge reactor (ASR) operating under intermittent aeration. The CFD model considers fluid dynamics, oxygen transfer, and biological processes described by Activated Sludge Model No. 1 (ASM1). The model is used to evaluate two different aeration system configurations for an ASR in terms of their ability to satisfy effluent requirements with minimum energy consumption. Results show that modifying the air diffuser layout can improve energy consumption by 2.8%, and reducing the air flow rate per diffuser improves energy consumption by 14.5%. The model provides insight into aeration inefficiencies within ASRs.
Similar to Efficient estimation of natural gas compressibility factor using (20)
Use PyCharm for remote debugging of WSL on a Windo cf5c162d672e4e58b4dde5d797...shadow0702a
This document serves as a comprehensive step-by-step guide on how to effectively use PyCharm for remote debugging of the Windows Subsystem for Linux (WSL) on a local Windows machine. It meticulously outlines several critical steps in the process, starting with the crucial task of enabling permissions, followed by the installation and configuration of WSL.
The guide then proceeds to explain how to set up the SSH service within the WSL environment, an integral part of the process. Alongside this, it also provides detailed instructions on how to modify the inbound rules of the Windows firewall to facilitate the process, ensuring that there are no connectivity issues that could potentially hinder the debugging process.
The document further emphasizes on the importance of checking the connection between the Windows and WSL environments, providing instructions on how to ensure that the connection is optimal and ready for remote debugging.
It also offers an in-depth guide on how to configure the WSL interpreter and files within the PyCharm environment. This is essential for ensuring that the debugging process is set up correctly and that the program can be run effectively within the WSL terminal.
Additionally, the document provides guidance on how to set up breakpoints for debugging, a fundamental aspect of the debugging process which allows the developer to stop the execution of their code at certain points and inspect their program at those stages.
Finally, the document concludes by providing a link to a reference blog. This blog offers additional information and guidance on configuring the remote Python interpreter in PyCharm, providing the reader with a well-rounded understanding of the process.
Rainfall intensity duration frequency curve statistical analysis and modeling...bijceesjournal
Using data from 41 years in Patna’ India’ the study’s goal is to analyze the trends of how often it rains on a weekly, seasonal, and annual basis (1981−2020). First, utilizing the intensity-duration-frequency (IDF) curve and the relationship by statistically analyzing rainfall’ the historical rainfall data set for Patna’ India’ during a 41 year period (1981−2020), was evaluated for its quality. Changes in the hydrologic cycle as a result of increased greenhouse gas emissions are expected to induce variations in the intensity, length, and frequency of precipitation events. One strategy to lessen vulnerability is to quantify probable changes and adapt to them. Techniques such as log-normal, normal, and Gumbel are used (EV-I). Distributions were created with durations of 1, 2, 3, 6, and 24 h and return times of 2, 5, 10, 25, and 100 years. There were also mathematical correlations discovered between rainfall and recurrence interval.
Findings: Based on findings, the Gumbel approach produced the highest intensity values, whereas the other approaches produced values that were close to each other. The data indicates that 461.9 mm of rain fell during the monsoon season’s 301st week. However, it was found that the 29th week had the greatest average rainfall, 92.6 mm. With 952.6 mm on average, the monsoon season saw the highest rainfall. Calculations revealed that the yearly rainfall averaged 1171.1 mm. Using Weibull’s method, the study was subsequently expanded to examine rainfall distribution at different recurrence intervals of 2, 5, 10, and 25 years. Rainfall and recurrence interval mathematical correlations were also developed. Further regression analysis revealed that short wave irrigation, wind direction, wind speed, pressure, relative humidity, and temperature all had a substantial influence on rainfall.
Originality and value: The results of the rainfall IDF curves can provide useful information to policymakers in making appropriate decisions in managing and minimizing floods in the study area.
Redefining brain tumor segmentation: a cutting-edge convolutional neural netw...IJECEIAES
Medical image analysis has witnessed significant advancements with deep learning techniques. In the domain of brain tumor segmentation, the ability to
precisely delineate tumor boundaries from magnetic resonance imaging (MRI)
scans holds profound implications for diagnosis. This study presents an ensemble convolutional neural network (CNN) with transfer learning, integrating
the state-of-the-art Deeplabv3+ architecture with the ResNet18 backbone. The
model is rigorously trained and evaluated, exhibiting remarkable performance
metrics, including an impressive global accuracy of 99.286%, a high-class accuracy of 82.191%, a mean intersection over union (IoU) of 79.900%, a weighted
IoU of 98.620%, and a Boundary F1 (BF) score of 83.303%. Notably, a detailed comparative analysis with existing methods showcases the superiority of
our proposed model. These findings underscore the model’s competence in precise brain tumor localization, underscoring its potential to revolutionize medical
image analysis and enhance healthcare outcomes. This research paves the way
for future exploration and optimization of advanced CNN models in medical
imaging, emphasizing addressing false positives and resource efficiency.
An improved modulation technique suitable for a three level flying capacitor ...IJECEIAES
This research paper introduces an innovative modulation technique for controlling a 3-level flying capacitor multilevel inverter (FCMLI), aiming to streamline the modulation process in contrast to conventional methods. The proposed
simplified modulation technique paves the way for more straightforward and
efficient control of multilevel inverters, enabling their widespread adoption and
integration into modern power electronic systems. Through the amalgamation of
sinusoidal pulse width modulation (SPWM) with a high-frequency square wave
pulse, this controlling technique attains energy equilibrium across the coupling
capacitor. The modulation scheme incorporates a simplified switching pattern
and a decreased count of voltage references, thereby simplifying the control
algorithm.
Introduction- e - waste – definition - sources of e-waste– hazardous substances in e-waste - effects of e-waste on environment and human health- need for e-waste management– e-waste handling rules - waste minimization techniques for managing e-waste – recycling of e-waste - disposal treatment methods of e- waste – mechanism of extraction of precious metal from leaching solution-global Scenario of E-waste – E-waste in India- case studies.
Design and optimization of ion propulsion dronebjmsejournal
Electric propulsion technology is widely used in many kinds of vehicles in recent years, and aircrafts are no exception. Technically, UAVs are electrically propelled but tend to produce a significant amount of noise and vibrations. Ion propulsion technology for drones is a potential solution to this problem. Ion propulsion technology is proven to be feasible in the earth’s atmosphere. The study presented in this article shows the design of EHD thrusters and power supply for ion propulsion drones along with performance optimization of high-voltage power supply for endurance in earth’s atmosphere.
Advanced control scheme of doubly fed induction generator for wind turbine us...IJECEIAES
This paper describes a speed control device for generating electrical energy on an electricity network based on the doubly fed induction generator (DFIG) used for wind power conversion systems. At first, a double-fed induction generator model was constructed. A control law is formulated to govern the flow of energy between the stator of a DFIG and the energy network using three types of controllers: proportional integral (PI), sliding mode controller (SMC) and second order sliding mode controller (SOSMC). Their different results in terms of power reference tracking, reaction to unexpected speed fluctuations, sensitivity to perturbations, and resilience against machine parameter alterations are compared. MATLAB/Simulink was used to conduct the simulations for the preceding study. Multiple simulations have shown very satisfying results, and the investigations demonstrate the efficacy and power-enhancing capabilities of the suggested control system.
Applications of artificial Intelligence in Mechanical Engineering.pdfAtif Razi
Historically, mechanical engineering has relied heavily on human expertise and empirical methods to solve complex problems. With the introduction of computer-aided design (CAD) and finite element analysis (FEA), the field took its first steps towards digitization. These tools allowed engineers to simulate and analyze mechanical systems with greater accuracy and efficiency. However, the sheer volume of data generated by modern engineering systems and the increasing complexity of these systems have necessitated more advanced analytical tools, paving the way for AI.
AI offers the capability to process vast amounts of data, identify patterns, and make predictions with a level of speed and accuracy unattainable by traditional methods. This has profound implications for mechanical engineering, enabling more efficient design processes, predictive maintenance strategies, and optimized manufacturing operations. AI-driven tools can learn from historical data, adapt to new information, and continuously improve their performance, making them invaluable in tackling the multifaceted challenges of modern mechanical engineering.
2008 BUILDING CONSTRUCTION Illustrated - Ching Chapter 02 The Building.pdf
Efficient estimation of natural gas compressibility factor using
1. Efficient estimation of natural gas compressibility factor using
a rigorous method
Amir Fayazi a
, Milad Arabloo a
, Amir H. Mohammadi b,c,*
a
Department of Petroleum Engineering, Petroleum University of Technology, Ahwaz, Iran
b
Institut de Recherche en Génie Chimique et Pétrolier (IRGCP), Paris Cedex, France
c
Thermodynamics Research Unit, School of Engineering, University of KwaZulu-Natal, Howard College Campus, King George V Avenue,
Durban 4041, South Africa
a r t i c l e i n f o
Article history:
Received 3 August 2013
Received in revised form
6 October 2013
Accepted 28 October 2013
Available online
Keywords:
Natural gas
Compressibility factor
Least square support vector machine
Sour gas
a b s t r a c t
The compressibility factor (Z-factor) of natural gases is necessary in many gas reservoir engineering
calculations. Accurate determination of this parameter is of crucial need and challenges a large number
of used simulators in petroleum engineering. Although numerous studies for prediction of gas
compressibility factor have been reported in the literature, the accurate prediction of this parameter has
been a topic of debate in the literature. For this purpose, a new soft computing approach namely, least
square support vector machine (LSSVM) modeling optimized with coupled simulated annealing opti-
mization technique is implemented. The model is developed and tested using a large database consisting
of more than 2200 samples of sour and sweet gas compositions. The developed model can predict the
natural gas compressibility factor as a function of the gas composition (mole percent of C1eC7þ, H2S, CO2,
and N2), molecular weight of the C7þ, pressure and temperature. The calculated Z-factor values by
developed intelligent model are also compared with predictions of other well-known empirical corre-
lations. Statistical error analysis shows that the developed LSSVM model outperforms all existing pre-
dictive models with average absolute relative error of 0.19% and correlation coefficient of 0.999. Results
from present study show that implementation of LSSVM can lead to more accurate and reliable esti-
mation of natural gas compressibility factor.
Ó 2013 Elsevier B.V. All rights reserved.
1. Introduction
The role of natural gas in meeting the world energy demand has
been increasing because of its abundance, versatility, and clean
burning (Wang and Economides, 2009). Natural gas often contains
some amounts of heavier hydrocarbon and non-hydrocarbon
components that contribute to its properties. It is important to
obtain accurate and reliable estimates of the physical properties of
natural gas for optimal exploitation and usage. In most upstream
and downstream petroleum and natural gas engineering calcula-
tions, the compressibility factor of natural gases are necessary to
gas metering, gas compression, design of pipelines and surface fa-
cilities (Azizi et al., 2010; Elsharkawy, 2004).
The common sources of Z-factor values are experimental
measurements, equations of state (EoS) and empirical correlations.
The most reliable and accurate way to obtain physical properties is
from accurate experimental measurements. These experiments are
expensive and time-consuming and it is impossible to measure
properties for all possible compositions of natural gases (Ahmed,
2001). However, when laboratory analyses are not available, it is
the task of empirical correlations and equations of state (EoS) to
estimate the petroleum fluid properties as a function of the reser-
voir’s readily available characteristics (Ahmed, 1989). Empirical
correlations, which are used to predict natural gas Z-factor, are
much easier and faster than equations of state. Sometimes these
correlations have comparable accuracy to equations of state
(Elsharkawy, 2004). In addition, equations of state (EoS) are more
complex than the empirical correlations, involving a large number
of parameters, which require more complicated and longer
computations.
The recent development and success of applying support vector
machine modeling to solve various difficult engineering problems
has drawn the attention to its potential applications in the petro-
leum industry (Arabloo et al., 2013; Farasat et al., 2013; Shokrollahi
et al., 2013). This study presents a new compositional model for
* Corresponding author. Institut de Recherche en Génie Chimique et Pétrolier
(IRGCP), Paris Cedex, France.
E-mail address: a.h.m@irgcp.fr (A.H. Mohammadi).
Contents lists available at ScienceDirect
Journal of Natural Gas Science and Engineering
journal homepage: www.elsevier.com/locate/jngse
1875-5100/$ e see front matter Ó 2013 Elsevier B.V. All rights reserved.
http://dx.doi.org/10.1016/j.jngse.2013.10.004
Journal of Natural Gas Science and Engineering 16 (2014) 8e17
2. estimation of gas compressibility factor based on support vector
machine modeling approach. A total of 2249 data points for a va-
riety of natural gases, covering lean, sweet to rich and acid or sour
gases (H2S, and CO2) are collected from open literature. The pro-
posed model efficiency is compared to five commonly used
empirical correlations (Beggs and Brill, 1973; Kumar, 2004;
Heidaryan et al., 2010; Azizi et al., 2010; Sanjari and Lay, 2012) and
several criteria are used to evaluate the developed model including
the coefficient of determination (R2
), average relative error (ARE),
average absolute relative error (AARE), and root mean square error
(RMSE).
In the following section, a review on some existing Z-factor
estimation techniques is presented. Then, backgrounds of the
proposed model and computation procedure are discussed in the
subsequent sections. Accuracy and validation of the proposed
models is checked later in Section 4. Subsequently, key findings of
the present work are presented in Section 5.
2. Natural gas compressibility factor
The ratio of the real volume to the ideal volume, which is a
measure of the amount the gas deviating from perfect behavior, is
called the compressibility factor. It is also called the gas deviation
factor and is denoted by the symbol Z. Gas properties such as gas
volume, density and viscosity can be estimated using the gas de-
viation factor.
The principle underlying development of all early correlations
for gas compressibility factor is the law of corresponding states that
originally proposed by van der Waals (1873). This law proposes that
all gases will exhibit the same behavior, e.g. Z-factor, when viewed
in terms of reduced pressure and reduced temperature. Mathe-
matically, this principle can be defined as:
Z ¼ f Tr; PrÞð (1)
By definition,
Pr ¼
P
Pc
(2)
Tr ¼
T
Pc
(3)
where Pc and Tc are critical pressure and critical temperature of
the gas, respectively. We should also note that only single-
component gases have distinct, single-valued critical pressures
and temperatures. We often observe a range of pressures over
which a natural gas mixture will liquefy at a given temperature
and a range of temperatures at which a liquid may exist at a given
pressure, so it is often very difficult to determine the exact critical
properties of a natural gas mixture (Calhoun, 1951). Conse-
quently, the petroleum industry has embraced use of pseudo-
critical properties as correlating parameters for natural gas
mixtures. The values of critical properties for gas mixtures can be
calculated via one of the mixing rules. Kay (1936), SBV (Stewart
et al., 1959), and SSBV (SBV modified by Sutton, 1985) are three
widely used mixing rules in the petroleum industry to calculate
pseudo critical properties of natural gases, if the composition of
the gas and the critical properties of the individual components
are known. Otherwise, the pseudo critical temperature and
pressure may be estimated using correlations based on gas spe-
cific gravity.
Therefore, the compressibility of a natural gas at a given pres-
sure and temperature can be obtained from the pseudo-reduced
pressure and temperature by using either the EoS or the
experimental chart. Particularly for natural hydrocarbon gases,
Standing and Katz (1942) and Katz et al. (1959) charts are standards
in oil and gas industry. Several attempts were made to fit the
Standing Katz chart mathematically (Dranchuk and Abou-Kassem,
1975; Hall and Iglesias-Silva, 2007; Heidaryan et al., 2010;
Londono et al., 2005). However, these charts were prepared for
binary mixtures of low molecular weight sweet gases.
2.1. Equations of state
Several forms of EoS have been presented to the petroleum in-
dustry to calculate hydrocarbon reservoir fluid properties. Volu-
metric behavior is calculated by solving the cubic equation, usually
expressed in terms of Z:
Z3
þ A1Z2
þ A2Z þ A3 ¼ 0 (4)
where constants A1, A2 and A3 are functions of pressure, temperature
and phase composition. The most widely used EoSs are: Soavee
RedlicheKwong (Soave, 1972) and Peng and Robinson (1976).
2.2. Empirical correlations
The lack of knowledge to calculate critical properties, acentric
factors of plus-fraction’s components and the binary interaction
parameters involved in equations of state calculations resulted in
utilization of empirical correlations which facilitated the com-
putations and seemed to be more user-friendly models. This
section presents a review of several widely used empirical
correlations.
2.2.1. Beggs and Brill (1973)
Beggs and Brill (1973) introduced an equation generated from
Standing and Katz (1942) Z-factor chart. This correlation is a func-
tion of pseudo-reduced pressure and temperature. Their proposed
equation is as follow:
Z ¼ A þ
À
1 À A
Á
exp
À
À B
Á
þ CPD
pr (5)
where
A ¼ 1:39
À
Tpr À 0:92
Á0:5
À 0:36Tpr À 0:101 (6)
B ¼
0:62 À 0:23Tpr
Ppr þ
0:066
Tpr À 0:86
À 0:037
P2
pr
þ
0:32
10ð9ðTprÀ1ÞÞ
P6
pr (7)
C ¼ 0:132 À 0:32logðTprÞ (8)
D ¼ 10ð0:3106À0:49Tprþ0:1824T2
prÞ (9)
This method is not suggested to be used for reduced tempera-
ture (Tpr) values less than 0.92.
2.2.2. Shell oil company
Kumar (2004) referenced the shell company model for estima-
tion of Z-factor as:
Z ¼ A þ BPpr þ
À
1 À A
Á
exp
À
À C
Á
À D
Ppr
10
4
(10)
A. Fayazi et al. / Journal of Natural Gas Science and Engineering 16 (2014) 8e17 9
3. where
A ¼ À0:101 À 0:36Tpr þ 1:3868
ffiffiffiffiffiffiffiffiffiffiffiffiffiffiffiffiffiffiffiffiffiffiffiffiffi
Tpr À 0:919
q
(11)
B ¼ 0:021 þ
0:04275
Tpr À 0:65
(12)
C ¼ Ppr E þ FPPr þ GP4
pr
(13)
D ¼ 0:122exp À 11:3 Tpr À 1
ÁÁÀÀ
(14)
E ¼ 0:6222 À 0:224Tpr (15)
F ¼
0:0657
Tpr À 0:85
À 0:037 (16)
G ¼ 0:32exp À 19:53 Tpr À 1
ÁÁÀÀ
(17)
2.2.3. Heidaryan et al. (2010)
Multiple regression analysis was carried out by Heidaryan et al.
(2010) to develop a correlation benefiting of 1220 data points in
range of 0:2 Ppr 15 and 1:2 Tpr 3. Their proposed correlation
for Z-Factor has 0.40% and 1.37% of absolute average error respec-
tively versus Standing and Katz (1942) chart and experimental data.
This correlation is given by:
Z ¼ ln
0
B
@
A1 þA3ln
À
Ppr
Á
þ A5
Tpr
þA7
À
lnPpr
Á2
þ A9
T2
pr
þA11
Tpr
ln
À
Ppr
Á
1þA2ln
À
Ppr
Á
þ A4
Tpr
þA6
À
lnPpr
Á2
þ A8
T2
pr
þA10
Tpr
ln
À
Ppr
Á
1
C
A (18)
2.2.4. Azizi et al. (2010)
In 2010, Azizi et al. (2010) developed a model based on linear
genetic programming approach to estimate the sweet gases
compressibility factor over the range of 0:2 Ppr 11 (217 Ppr
values) and 1:1 Tpr 2 (14 Tpr values) as:
Z ¼ A þ
B þ C
D þ E
(19)
where
A ¼ aT2:16
pr þ bP1:028
pr þ cP1:58
pr TÀ2:1
pr þ dln
À
Tpr
ÁÀ0:5
(20)
B ¼ e þ fT2:4
pr þ gP1:56
pr þ hP0:124
pr T3:033
pr (21)
C ¼ iln
À
Tpr
ÁÀ1:28
þ jln
À
Tpr
Á1:37
þ kln
À
Ppr
Á
þ lln
À
Ppr
Á2
þ mln
À
Ppr
Á
ln
À
Tpr
Á
(22)
D ¼ 1 þ nT5:55
pr þ oP0:68
pr T0:33
pr (23)
E ¼ pln
À
Tpr
Á1:18
þ qln
À
Tpr
Á2:1
þ rln
À
Ppr
Á
þ sln
À
Ppr
Á2
þ tln
À
Ppr
Á
ln
À
Tpr
Á
(24)
2.2.5. Sanjari and Lay (2012)
By using multiple regression analysis, Sanjari and Lay (2012)
developed an empirical correlation based on Virial equation of
state within the ranges of 1:01 Tpr 3 and 0:01 Ppr 15. It
divides the pressure region into two sections resulting two sets of
coefficients for 0:01 Ppr 3 and 3 Ppr 15. This model
(Eq. (25)) has two dependent variables (Tpr and Ppr) and 8 inde-
pendent variables (A1 À A8).
Z ¼ 1 þ A1Ppr þ A2P2
pr þ
A3PA4
pr
TA5
pr
þ
A6P
ðA4þ1Þ
pr
TA7
pr
þ
A8P
ðA4þ2Þ
pr
T
ðA7þ1Þ
pr
(25)
The application range of some empirical correlations is limited
to the experimental conditions for building the correlations and fail
badly close and beyond to their limits. Also, some correlations
require an iterative procedures to obtain the corresponding Z-fac-
tor, such as Dranchuk and Abou-Kassem (1975), and may even
present different results dependent on the initial guess for the
initial iteration.
Therefore, the main objective of this study is to present a reliable
predictive compositional model based on Least Squares Support
Vector Machine (LSSVM) (Suykens and Vandewalle, 1999)
modeling approach to predict gas compressibility factor without
the need for estimation of critical properties, acentric factors of
plus-fraction components, and the binary interaction parameters.
3. Support vector machine (SVM) model
3.1. Background
The SVM is a new and supervised machine learning technique
based on the statistical learning theory (Cortes and Vapnik, 1995;
Suykens and Vandewalle, 1999; Vapnik, 2000). It has been studied
extensively for both classification and regression analysis
(Amendolia et al., 2003; Baylar et al., 2009; Chen et al., 2011; Rafiee-
Taghanaki et al., 2013; Shokrollahi et al., 2013; Übeyli, 2010). The
SVM algorithm builds a separating hyper-surface in the input space.
This process is performed as follows (Amendolia et al., 2003;
Bazzani et al., 2001; Cortes and Vapnik, 1995; Suykens et al., 2002;
Suykens and Vandewalle, 1999):
1) It maps the input patterns into a higher dimensional feature
space through nonlinear mapping.
2) Builds a separating hyper-plane with maximum margin.
Consider a given training sampleððx1; y1Þ; ðx2; y2Þ; :::; ðxn; ynÞÞ
with input data xi˛Rn and output data yi˛R with class labels À1, 1
for classes 1 and 2, respectively. If this data sample is linearly
separable in the feature space, then the following regression model
can be constructed:
y ¼ wT
FðxÞ þ b (26)
where FðxÞ represents the nonlinear function that maps x into
n-dimensional feature space and performs linear regression; w and
b are weight vector and bias term, respectively. When the data of
the two classes are separable, one can say:
wT F
À
xk
Á
þ b ! þ1 if yk ¼ þ1
wT F
À
xk
Á
þ b À1 if yk ¼ À1
(27)
which is equivalent to:
yk
h
wT
FðxkÞ þ b
i
! þ1 k ¼ 1; 2; :::; N (28)
The extension of linear SVMs to non-separable case was also
made by Cortes and Vapnik (1995) in 1995. Basically, it is done by
introducing additional slack variables into Eq. (28) as follows:
A. Fayazi et al. / Journal of Natural Gas Science and Engineering 16 (2014) 8e1710
4. yk
h
wT
FðxkÞ þ b
i
! 1 À zk k ¼ 1; 2; :::; N (29)
zk ! 0 k ¼ 1; :::; N (30)
The generalized optimal separating hyper-plane is determined
by the vector w that minimizes the cost function:
Cost ðw; zÞ ¼
1
2
wT
w þ
C
2
XN
i ¼ 1
zp
i (31)
Subject to the constraints:
yk
h
wT
FðxkÞ þ b
i
! 1 À zk k ¼ 1; 2; :::; N (32)
where C is a positive real constant that determines the tradeoff
between the maximum margin and the minimum classification
error (Suykens et al., 2002; Suykens and Vandewalle, 1999; Übeyli,
2010). In the conventional SVM, optimal separating hyper-plane is
obtained by solving the above quadratic programming problem.
The solution to the optimization problem of Eq. (31) under the
constraints of Eq. (32) is given by the saddle point of the Lagrangian
(Minoux, 1986),
Jðw;b;a;z;bÞ ¼
1
2
wT
w þ
C
2
XN
i¼1
zi À
XN
i¼1
aiðyi
h
wT
FðxiÞ þ b
i
À 1 þ ziÞ
À
XN
i¼1
bizi
(33)
where a, b are the Lagrange multipliers. A modified version of SVM,
least square SVM (LSSVM), has been developed by Suykens and
Vandewalle (1999) for reducing the SVM model complexity and
its improvement. In LSSVM algorithm, solution is obtained by
solving a linear set of equations instead of solving a quadratic
programming problem involved by standard SVM (Suykens et al.,
2002; Suykens and Vandewalle, 1999).
In contrast to SVM, the LSSVM is trained by minimizing the cost
function which is defined as follow (Suykens and Vandewalle,
1999):
Qðw; zÞ ¼
1
2
wT
w þ
g
2
XN
i ¼ 1
z2
i (34)
Subject to the constraints (Suykens and Vandewalle, 1999):
yi
h
wT
FðxiÞ þ b
i
¼ 1 À zi i ¼ 1; 2; :::; N (35)
In the LSSVM, one works with equality instead of inequality
constraints. Therefore, the optimal solution can be obtained by
solving a set of linear equations instead of solving a quadratic
programming problem (Suykens and Vandewalle, 1999). To derive
the dual problem for LSSVM non-linear classification problem, the
Lagrange function is defined as:
L
À
w;b;z;a
Á
¼
1
2
wT
wþ
g
2
XN
i¼1
z2
i À
XN
i¼1
ai
n
yi
h
wT
F
À
xi
Á
þb
i
À1þzi
o
(36)
where ai values are Lagrange multipliers, which is positive or
negative due to LSSVM formulation. The conditions for optimality
of upper function yield (Suykens et al., 2002):
8
:
vL
vw ¼ 0 0 w ¼
PN
i¼1aiyiFðxiÞ
vL
vb
¼ 0 0
PN
i¼1aiyi ¼ 0
vL
vzi
¼ 0 0 ai ¼ gzi i ¼ 1; :::; N
vL
vai
¼ 0 0 yi
Â
wT F
À
xi
Á
þ b
Ã
¼ 1 À zi i ¼ 1; :::; N
(37)
By defining Y ¼ ½y1; :::; yNŠ, 1N ¼ ½1; :::; 1Š, z ¼ ½z1; :::; zNŠ,
a ¼ ½a1; :::; aNŠ and eliminating w and z, following KarusheKuhne
Trucker system is obtained (Suykens et al., 2002; Suykens and
Vandewalle, 1999):
0 1T
N
1N U þ gÀ1IN
!
b
a
!
¼
0
Y
!
(38)
where IN is an N Â N identity matrix, and U˛RNÂN is the kernel
matrix defined by:
Uij ¼ F xi F xj ¼ K xi; xj
ÁÀÁÀÁÀ
(39)
For LSSVM, there are many kernel function including linear, poly-
nomial, spline, radial basis function (RBF), sigmoid, etc. (Gunn,
1998; Muller et al., 2001). However, most widely used kernel
functions are RBF (Eq. (40)) and polynomial (Eq. (41)).
K
À
xi; xj
Á
¼ exp À
xi À xj
2
=s2
(40)
K
À
xi; xj
Á
¼
1 þ xT
i xj=c
d
(41)
where s2 is the squared variance of the Gaussian function and d is
the polynomial degree, which should be optimized by the user to
obtain the support vector.
Table 1
Statistical description of the data bank used for modeling.
Property Max. Min. Avg. SD
N2, mole % 20.00 0.00 2.39 5.03
CO2, mole % 40.16 0.00 3.04 7.14
H2S, mole % 22.60 0.00 1.57 4.47
C1, mole % 99.50 30.64 84.27 13.28
C2, mole % 35.33 0.00 5.78 7.22
C3, mole % 20.69 0.00 2.07 4.41
i-C4, mole % 5.87 0.00 0.25 0.75
n-C4, mole % 3.76 0.00 0.17 0.47
i-C5, mole % 0.91 0.00 0.08 0.17
n-C5, mole % 0.66 0.00 0.03 0.08
C6, mole % 1.09 0.00 0.07 0.14
C7þ, mole % 1.31 0.00 0.27 0.45
MW C7þ 236.71 0 80.95 93.62
Temperature, K 441.80 240.00 334.87 42.16
Pressure, MPa 118.89 0.66 37.88 31.95
Z-factor 2.1927 0.4230 1.0866 0.3354
Gas gravity 1.0817 0.5625 0.6753 0.0034
Table 2
Statistical quality measures of the developed LSSVM model to determine the
compressibility factor.
Statistical parameter Training
set
Validation
set
Test
set
Total
Coefficient of determination (R2
) 0.9999 0.9998 0.9997 0.9999
Average absolute relative error
(AARE %)
0.16 0.27 0.26 0.19
Root mean square error (RMSE) 0.0032 0.0052 0.0052 0.0039
Number of experimental data set 1574 337 338 2249
A. Fayazi et al. / Journal of Natural Gas Science and Engineering 16 (2014) 8e17 11
5. 3.2. Data collection
In order to perform the work plan explained in this study, a large
number of data for a variety of natural gases were collected from
open literature (Buxton and Campbell, 1967; Capla et al., 2002;
Chamorro et al., 2006; Li and Guo, 1991; Liu et al., 2013; May et al.,
2001; McElroy et al., 2001; McLeod, 1968; Satter and Campbell,
1963; Sun et al., 2012; Yan et al., 2013). These data contain prop-
erties of 2249 gases, covering lean, sweet to rich and acid or sour
gases (H2S and CO2). These measurements include gas composi-
tions (mole percent of C1eC7þ, H2S, CO2, and N2), molecular weight
and specific gravity of the C7þ, experimentally measured
compressibility factors, pressures and temperatures. A complete
statistical description of the data bank is reported in Table 1.
The database was first divided into three sets. The first part
known as training set is used for construction and training of the
model (70% of main data set). The second part namely validation set
is used for selecting optimal parameters of the LSSVM model and
also to avoid the over-fitting problems (15% of main data set). The
task of remaining data, i.e. test set, is to evaluate the capability of
proposed model for prediction of unused data within the model
development (Arabloo et al., 2013; Mohammadi et al., 2011). It
should be noted that the division of database into three mentioned
sections is performed randomly. The benefit of this kind of data
allocation is that in each subset there is enough representative data
for whole ranges of operating conditions.
3.3. Designing the LSSVM model
To build the LSSVM model for precise prediction of gas
compressibility factor, gas composition (mole percent of C1eC7þ,
H2S, CO2, and N2), molecular weight of C7þ, pressure and temper-
ature are assumed as the correlating variables as:
Z ¼ f
À
yi; MWC7þ
; P; T
Á
yi˛
È
yC1
; yC2
; :::; yC6
; yC7þ
; yH2S; yCO2
; yN2
É
(42)
The mean square error (MSE) between the developed model
results and corresponding experimental values, as defined by Eq.
(43), is considered as objective function during model computation.
MSE ¼
PN
j¼1
À
tj À oj
Á2
N
(43)
where t and o are target and estimated values, respectively.
0.4 0.6 0.8 1 1.2 1.4 1.6 1.8 2 2.2 2.4
−20
−15
−10
−5
0
5
10
15
20
Experimental Z−factor
(Zexp
−Zpred
)/Zexp
*100
Training
Validation
Test
Fig. 2. Relative errors of the gas compressibility factor values obtained by the developed model from experimental data base values.
Fig. 1. Comparison between the results of the developed LSSVM model and the
experimental data.
A. Fayazi et al. / Journal of Natural Gas Science and Engineering 16 (2014) 8e1712
6. 4. Results and discussion
4.1. Accuracy of the model
There are generally two parameters in LSSVM algorithm
including s2 and g, which are supposed to be optimized regarding
the specified problem (Farasat et al., 2013; Hemmati-Sarapardeh
et al., 2014; Rafiee-Taghanaki et al., 2013). The optimization pro-
cedure has been repeated several times as attempts to reach to the
global optimum of the problem. In this work, we have applied the
Coupled Simulated Annealing (CSA) optimization technique
(Xavier-de-Souza et al., 2010). The optimized values of the LSSVM
algorithm have been calculated as follows:
g ¼ 6:048046E þ 4
s2
¼ 8:647087E À 1
Table 2 indicates the statistical parameters of the developed
model including coefficient of determination (R2
), average absolute
relative error (AARE), and root mean square error (RMSE) for pre-
diction of compressibility factor.
The scatter diagram that compares developed model outputs
versus experimental values is shown in Fig.1. A tight cloud of points
about 45 line for training, validation and testing data sets indicate
the robustness of the proposed model.
Fig. 2 shows the relative error distribution for all experimental
data points. The results illustrate that excellent agreement exists
between the prediction of LSSVM model and the experimental
data. It would also be interesting to see the performance and ac-
curacy of the proposed model against existing correlations. For
this purpose, the data sets used to develop the LSSVM model were
utilized to evaluate the accuracy of the model against existing
correlations: Beggs and Brill (BB) (Beggs and Brill, 1973), Shell Oil
Company (S) (Kumar, 2004), HeidaryaneMoghadasieRahimi
0 0.5 1 1.5 2 2.5
0
0.5
1
1.5
2
2.5
Experimental Z−factor
PredictedZ−factor
Fig. 5. Comparison between the results of the HeidaryaneMoghadasieRahimi (HMR)
correlation and the experimental data.
0 0.5 1 1.5 2 2.5
0
0.5
1
1.5
2
2.5
Experimental Z−factor
PredictedZ−factor
Fig. 6. Comparison between the results of the AzizieBehbahanieIsazadeh (ABI) cor-
relation and the experimental data.
0 0.5 1 1.5 2 2.5
0
0.5
1
1.5
2
2.5
Experimental Z−factor
PredictedZ−factor
Fig. 4. Comparison between the results of the Shell Oil Company (S) correlation and
the experimental data.
0 0.5 1 1.5 2 2.5
0
0.5
1
1.5
2
2.5
Experimental Z−factor
PredictedZ−factor
Fig. 3. Comparison between the results of the Beggs and Brill (BB) correlation and the
experimental data.
A. Fayazi et al. / Journal of Natural Gas Science and Engineering 16 (2014) 8e17 13
7. (HMR) (Heidaryan et al., 2010), AzizieBehbahanieIsazadeh (ABI)
(Azizi et al., 2010), and Sanjari and Nemati Lay (SN) (Sanjari and
Lay, 2012).
Figs. 3e7 illustrate the predicted results applying the above-
mentioned correlations versus experimental values of Z-factor for
all of the 2249 data sets used for developing the LSSVM model.
These cross-plots show the degree of agreement between experi-
mentally measured data and the predicted values. As can be seen
from Figs. 1 and 3e7 the predictions of the Z-factor made by
developed LSSVM model yield the closest agreement with the
experimental data among the selected correlations.
Furthermore, statistical errors of the mentioned correlations as
well as our proposed model are reported in Tables 3 and 4. It is clear
that the developed compositional LSSVM model presented in this
study has the smallest average relative error (ARE), average abso-
lute relative error (AARE), root mean square error (RMSE), and the
highest coefficient of determination (R2
) for all types of natural
gases considered.
4.2. Validity of the model
To make sure that the proposed model is physically correct, its
validity should be checked (Chamkalani et al., 2013). For this pur-
pose, the experimental data and computed Z-factor values from
LSSVM model as well as other mentioned empirical correlations
versus pseudo-reduced pressure at constant pseudo-reduced
temperature for four different natural gas mixtures (see Table 5)
are presented in Fig. 8. Real gases may deviate negatively or posi-
tively from ideality, depending on the effect of the intermolecular
forces of the gas. As can be seen from Fig. 8, the model has suc-
cessfully captured the physical trend of changing the gas
compressibility factor versus pseudo-reduced pressure at constant
temperature.
4.3. Case study
The ability of the new method for calculating the gas
compressibility factor as a function of changing pressure has been
investigated for a gas sample (Zhou et al., 2006) that was not
employed during the process of model development. The compo-
sition of this sample is reported in Table 6.
Fig. 9 shows the comparison between the experimental and
predicted Z-factor (see Table 7) by all models considered in this
study for this gas sample. As shown in Fig. 9, the developed LSSVM
model is much more accurate than other empirical methods for
Table 4
Average absolute relative error of the developed LSSVM model compared with other predictive correlations.
Ref. Data points No. of gas
mixtures
P, MPa T, K MW AARE %
BB S HMR ABI SN LSSVM
(This study)
(Buxton and Campbell, 1967) 165 5 7.07e48.44 310.93e344.26 18.17e23.68 2.14 2.00 2.41 2.09 2.98 0.37
(Satter and Campbell, 1963) 105 5 7.07e48.44 311.54e344.87 18.11e20.86 2.60 2.60 2.04 4.02 3.64 0.08
(Li and Guo, 1991) 47 5 0.66e7.53 310.20e359.40 16.37e24.42 0.96 0.77 0.80 0.82 0.98 0.13
(Liu et al., 2013) 92 2 35.00e95.04 347.70e419.20 17.04e17.07 3.00 1.72 1.78 1.50 2.55 0.05
(Yan et al., 2013) 234 2 10.00e116.50 313.20e441.80 16.51e19.43 3.83 1.99 1.35 1.96 1.78 0.04
(Sun et al., 2012) 535 4 22.03e118.89 303.20e418.60 17.05e20.51 4.04 1.71 1.54 2.13 2.18 0.02
(McLeod, 1968) 597 25 3.45e48.44 266.48e366.48 17.12e26.72 3.22 2.70 3.99 3.58 5.36 0.4
(May et al., 2001) 87 5 0.94e10.18 278.30e313.16 17.92e21.85 5.43 3.80 5.20 5.03 5.92 0.18
(Capla et al., 2002) 84 3 0.99e15.02 253.15e323.15 16.31e17.84 2.44 1.57 2.22 2.18 3.44 0.35
(Chamorro et al., 2006) 242 2 0.90e20.07 240.00e400.07 17.24e18.43 5.48 6.31 5.64 5.63 3.77 0.12
(McElroy et al., 2001) 61 6 0.67e8.61 283.14e333.17 29.93e31.37 3.28 4.59 4.63 4.73 4.30 0.22
Total 2249 64 3.62 2.67 3.03 3.07 3.57 0.19
Table 5
Compositions of four natural gas mixtures used for validation.
Component Mole (%)
No. 1 No. 2 No. 3 No. 4
N2 0.52 0 0.52 5.84
CO2 1.31 0 20.16 0
H2S 5.7 19.7 0 0
C1 91.51 71.3 74.58 54.35
C2 0.84 9 4.74 16.32
C3 0.08 0 0 16.2
i-C4 0.02 0 0 5.87
n-C4 0.02 0 0 0
i-C5 0 0 0 0.91
n-C5 0 0 0 0
C6 0 0 0 0.18
Table 3
Statistical parameters for each Z-factor correlation versus experimental data.
Correlation ARE % AARE % RMSE R2
Beggs and Brill (1973) À1.02 3.61 0.055 0.970
Shell oil company (Kumar, 2004) À0.52 2.67 0.036 0.988
Heidaryan et al. (2010) 0.85 3.03 0.038 0.987
Azizi et al. (2010) 1.04 3.07 0.040 0.987
Sanjari and Lay (2012) 1.55 3.57 0.047 0.980
LSSVM (this study) À0.01 0.19 0.004 0.999
Fig. 7. Comparison between the results of the Sanjari and Nemati Lay (SN) correlation
and the experimental data.
A. Fayazi et al. / Journal of Natural Gas Science and Engineering 16 (2014) 8e1714
8. prediction of a natural gas stream containing non-hydrocarbon
components.
5. Conclusion
In this study, least square support vector machine technique as a
supervised learning method has been applied to predict Z-factor of
natural gases. Coupled simulated annealing (CSA) optimization was
used for determination of LSSVM hyper-parameters. To achieve the
0 1 2 3 4 5 6 7 8
0.7
0.75
0.8
0.85
0.9
0.95
Ppr
Z-factor
Experimental
Beggs and Brill
Shell oil company
Heidaryan et al.
Azizi et al.
Sanjari and Lay
LSSVM (This study)
1 2 3 4 5 6 7 8 9 10 11
0.7
0.75
0.8
0.85
0.9
0.95
1
1.05
1.1
1.15
Ppr
Z-factor
Experimental
Beggs and Brill
Shell oil company
Heidaryan et al.
Azizi et al.
Sanjari and Lay
LSSVM (This study)
1 2 3 4 5 6 7 8 9 10 11
0.7
0.75
0.8
0.85
0.9
0.95
1
1.05
1.1
1.15
1.2
Ppr
Z-factor
Experimental
Beggs and Brill
Shell oil company
Heidaryan et al.
Azizi et al.
Sanjari and Lay
LSSVM (This study)
0 1 2 3 4 5 6 7 8
0.5
0.55
0.6
0.65
0.7
0.75
0.8
0.85
0.9
0.95
1
Ppr
Z-factor
Experimental
Beggs and Brill
Shell oil company
Heidaryan et al.
Azizi et al.
Sanjari and Lay
LSSVM (This study)
(a) (b)
(d)(c)
Fig. 8. Trend plot of Z-factor vs. Ppr. (a): gas mixture 1 at Tpr ¼ 1.52; (b): gas mixture 2 at Tpr ¼ 1.59; (c): gas mixture 3 at Tpr ¼ 1.45; (d): gas mixture 4 at Tpr ¼ 1.28.
Table 6
Composition of the case studied gas sample.
Component Mole (%)
N2 2.031
CO2 0.403
C1 90.991
C2 2.949
C3 1.513
i-C4 0.755
n-C4 0.755
i-C5 0.299
n-C5 0.304
2 4 6 8 10 12 14 16 18 20
0.78
0.8
0.82
0.84
0.86
0.88
0.9
0.92
0.94
0.96
P(MPa)
Z-factor
Experimental
Beggs and Brill
Shell oil company
Heidaryan et al.
Azizi et al.
Sanjari and Lay
LSSVM (This study)
Fig. 9. Experimental and predicted compressibility factor for the gas sample.
A. Fayazi et al. / Journal of Natural Gas Science and Engineering 16 (2014) 8e17 15
9. research objectives, 2249 data sets covering wide range of experi-
mental conditions were gathered from open literature to construct
and test the model. The average absolute relative error (AARE) and
coefficient of determination (R2
) between the model predictions
and the relevant experimental data were found to be 0.19% and
0.999, respectively. Moreover, a comparison between predictions of
developed LSSVM model and other empirical correlations shows
that developed model is more reliable than other conventional
methods for predicting natural gas Z-factor. In addition, the validity
of the model was examined and the results indicate that the model
is capable of simulating the actual physical trend of the Z-factor as a
function of pseudo-reduced pressure and temperature. Results
from present study show that the proposed compositional LSSVM
model can be easily implemented in any reservoir simulation
software and provides superior accuracy and performance for gas
reservoir engineering calculations.
Appendix A. Statistical formulas
Coefficient of determination
R2
¼ 1 À
PN
i¼1
Zpred
i
À Zexp
i
2
PN
i¼1
Z
pred
i
À average
Z
exp
i
2
Average relative error ARE% ¼
100
N
XN
i¼1
Zpred
i
À Zexp
i
Zexp
i
!
Average absolute relative error
AARE% ¼
100
N
XN
i¼1
Z
pred
i
À Z
exp
i
Z
exp
i
!
Root mean square error ðRMSEÞ
RMSE ¼
0
B
@
PN
i¼1
Z
pred
i
À Z
exp
i
2
N
1
C
A
1
2
Nomenclature
AT transpose of matrix A
b bias term
d the polynomial degree
exp experimental
IN N Â N identity matrix
Kðxi; xjÞ Kernel function
L Lagrangian
MW C7þ molecular weight of heptane-plus fraction
Pc critical pressure
Ppr Pseudo-reduced pressure
Pr reduced pressure
pred predicted
Tc critical temperature
Tpr Pseudo-reduced temperature
Tr reduced temperature
w weight vector
ai Lagrange multipliers
F map from input space into feature space
g relative weight of the summation of the regression errors
s2 squared bandwidth
U Kernel matrix
z slack variable
References
Ahmed, T., 2001. Reservoir Engineering Handbook, second ed. Gulf Professional
Publishing Company, Houston, Texas, USA.
Ahmed, T.H., 1989. Hydrocarbon Phase Behavior. Gulf Publishing Company, Hous-
ton, TX.
Amendolia, S.R., et al., 2003. A comparative study of K-nearest neighbour, support
vector machine and multi-layer perceptron for Thalassemia screening. Che-
mometr. Intell. Lab. Syst. 69 (1e2), 13e20.
Arabloo, M., Shokrollahi, A., Gharagheizi, F., Mohammadi, A.H., 2013. Toward a
predictive model for estimating dew point pressure in gas condensate systems.
Fuel Process. Technol. 116 (0), 317e324.
Azizi, N., Behbahani, R., Isazadeh, M.A., 2010. An efficient correlation for calculating
compressibility factor of natural gases. J. Nat. Gas Chem. 19 (6), 642e645.
Baylar, A., Hanbay, D., Batan, M., 2009. Application of least square support vector
machines in the prediction of aeration performance of plunging overfall jets
from weirs. Expert Syst. Appl. 36 (4), 8368e8374.
Bazzani, A., et al., 2001. An SVM classifier to separate false signals from micro-
calcifications in digital mammograms. Phys. Med. Biol. 46 (6), 1651.
Beggs, D.H., Brill, J.P., 1973. A study of two-phase flow in inclined pipes. J. Petrol.
Technol. 25 (5), 607e617.
Buxton, T.S., Campbell, J.M., 1967. Compressibility factors for lean natural gase
carbon dioxide mixtures at high pressure. SPE J. 7 (1), 80e86.
Calhoun, J.C., 1951. Reservoir Fluids. University of Oklahoma Press, Norman, OK.
Capla, L., Buryan, P., Jedelský, J., Rottner, M., Linek, J., 2002. Isothermal pVT mea-
surements on gas hydrocarbon mixtures using a vibrating-tube apparatus.
J. Chem. Thermodyn. 34 (5), 657e667.
Chamkalani, A., Arabloo, M., Chamkalani, R., Zargari, M.H., Dehestani-Ardakani, M.R.,
Farzam, M., 2013. Soft computing method for prediction of CO2 corrosion in flow
lines based on neural network approach. Chem. Eng. Commun. 200, 731e747.
Chamorro, C.R., et al., 2006. Measurement of the (pressure, density, temperature)
relation of two (methane þ nitrogen) gas mixtures at temperatures between
240 and 400 K and pressures up to 20 MPa using an accurate single-sinker
densimeter. J. Chem. Thermodyn. 38 (7), 916e922.
Chen, T.-S., et al., 2011. A novel knowledge protection technique base on support
vector machine model for anti-classification. In: Zhu, M. (Ed.), Electrical Engi-
neering and Control. Lecture Notes in Electrical Engineering. Springer, Berlin
Heidelberg, pp. 517e524.
Cortes, C., Vapnik, V., 1995. Support-vector networks. Mach. Learn. 20 (3), 273e297.
Dranchuk, P.M., Abou-Kassem, J.H., 1975. Calculation of z factors for natural gases
using equations of state. J. Can. Petrol. Technol. 14 (3), 34e36.
Elsharkawy, A.M., 2004. Efficient methods for calculations of compressibility, den-
sity and viscosity of natural gases. Fluid Phase Equilibr. 218 (1), 1e13.
Farasat, A., Shokrollahi, A., Arabloo, M., Gharagheizi, F., Mohammadi, A.H., 2013.
Toward an intelligent approach for determination of saturation pressure of
crude oil. Fuel Process. Technol. 115, 201e214.
Gunn, S.R., 1998. Support Vector Machines for Classification and Regression. Uni-
versity of Southampton, Faculty of Engineering, Science and Mathematics
School of Electronics and Computer Science.
Table 7
Experimental data and results of LSSVM model and other studied correlations for the gas sample.
T, K P, MPa Experimental Z-factor Predicted Z-factor
BB S HMR ABI SN LSSVM (this study)
305.15 18.88 0.7937 0.7986 0.7903 0.8172 0.8131 0.8357 0.7952
15.94 0.7884 0.8017 0.7910 0.8086 0.8117 0.8235 0.7921
13.03 0.7979 0.8173 0.8049 0.8218 0.8230 0.8380 0.8035
10.79 0.8169 0.8379 0.8249 0.8431 0.8409 0.8551 0.8221
7.02 0.8680 0.8877 0.8754 0.8902 0.8864 0.8973 0.8681
3.72 0.9272 0.9413 0.9323 0.9380 0.9351 0.9436 0.9203
A. Fayazi et al. / Journal of Natural Gas Science and Engineering 16 (2014) 8e1716
10. Hall, K.R., Iglesias-Silva, G.A., 2007. Improved equations for the StandingeKatz ta-
bles. Hydrocarbon Process 86 (4), 107e110.
Heidaryan, E., Moghadasi, J., Rahimi, M., 2010. New correlations to predict natural
gas viscosity and compressibility factor. J. Petrol. Sci. Eng. 73 (1e2), 67e72.
Hemmati-Sarapardeh, A., et al., 2014. Reservoir oil viscosity determination using a
rigorous approach. Fuel 116, 39e48.
Katz, D.L., et al., 1959. Handbook of Natural Gas Engineering. McGraw-Hill Book
Company, New York City.
Kay, W., 1936. Gases and vapors at high temperature and pressure e density of
hydrocarbon. Indust. Eng. Chem. 28 (9), 1014e1019.
Kumar, N., 2004. Compressibility Factor for Natural and Sour Reservoir Gases by
Correlations and Cubic Equations of State. MS thesis. Texas Tech University,
Lubbock, Tex, USA.
Li, Q., Guo, T.-M., 1991. A study on the supercompressibility and compressibility
factors of natural gas mixtures. J. Petrol. Sci. Eng. 6 (3), 235e247.
Liu, H., et al., 2013. Phase behavior and compressibility factor of two China gas
condensate samples at pressures up to 95 MPa. Fluid Phase Equilibr. 337, 363e369.
Londono, F.E., Archer, R.A., Blasingame, T.A., 2005. Correlations for hydrocarbon-gas
viscosity and gas density-validation and correlation of behavior using a large-
scale database. SPE Reservoir Eval. Eng. 8 (6), 561e572.
May, E.F., Miller, R.C., Shan, Z., 2001. Densities and dew points of vapor mixtures of
methane þ propane and methane þ propane þ hexane using a dual-sinker
densimeter. J. Chem. Eng. Data 46 (5), 1160e1166.
McElroy, P.J., Fang, J., Williamson, C.J., 2001. Second and third virial coefficients for
(methane þ ethane þ carbon dioxide). J. Chem. Thermodyn. 33 (2), 155e163.
McLeod, W.R., 1968. Application of Molecular Refraction to the Principle of Corre-
sponding States. Ph.D. thesis. University of Oklahoma.
Minoux, M., 1986. Mathematical Programming: Theory and Algorithms. John Wiley
and Sons.
Mohammadi, A.H., et al., 2011. Gas hydrate phase equilibrium in porous media:
mathematical modeling and correlation. Indust. Eng. Chem. Res. 51 (2),1062e1072.
Muller, K.-R., Mika, S., Ratsch, G., Tsuda, K., Scholkopf, B., 2001. An introduction to
kernel-based learning algorithms. IEEE Trans. Neural Networks 12 (2), 181e201.
Peng, D.-Y., Robinson, D.B., 1976. A new two-constant equation of state. Indust. Eng.
Chem. Fundament. 15 (1), 59e64.
Rafiee-Taghanaki, S., et al., 2013. Implementation of SVM framework to estimate
PVT properties of reservoir oil. Fluid Phase Equilibr. 346 (0), 25e32.
Sanjari, E., Lay, E.N., 2012. An accurate empirical correlation for predicting natural
gas compressibility factors. J. Nat. Gas Chem. 21 (2), 184e188.
Satter, A., Campbell, J.M., 1963. Non-ideal behavior of gases and their mixtures. SPE
J. 3 (4), 333e347.
Shokrollahi, A., Arabloo, M., Gharagheizi, F., Mohammadi, A.H., 2013. Intelligent
model for prediction of CO2 e reservoir oil minimum miscibility pressure. Fuel
112, 375e384.
Soave, G., 1972. Equilibrium constants from a modified RedlicheKwong equation of
state. Chem. Eng. Sci. 27 (6), 1197e1203.
Standing, M.B., Katz, D.L., 1942. Density of natural gases. Trans. AIME 146, 140e149.
Stewart, W.F., Burkhardt, S.F., Voo, D., 1959. Prediction of Pseudo Critical Parameters
for Mixtures, AIChE Meeting, Kansas City, MO.
Sun, C.-Y., et al., 2012. Experiments and modeling of volumetric properties and
phase behavior for condensate gas under ultra-high-pressure conditions.
Indust. Eng. Chem. Res. 51 (19), 6916e6925.
Sutton, R.P., 1985. Compressibility Factors for High-molecular-weight Reservoir
Gases, SPE Annual Technical Conference and Exhibition. Society of Petroleum
Engineers, Las Vegas, NV.
Suykens, J.A.K., Gestel, T.V., Brabanter, J.D., Moor, B.D., Vandewalle, J., 2002. Least
Squares Support Vector Machines. World Scientific Pub. Co., Singapore.
Suykens, J.A.K., Vandewalle, J., 1999. Least squares support vector machine classi-
fiers. Neural Process. Lett. 9 (3), 293e300.
Übeyli, E.D., 2010. Least squares support vector machine employing model-based
methods coefficients for analysis of EEG signals. Expert Syst. Appl. 37 (1),
233e239.
van der Waals, J.D., 1873. Continuity of the Gaseous and Liquid State of Matter. Ph.D.
dissertation thesis. University of Leiden.
Vapnik, V., 2000. The Nature of Statistical Learning Theory. Springer.
Wang, X., Economides, M., 2009. Advanced Natural Gas Engineering. Gulf Pub-
lishing Company, Houston, Texas, p. 400.
Xavier-de-Souza, S., Suykens, J.A.K., Vandewalle, J., Bolle, D., 2010. Coupled
simulated annealing. IEEE Trans. Syst. Man Cybernet. B: Cybernet. 40 (2),
320e335.
Yan, K.-L., et al., 2013. Measurement and calculation of gas compressibility factor for
condensate gas and natural gas under pressure up to 116 MPa. J. Chem. Ther-
modyn. 63, 38e43.
Zhou, J., et al., 2006. (p, Vm, T) and phase equilibrium measurements for a natural
gas-like mixture using an automated isochoric apparatus. J. Chem. Thermodyn.
38 (11), 1489e1494.
A. Fayazi et al. / Journal of Natural Gas Science and Engineering 16 (2014) 8e17 17