Sieve size analysis
•Download as DOCX, PDF•
4 likes•1,735 views
SAMPLE DATA TO SHOW THE SIZE OF COARSE AND FINE AGGREGATES. THIS REPORT IS FROM CONCRETE LAB OF UCE&T BZU MULTAN PAKISTAN. THE SAND USED HAS A FINENESS MODULUS OF .95.
Report
Share
Report
Share
Recommended
sampling and testing of aggregates
This document describes procedures for sieve analysis of aggregates. Sieve analysis involves passing aggregate samples through a series of sieves to determine the distribution of particle sizes. The key steps are:
1. Obtaining a representative sample and reducing it to the appropriate test size.
2. Separating the sample using sieves into coarse (>10 sieve) and fine (<10 sieve) fractions.
3. Weighing the material retained on each sieve to determine the particle size distribution, expressed as a percentage passing each sieve size.
Calibration of mechanical shakers used in the analysis is also described to ensure an adequate sieving time that retains less than 0.5% of material on any sieve during subsequent hand
Sieve analysis of coarse and fine aggregate - Report
1. The document summarizes a sieve analysis test performed on coarse and fine aggregates to determine particle size distribution.
2. Sieve analysis involves sieving aggregate samples using a series of sieves and weighing the material retained on each sieve to determine the percentage passing and retained.
3. The results showed that for coarse aggregate, 18% was retained on the 20mm sieve, 78% on the 10mm sieve, and 4% passed the 5mm sieve. For fine aggregate, 24% was retained on the 4.75mm sieve, and the percentage passing decreased through smaller sieves with 0.11% passing the 150μm sieve.
Astm designation c 136 for fine aggregates
This document describes a test method for determining the particle size distribution of fine aggregates through sieve analysis. The test involves drying a sample, sieving it using a nested set of sieves, weighing the material retained on each sieve, and calculating the percentages passing and retained to obtain the gradation. The results are used to determine compliance with specifications and provide data for controlling aggregate production and mixtures. The method is not applicable to materials finer than 75 microns.
Astm designation c 136 for coarse aggregates
Sieve Analysis for Coarse Aggregate as per ASTM. Slides contain all the relevant data and steps that would be required for the performance of sieve analysis of coarse aggregates.
Gradation of fine aggregate by sieve analysis
1. This document summarizes a student's laboratory experiment analyzing the gradation of fine aggregate through sieve analysis.
2. Sieve analysis involves separating a dried aggregate sample through a series of sieves to determine the particle size distribution, which is then compared to specifications.
3. The student's results found the fineness modulus of 3.35 for the tested aggregate sample, which is outside the specified range of 2.2-3.2, indicating the aggregate did not meet specifications.
Sieve analysis class task presentation By Engr. Syed Abdullah
This document presents the results of a sieve analysis test performed on soil samples from 4 locations at Comsat University. The test aimed to determine the grain size distribution of the samples. The procedure involved collecting, drying, and sieving the soil through a series of sieves. The mass of soil retained on each sieve was measured and used to construct a gradation curve. Based on the results, the soil was classified as a well-graded sandy loam, which has appropriate properties for gardening.
Sieving Final Report
1. Sieve analysis was performed on a sample of calcium carbonate to determine its particle size distribution. The sample was shaken in a mechanical shaker through a series of sieves with decreasing mesh sizes for different time intervals.
2. The mass of the sample retained on each sieve was measured and the cumulative percentage passing and particle size distribution curves were plotted.
3. The results showed that increasing the shaking time decreased the particle size, following a bell-shaped curve distribution rather than a direct proportional relationship between particle size and mass fraction.
Sieve analysis of fine aggregates student experiment
The document summarizes the results of a sieve analysis test performed on fine aggregates to determine particle size distribution. The test involved sieving 1000g of fine aggregate samples through a series of sieves and weighing the material retained on each sieve. This allowed calculating the percentage of material passing through each sieve. The distribution was found to be uneven, indicating the aggregates were not suitable for concrete mixing. The sieve analysis procedure and results are important for construction quality control and acceptance.
Sieve analysis test of sand (video version check https://www.youtube.com/watc...
Sieve analysis test of sand (video version check https://www.youtube.com/watc...John G. Luwalaga (P.E, A.M.ASCE, MEngCivil, MPH)
This document describes the sieve analysis test of sand. The test involves sieving various sizes of sand particles through a series of sieves and calculating the percentage of sand retained on each sieve. This determines the particle size distribution. Well graded sand has a wide range of particle sizes, uniformly graded sand has similar sized particles, and gap graded sand is missing some sizes. The test procedure, equipment used, and results/conclusions are explained.Sieve analysis test report
1. The objective of the experiment is to determine the grain size distribution of a soil sample using sieves and comparing the results to BS 410 standards.
2. The procedure involves sieving soil samples through a series of sieves with decreasing pore sizes, weighing the material retained on each sieve, and calculating the percentage retained and passing through each sieve.
3. The results show the weight and percentage retained and passing for each sieve size. A distribution curve is analyzed and compared to grading standards to evaluate the quality of the soil sample.
Kamal
This document summarizes procedures for sieve analysis, moisture content determination, and clay content determination for soils. Sieve analysis is used to assess particle size distribution and involves shaking a sample in a sieve stack with varying mesh sizes to separate particles by size. Moisture content is determined by drying a sample and measuring the weight loss. Clay content is measured by allowing particles to settle in water, with clay defined as particles finer than 20 microns that fail to settle within 10 minutes.
Aggregate impact and
1. The aggregate impact test determines a material's resistance to sudden shock or impact. Road stones must withstand pounding from traffic.
2. The test involves compacting aggregates between 10-12.5mm in a metal cylinder, subjecting it to 15 blows from a falling hammer, then sieving to determine the percentage passing a 2.36mm sieve.
3. The aggregate impact value is calculated as the percentage, by weight, of fines produced by the impact blows that pass through the 2.36mm sieve. A lower percentage indicates stronger aggregates that better resist impact.
Sieve analysis.pdf all
This document presents information on sieve analysis, which is used to determine the grain size distribution of soils. Sieve analysis involves shaking a stack of sieves with different sized meshes to separate soil particles. Coarser particles are analyzed using larger sieves while finer particles use smaller sieves. The procedure involves weighing each sieve and pan before and after to determine the mass of soil retained. From this, the percentage of soil passing and retained on each sieve can be calculated. The distribution of grain sizes affects important engineering properties of soils like classification.
Sieve test
This document summarizes a sieve test experiment conducted on fine aggregate to determine its grain size distribution. The experiment involved sieving 500g of dry fine aggregate through various sized sieves, weighing the material retained on each sieve, and calculating the percentage passing and retained. The results were plotted on a grading curve and compared to BS standards to evaluate the quality of the aggregate sample. In conclusion, the experiment was successfully performed and the fineness modulus calculated. The aggregate sample fell within the acceptable range specified by standards.
Grain size analysis
This document provides information on sieve analysis testing of soils based on IS 2720 Part 4. It discusses the objectives of classification of soils, coefficient of curvature, uniformity coefficient, and fineness modulus. Sieve analysis is used to determine gradation of soils, mix design proportions, and filter design. The test involves sieving soil samples through a series of sieves and weighing the material retained on each sieve. Calculations are made to determine coefficients and fineness modulus.
Aggregate impact and crushing test
This document describes procedures for three tests to assess the resistance of aggregates to mechanical degradation: the aggregate impact test, ten percent fines test, and aggregate crushing test. The tests involve placing aggregates in standardized molds and applying controlled impacts or loads to measure the amount of fines produced. The results indicate an aggregate's strength and suitability for uses like road bases that subject it to repeated mechanical stresses. Proper testing helps ensure aggregates meet specifications for withstanding wear in paving and quarrying equipment.
Introduction on aggregate impact testing machine ppt
This document describes an aggregate impact testing machine used to evaluate the toughness and resistance to fracture of road stones under repeated impacts. The machine consists of a metal base, cylindrical metal measure, tamping rod, and IS sieves. To test a sample, aggregates are dried, graded, placed in the measure, and compacted. The hammer is then raised and dropped 15 times from 380mm above the sample. The aggregate impact value is calculated as the percentage of material passing a 2.36mm sieve compared to the original dry weight. This test evaluates how well aggregates can withstand the pounding action of traffic loads on roads.
Aggregate impact value test experiment
The document describes an experiment to determine the aggregate impact value of a given specimen through a standardized test procedure. Three samples were tested by subjecting aggregates retained between 10mm and 12.5mm sieves to 15 blows from a falling hammer. The percentage of material passing a 2.36mm sieve was calculated to determine the aggregate impact value, with average values below 10 considered strong and above 35 too weak for construction. The tested samples had average impact values of 44.13%, indicating suitability for construction applications.
Mekanika Tanah - Sieve Analysis
The document discusses procedures for determining soil particle size distribution through sieve and hydrometer tests. It provides definitions of soil, outlines sieve and hydrometer test procedures, and discusses relevant concepts like soil texture classes and particle shape. Sample calculations are shown for a sieve test involving determining particle sizes retained on various sieves, calculating percentages, and deriving distribution and uniformity coefficients. Practice problems are also provided to calculate coefficients based on given particle size data.
Sieve analysis for Soil
This document provides information on mechanical analysis of soil, which involves determining the particle size distribution of soil through sieve analysis and hydrometer analysis. Sieve analysis involves shaking a soil sample through a nested set of sieves with progressively smaller openings to separate particles. Hydrometer analysis is used to determine the portion of soils smaller than 0.075mm. The document defines various soil particle sizes and provides an example of calculating particle size distribution, effective size, uniformity coefficient, and coefficient of gradation from sieve analysis results.
DCC3113 DETERMINATION OF AGGREGATE IMPACT VALUE.
This document summarizes a laboratory report on determining the aggregate impact value of samples according to Malaysian Public Works Department (JKR) standards. The experiment involved subjecting aggregate samples to impact blows using a test machine and sieve. The percentage of fines passing through a 2.36mm sieve was calculated to determine the aggregate impact value. Sample 1 had a 17% impact value and Sample 2 was 15%, both below the JKR requirement of 20%, indicating the aggregates have medium toughness and resistance to crushing. The results show the aggregates met the JKR specifications and the experiment was successfully conducted.
Marshall mix design method by ravindra c
The document describes the Marshall method of determining the optimum binder content for a bituminous mix design. Aggregates and binder are heated and mixed to different binder contents. Specimens are compacted with blows from a hammer and tested for properties like flow value, stability, and density. Graphs are made plotting these properties against the varying binder contents. The optimum binder content is determined as the percentage where the graphs show highest stability and density and lowest flow value.
Experiment no 02 crushing value
Objective :
Determine the aggregate crushing value of coarse aggregate
Assess suitability of coarse aggregates for use in different types of road
Understanding sieve analysis of sand
This document provides instructions for performing a sieve analysis test to determine the particle size distribution of fine aggregates or sand. The key steps include: 1) preparing a representative sample, 2) arranging sieves in order of decreasing size, 3) sieving the sample and weighing the material retained on each sieve, 4) calculating the percentage retained, cumulative percentage retained, and cumulative percentage passing through each sieve. The results are used to evaluate whether the sand is well graded or poorly graded and to calculate metrics like the uniformity coefficient.
Aggregate impact value test
This test determines the resistance of coarse aggregate to sudden shock or impact by filling a cup with aggregate, tamping and striking it, then sieving and calculating the percentage that breaks based on weights retained and passing specific sieves, with a lower percentage indicating greater resistance to impact.
Aggregate crushing strength test
This document summarizes a laboratory experiment conducted by civil engineering students at MUST to determine the crushing strength of a concrete aggregate sample. The experiment involved:
- Compacting an aggregate sample into a steel cylinder and subjecting it to a gradually increasing load in a compression testing machine according to British Standard 812.
- Sieving the crushed sample and calculating the aggregate crushing value (ACV) as the percentage of sample passing a 2.36mm sieve.
- The sample was found to have an ACV of 14.87%, indicating a "normal" quality aggregate suitable for use in road construction according to the standard.
Grain size analysis
Soil Tests:
Grain size analysis:
Sieves Analysis
introduction:
Apparatus:
Procedure:
Calculations
Objective
This document outlines a procedure to determine the aggregate impact value (AIV) of road construction aggregates. The AIV test involves compacting a sample of aggregates, subjecting it to 15 blows from a hammer, and calculating the percentage of fines generated that pass through a 2.36mm sieve. An AIV below 10% indicates an aggregate is exceptionally strong for road surfacing, while above 35% is too weak. The summarized experiment found an AIV of 15.82% for a tested sample, indicating it is sufficiently strong.
Ppt sieve analysis
This document discusses soil classification methods including sieve analysis and hydrometer analysis. Sieve analysis is used to determine the distribution of coarser soil particles by size, while hydrometer analysis determines the distribution of finer particles. The tests are used to classify soil type and evaluate properties like permeability, density and shear strength. Procedures are described for conducting the analyses, calculating relevant particle sizes and distribution, and classifying soils based on the unified soil classification system.
Sand replacement
The sand replacement test determines the in situ density of natural or compacted soils using sand pouring cylinders. The test involves excavating a soil sample, measuring its mass, and replacing the excavated volume with sand of a known density to find the sample volume. This allows calculating the dry density based on the sample mass and volume. The test establishes a relationship between dry density and moisture content. It is used to evaluate compaction levels in the field according to acceptance criteria for different depths.
More Related Content
What's hot
Sieve analysis test of sand (video version check https://www.youtube.com/watc...
Sieve analysis test of sand (video version check https://www.youtube.com/watc...John G. Luwalaga (P.E, A.M.ASCE, MEngCivil, MPH)
This document describes the sieve analysis test of sand. The test involves sieving various sizes of sand particles through a series of sieves and calculating the percentage of sand retained on each sieve. This determines the particle size distribution. Well graded sand has a wide range of particle sizes, uniformly graded sand has similar sized particles, and gap graded sand is missing some sizes. The test procedure, equipment used, and results/conclusions are explained.Sieve analysis test report
1. The objective of the experiment is to determine the grain size distribution of a soil sample using sieves and comparing the results to BS 410 standards.
2. The procedure involves sieving soil samples through a series of sieves with decreasing pore sizes, weighing the material retained on each sieve, and calculating the percentage retained and passing through each sieve.
3. The results show the weight and percentage retained and passing for each sieve size. A distribution curve is analyzed and compared to grading standards to evaluate the quality of the soil sample.
Kamal
This document summarizes procedures for sieve analysis, moisture content determination, and clay content determination for soils. Sieve analysis is used to assess particle size distribution and involves shaking a sample in a sieve stack with varying mesh sizes to separate particles by size. Moisture content is determined by drying a sample and measuring the weight loss. Clay content is measured by allowing particles to settle in water, with clay defined as particles finer than 20 microns that fail to settle within 10 minutes.
Aggregate impact and
1. The aggregate impact test determines a material's resistance to sudden shock or impact. Road stones must withstand pounding from traffic.
2. The test involves compacting aggregates between 10-12.5mm in a metal cylinder, subjecting it to 15 blows from a falling hammer, then sieving to determine the percentage passing a 2.36mm sieve.
3. The aggregate impact value is calculated as the percentage, by weight, of fines produced by the impact blows that pass through the 2.36mm sieve. A lower percentage indicates stronger aggregates that better resist impact.
Sieve analysis.pdf all
This document presents information on sieve analysis, which is used to determine the grain size distribution of soils. Sieve analysis involves shaking a stack of sieves with different sized meshes to separate soil particles. Coarser particles are analyzed using larger sieves while finer particles use smaller sieves. The procedure involves weighing each sieve and pan before and after to determine the mass of soil retained. From this, the percentage of soil passing and retained on each sieve can be calculated. The distribution of grain sizes affects important engineering properties of soils like classification.
Sieve test
This document summarizes a sieve test experiment conducted on fine aggregate to determine its grain size distribution. The experiment involved sieving 500g of dry fine aggregate through various sized sieves, weighing the material retained on each sieve, and calculating the percentage passing and retained. The results were plotted on a grading curve and compared to BS standards to evaluate the quality of the aggregate sample. In conclusion, the experiment was successfully performed and the fineness modulus calculated. The aggregate sample fell within the acceptable range specified by standards.
Grain size analysis
This document provides information on sieve analysis testing of soils based on IS 2720 Part 4. It discusses the objectives of classification of soils, coefficient of curvature, uniformity coefficient, and fineness modulus. Sieve analysis is used to determine gradation of soils, mix design proportions, and filter design. The test involves sieving soil samples through a series of sieves and weighing the material retained on each sieve. Calculations are made to determine coefficients and fineness modulus.
Aggregate impact and crushing test
This document describes procedures for three tests to assess the resistance of aggregates to mechanical degradation: the aggregate impact test, ten percent fines test, and aggregate crushing test. The tests involve placing aggregates in standardized molds and applying controlled impacts or loads to measure the amount of fines produced. The results indicate an aggregate's strength and suitability for uses like road bases that subject it to repeated mechanical stresses. Proper testing helps ensure aggregates meet specifications for withstanding wear in paving and quarrying equipment.
Introduction on aggregate impact testing machine ppt
This document describes an aggregate impact testing machine used to evaluate the toughness and resistance to fracture of road stones under repeated impacts. The machine consists of a metal base, cylindrical metal measure, tamping rod, and IS sieves. To test a sample, aggregates are dried, graded, placed in the measure, and compacted. The hammer is then raised and dropped 15 times from 380mm above the sample. The aggregate impact value is calculated as the percentage of material passing a 2.36mm sieve compared to the original dry weight. This test evaluates how well aggregates can withstand the pounding action of traffic loads on roads.
Aggregate impact value test experiment
The document describes an experiment to determine the aggregate impact value of a given specimen through a standardized test procedure. Three samples were tested by subjecting aggregates retained between 10mm and 12.5mm sieves to 15 blows from a falling hammer. The percentage of material passing a 2.36mm sieve was calculated to determine the aggregate impact value, with average values below 10 considered strong and above 35 too weak for construction. The tested samples had average impact values of 44.13%, indicating suitability for construction applications.
Mekanika Tanah - Sieve Analysis
The document discusses procedures for determining soil particle size distribution through sieve and hydrometer tests. It provides definitions of soil, outlines sieve and hydrometer test procedures, and discusses relevant concepts like soil texture classes and particle shape. Sample calculations are shown for a sieve test involving determining particle sizes retained on various sieves, calculating percentages, and deriving distribution and uniformity coefficients. Practice problems are also provided to calculate coefficients based on given particle size data.
Sieve analysis for Soil
This document provides information on mechanical analysis of soil, which involves determining the particle size distribution of soil through sieve analysis and hydrometer analysis. Sieve analysis involves shaking a soil sample through a nested set of sieves with progressively smaller openings to separate particles. Hydrometer analysis is used to determine the portion of soils smaller than 0.075mm. The document defines various soil particle sizes and provides an example of calculating particle size distribution, effective size, uniformity coefficient, and coefficient of gradation from sieve analysis results.
DCC3113 DETERMINATION OF AGGREGATE IMPACT VALUE.
This document summarizes a laboratory report on determining the aggregate impact value of samples according to Malaysian Public Works Department (JKR) standards. The experiment involved subjecting aggregate samples to impact blows using a test machine and sieve. The percentage of fines passing through a 2.36mm sieve was calculated to determine the aggregate impact value. Sample 1 had a 17% impact value and Sample 2 was 15%, both below the JKR requirement of 20%, indicating the aggregates have medium toughness and resistance to crushing. The results show the aggregates met the JKR specifications and the experiment was successfully conducted.
Marshall mix design method by ravindra c
The document describes the Marshall method of determining the optimum binder content for a bituminous mix design. Aggregates and binder are heated and mixed to different binder contents. Specimens are compacted with blows from a hammer and tested for properties like flow value, stability, and density. Graphs are made plotting these properties against the varying binder contents. The optimum binder content is determined as the percentage where the graphs show highest stability and density and lowest flow value.
Experiment no 02 crushing value
Objective :
Determine the aggregate crushing value of coarse aggregate
Assess suitability of coarse aggregates for use in different types of road
Understanding sieve analysis of sand
This document provides instructions for performing a sieve analysis test to determine the particle size distribution of fine aggregates or sand. The key steps include: 1) preparing a representative sample, 2) arranging sieves in order of decreasing size, 3) sieving the sample and weighing the material retained on each sieve, 4) calculating the percentage retained, cumulative percentage retained, and cumulative percentage passing through each sieve. The results are used to evaluate whether the sand is well graded or poorly graded and to calculate metrics like the uniformity coefficient.
Aggregate impact value test
This test determines the resistance of coarse aggregate to sudden shock or impact by filling a cup with aggregate, tamping and striking it, then sieving and calculating the percentage that breaks based on weights retained and passing specific sieves, with a lower percentage indicating greater resistance to impact.
Aggregate crushing strength test
This document summarizes a laboratory experiment conducted by civil engineering students at MUST to determine the crushing strength of a concrete aggregate sample. The experiment involved:
- Compacting an aggregate sample into a steel cylinder and subjecting it to a gradually increasing load in a compression testing machine according to British Standard 812.
- Sieving the crushed sample and calculating the aggregate crushing value (ACV) as the percentage of sample passing a 2.36mm sieve.
- The sample was found to have an ACV of 14.87%, indicating a "normal" quality aggregate suitable for use in road construction according to the standard.
Grain size analysis
Soil Tests:
Grain size analysis:
Sieves Analysis
introduction:
Apparatus:
Procedure:
Calculations
Objective
This document outlines a procedure to determine the aggregate impact value (AIV) of road construction aggregates. The AIV test involves compacting a sample of aggregates, subjecting it to 15 blows from a hammer, and calculating the percentage of fines generated that pass through a 2.36mm sieve. An AIV below 10% indicates an aggregate is exceptionally strong for road surfacing, while above 35% is too weak. The summarized experiment found an AIV of 15.82% for a tested sample, indicating it is sufficiently strong.
What's hot (20)
Sieve analysis test of sand (video version check https://www.youtube.com/watc...
Sieve analysis test of sand (video version check https://www.youtube.com/watc...
Introduction on aggregate impact testing machine ppt
Introduction on aggregate impact testing machine ppt
Viewers also liked
Ppt sieve analysis
This document discusses soil classification methods including sieve analysis and hydrometer analysis. Sieve analysis is used to determine the distribution of coarser soil particles by size, while hydrometer analysis determines the distribution of finer particles. The tests are used to classify soil type and evaluate properties like permeability, density and shear strength. Procedures are described for conducting the analyses, calculating relevant particle sizes and distribution, and classifying soils based on the unified soil classification system.
Sand replacement
The sand replacement test determines the in situ density of natural or compacted soils using sand pouring cylinders. The test involves excavating a soil sample, measuring its mass, and replacing the excavated volume with sand of a known density to find the sample volume. This allows calculating the dry density based on the sample mass and volume. The test establishes a relationship between dry density and moisture content. It is used to evaluate compaction levels in the field according to acceptance criteria for different depths.
C. sieve analysis & hydrometer analysis
Soil mechanics is the application of principles of mechanics and hydraulics to engineering problems dealing with settlement of foundations, slope stability of earth fills, and design of retaining structures, braced excavations, anchored bulkheads, cofferdams, etc. It involves identification and characterization of soils, laboratory and field testing of soils, evaluation of soil properties such as compressibility, shear strength, permeability, consolidation, etc. and design of foundations, retaining structures, earth structures, and other soil-structure interactions.
Proktor compaction
1) The Proctor compaction test is used to determine the optimal moisture content and maximum dry density of soil. It involves compacting soil in layers in a mold using controlled blows and measuring the dry density at different moisture contents.
2) The test procedure involves weighing equipment, sieving dry soil, compacting soil in layers using blows from a ram, weighing the compacted soil, determining moisture content, and repeating at different moisture contents.
3) A compaction curve is made by plotting dry density against moisture content. The peak of the curve indicates the optimum moisture content which produces the highest dry density.
Subgrade soil test, by Micotol
Sieve analysis
Atterberg limit test (liquid limit & Plastic limit)
Compaction test (Standard and modified proctor test)
California bearing ratio test (CBR)
BUILDING MATERIALS - SAND
Sand is a naturally occurring granular material composed of finely divided rock and mineral particles, with silica being the most common constituent. There are different types of sand sourced from pits, rivers, seas and dredging, with each having distinct properties that make them suitable for different construction applications like plastering, masonry or concreting. Proper testing and grading of sand ensures it meets the necessary quality standards for use in various building works.
Cube test REPORT - DCC2042
This test measures the compressive strength of concrete cubes made and cured according to specific standards. It provides a measure of quality control by testing one property, compressive strength, but results can vary depending on test conditions like specimen size and loading rate. The document outlines how to conduct compression tests on concrete cubes to determine if the concrete meets design specifications. Cubes are made, cured, weighed, and tested for compressive strength at various ages to see how strength develops over time. Detailed procedures are provided for casting, curing, operating the compression machine, and analyzing results.
Debojit sarker Research 2015
Use of MATLAB in identifying borehole log at a particular location of a site.
Effect of moisture content on CBR puncture resistance of Jute Geotextile.
Horizontal sieving machine
The document describes a project to design and construct a horizontal sieving machine. It includes an introduction describing sieving and its uses. It outlines the objectives, materials used, tools used in the methodology. It describes the working mechanism, provides photos from construction, and concludes that the project provided learning and was essential for the pharmacy department. It encountered some problems during construction but overall achieved learning objectives and completing the project.
Manufactured sand outlook 2014
This document discusses the benefits of manufactured sand as an alternative to river sand for construction. It notes that river sand mining is being banned due to shortage of supply and environmental impacts. Manufactured sand is produced artificially by crushing rocks and applying sizing and washing technologies. It can be used in concrete work, plastering, and infrastructure projects. Manufactured sand has benefits over river sand such as being cheaper, having better quality and grading control, and meeting construction specifications. It can provide greater durability, workability, and strength in construction projects while offering significant cost savings.
Aggregates
introduction
Classification Of Aggregates, Good Qualities of an Ideal Aggregate: ,Tests on Aggregate:- , Specıfıc gravıty of Aggregate. , Flakiness & Elongation Index , Fineness Modulus (f.m):
Presentation on robosand @ crit by raghavendra
One of the major adventures of civilization is construction .With the passing times in growth of population, today construction activity is at its peak .Even with the advancement of technology the quality of construction largely depends upon the ingredients used to construct any building. One such ingredient is sand, which is one of the most essential components to give shape to the dreams of the people. Natural sand has been the main source of fine aggregates, since man began to use concrete and masonry. The fact remains undisputed that the river sand that has been produced by rivers in natural processes has not increased for ages. Down the years, these river sand deposits have been exploited to the fullest extent. This indiscriminate exploitation causing almost an irreversible damage to the river system are leading to ecological damage, ground water depletion, water scarcity and fall in farm production. Above all, illegal quarrying and use of filter sand is nothing but playing with human lives. Most of the state governments of India are imposing environmental ban on the dredging operations and all sand quarrying operations in most of the areas. This leads to the development of another latest technology, alternative to the river sand –ROBOSAND
Particle technology lab report
Detailed working of each equipments, formulas and calculations. Easy to understand. Very helpful for those students who face difficulty in making lab reports
Fineness of fine aggregates perfect (1)
This document outlines a procedure to determine the particle size distribution of fine aggregates through sieving. The test aims to classify fine aggregates according to grading zones based on percentages retained on various sieve sizes. Fine aggregates are sieved through a series of sieves ranging from 4.75mm to 75μm. The weights retained on each sieve are recorded to calculate the cumulative percentage retained and fineness modulus. The results of this test can be used to inform concrete mix design based on the gradation characteristics of the fine aggregates.
STUDY ON PROPERTIES OF CONCRETE WITH MANUFACTURED SAND AS REPLACEMENT TO NAT...
In the present investigation work ability, strength and durability of concrete with manufactured sand as replacement to natural sand in proportions of 0%, 20%, 40%, 60% and 100% is studied. The experiments were conducted on M20 and M30 concrete grade with 450 specimens. Slump cone, compaction factor and vee-bee time tests were conducted to determine work ability. Results showed that as replacement of natural sand by manufactured sand is increased, there is a decrease in the work ability. Compressive strength, split tensile strength and flexural strength tests were conducted to determine strength of concrete. The 60% replacement showed an increase in strength of about 20% and other replacements to an order of minimum 0.93% in both the grades. The durability study is conducted by treating specimens for 30 days with 5% concentrated Hydro Chloric Acid and the concrete mix with 60% replacement has given good durable properties.
Test for sand
This document provides procedures for determining the density of soil cement base courses in place using a sand cone test. Key steps include: 1) calibrating the sand cone apparatus to determine the unit weight of sand; 2) excavating a hole and collecting soil samples on site; 3) filling the hole with pre-weighed sand to determine the volume; and 4) calculating dry density from the measured weight and volume. The dry density and moisture content are reported as test results. Care must be taken when excavating and measuring to obtain accurate volume and avoid disturbing surrounding material.
Bearing ratio capacity of compacted soil
This document describes the standard test method for determining the California Bearing Ratio (CBR) of laboratory-compacted soils. The CBR test measures the bearing capacity of a soil by penetrating a piston into a compacted soil sample and measuring the resistance. There are two main compaction methods - static and dynamic - and the document outlines the detailed procedures for compacting soil samples using each method and then soaking and testing the samples to determine the CBR value. The CBR test is used to evaluate the strength of materials like subgrade, subbase and base course materials for roads and airfields.
Cbr test
This document outlines the procedure for determining the California Bearing Ratio (CBR) of soils in a laboratory. The CBR is a measure of how much load a soil can support before failing. The procedure involves compacting soil specimens using static or dynamic methods, soaking them for 96 hours, and then penetrating the specimens with a piston at a rate of 1.25mm/min while measuring the load. The CBR is calculated based on the load-penetration curve and indicates the soil's strength and ability to support pavement structures.
Class 2 Grain Size Analysis ( Geotechnical Engineering )
This document provides an overview of grain size analysis methods for geotechnical engineering laboratory work at Texas Tech University. It discusses sieve analysis and hydrometer analysis, which are two common techniques used to determine the distribution of particle sizes in a soil sample. Sieve analysis is applicable to granular soils with little or no fines, while hydrometer analysis is used for soils with small grain sizes less than 0.075mm. The document reviews the procedures, calculations, and concepts involved in each analysis method, such as effective size, uniformity coefficient, and correction factors applied.
Viewers also liked (19)
STUDY ON PROPERTIES OF CONCRETE WITH MANUFACTURED SAND AS REPLACEMENT TO NAT...
STUDY ON PROPERTIES OF CONCRETE WITH MANUFACTURED SAND AS REPLACEMENT TO NAT...
Class 2 Grain Size Analysis ( Geotechnical Engineering )
Class 2 Grain Size Analysis ( Geotechnical Engineering )
Recently uploaded
22CYT12-Unit-V-E Waste and its Management.ppt
Introduction- e - waste – definition - sources of e-waste– hazardous substances in e-waste - effects of e-waste on environment and human health- need for e-waste management– e-waste handling rules - waste minimization techniques for managing e-waste – recycling of e-waste - disposal treatment methods of e- waste – mechanism of extraction of precious metal from leaching solution-global Scenario of E-waste – E-waste in India- case studies.
一比一原版(CalArts毕业证)加利福尼亚艺术学院毕业证如何办理
CalArts毕业证学历书【微信95270640】CalArts毕业证’圣力嘉学院毕业证《Q微信95270640》办理CalArts毕业证√文凭学历制作{CalArts文凭}购买学历学位证书本科硕士,CalArts毕业证学历学位证【实体公司】办毕业证、成绩单、学历认证、学位证、文凭认证、办留信网认证、(网上可查,实体公司,专业可靠)
(诚招代理)办理国外高校毕业证成绩单文凭学位证,真实使馆公证(留学回国人员证明)真实留信网认证国外学历学位认证雅思代考国外学校代申请名校保录开请假条改GPA改成绩ID卡
1.高仿业务:【本科硕士】毕业证,成绩单(GPA修改),学历认证(教育部认证),大学Offer,,ID,留信认证,使馆认证,雅思,语言证书等高仿类证书;
2.认证服务: 学历认证(教育部认证),大使馆认证(回国人员证明),留信认证(可查有编号证书),大学保录取,雅思保分成绩单。
3.技术服务:钢印水印烫金激光防伪凹凸版设计印刷激凸温感光标底纹镭射速度快。
办理加利福尼亚艺术学院加利福尼亚艺术学院毕业证文凭证书流程:
1客户提供办理信息:姓名生日专业学位毕业时间等(如信息不确定可以咨询顾问:我们有专业老师帮你查询);
2开始安排制作毕业证成绩单电子图;
3毕业证成绩单电子版做好以后发送给您确认;
4毕业证成绩单电子版您确认信息无误之后安排制作成品;
5成品做好拍照或者视频给您确认;
6快递给客户(国内顺丰国外DHLUPS等快读邮寄)
-办理真实使馆公证(即留学回国人员证明)
-办理各国各大学文凭(世界名校一对一专业服务,可全程监控跟踪进度)
-全套服务:毕业证成绩单真实使馆公证真实教育部认证。让您回国发展信心十足!
(详情请加一下 文凭顾问+微信:95270640)欢迎咨询!子小伍玩小伍比山娃小一岁虎头虎脑的很霸气父亲让山娃跟小伍去夏令营听课山娃很高兴夏令营就设在附近一所小学山娃发现那所小学比自己的学校更大更美操场上还铺有塑胶跑道呢里面很多小朋友一班一班的快快乐乐原来城里娃都藏这儿来了怪不得平时见不到他们山娃恍然大悟起来吹拉弹唱琴棋书画山娃都不懂却什么都想学山娃怨自己太笨什么都不会斟酌再三山娃终于选定了学美术当听说每月要交元时父亲犹豫了山娃也说爸算了吧咱学校一学期才转
IEEE Aerospace and Electronic Systems Society as a Graduate Student Member
IEEE Aerospace and Electronic Systems Society as a Graduate Student Member
Electric vehicle and photovoltaic advanced roles in enhancing the financial p...
Climate change's impact on the planet forced the United Nations and governments to promote green energies and electric transportation. The deployments of photovoltaic (PV) and electric vehicle (EV) systems gained stronger momentum due to their numerous advantages over fossil fuel types. The advantages go beyond sustainability to reach financial support and stability. The work in this paper introduces the hybrid system between PV and EV to support industrial and commercial plants. This paper covers the theoretical framework of the proposed hybrid system including the required equation to complete the cost analysis when PV and EV are present. In addition, the proposed design diagram which sets the priorities and requirements of the system is presented. The proposed approach allows setup to advance their power stability, especially during power outages. The presented information supports researchers and plant owners to complete the necessary analysis while promoting the deployment of clean energy. The result of a case study that represents a dairy milk farmer supports the theoretical works and highlights its advanced benefits to existing plants. The short return on investment of the proposed approach supports the paper's novelty approach for the sustainable electrical system. In addition, the proposed system allows for an isolated power setup without the need for a transmission line which enhances the safety of the electrical network
Comparative analysis between traditional aquaponics and reconstructed aquapon...
The aquaponic system of planting is a method that does not require soil usage. It is a method that only needs water, fish, lava rocks (a substitute for soil), and plants. Aquaponic systems are sustainable and environmentally friendly. Its use not only helps to plant in small spaces but also helps reduce artificial chemical use and minimizes excess water use, as aquaponics consumes 90% less water than soil-based gardening. The study applied a descriptive and experimental design to assess and compare conventional and reconstructed aquaponic methods for reproducing tomatoes. The researchers created an observation checklist to determine the significant factors of the study. The study aims to determine the significant difference between traditional aquaponics and reconstructed aquaponics systems propagating tomatoes in terms of height, weight, girth, and number of fruits. The reconstructed aquaponics system’s higher growth yield results in a much more nourished crop than the traditional aquaponics system. It is superior in its number of fruits, height, weight, and girth measurement. Moreover, the reconstructed aquaponics system is proven to eliminate all the hindrances present in the traditional aquaponics system, which are overcrowding of fish, algae growth, pest problems, contaminated water, and dead fish.
artificial intelligence and data science contents.pptx
What is artificial intelligence? Artificial intelligence is the ability of a computer or computer-controlled robot to perform tasks that are commonly associated with the intellectual processes characteristic of humans, such as the ability to reason.
› ...
Artificial intelligence (AI) | Definitio
学校原版美国波士顿大学毕业证学历学位证书原版一模一样
原版一模一样【微信:741003700 】【美国波士顿大学毕业证学历学位证书】【微信:741003700 】学位证,留信认证(真实可查,永久存档)offer、雅思、外壳等材料/诚信可靠,可直接看成品样本,帮您解决无法毕业带来的各种难题!外壳,原版制作,诚信可靠,可直接看成品样本。行业标杆!精益求精,诚心合作,真诚制作!多年品质 ,按需精细制作,24小时接单,全套进口原装设备。十五年致力于帮助留学生解决难题,包您满意。
本公司拥有海外各大学样板无数,能完美还原海外各大学 Bachelor Diploma degree, Master Degree Diploma
1:1完美还原海外各大学毕业材料上的工艺:水印,阴影底纹,钢印LOGO烫金烫银,LOGO烫金烫银复合重叠。文字图案浮雕、激光镭射、紫外荧光、温感、复印防伪等防伪工艺。材料咨询办理、认证咨询办理请加学历顾问Q/微741003700
留信网认证的作用:
1:该专业认证可证明留学生真实身份
2:同时对留学生所学专业登记给予评定
3:国家专业人才认证中心颁发入库证书
4:这个认证书并且可以归档倒地方
5:凡事获得留信网入网的信息将会逐步更新到个人身份内,将在公安局网内查询个人身份证信息后,同步读取人才网入库信息
6:个人职称评审加20分
7:个人信誉贷款加10分
8:在国家人才网主办的国家网络招聘大会中纳入资料,供国家高端企业选择人才
Advanced control scheme of doubly fed induction generator for wind turbine us...
This paper describes a speed control device for generating electrical energy on an electricity network based on the doubly fed induction generator (DFIG) used for wind power conversion systems. At first, a double-fed induction generator model was constructed. A control law is formulated to govern the flow of energy between the stator of a DFIG and the energy network using three types of controllers: proportional integral (PI), sliding mode controller (SMC) and second order sliding mode controller (SOSMC). Their different results in terms of power reference tracking, reaction to unexpected speed fluctuations, sensitivity to perturbations, and resilience against machine parameter alterations are compared. MATLAB/Simulink was used to conduct the simulations for the preceding study. Multiple simulations have shown very satisfying results, and the investigations demonstrate the efficacy and power-enhancing capabilities of the suggested control system.
Computational Engineering IITH Presentation
This Presentation will give you a brief idea about what Computational Engineering at IIT Hyderabad has to offer.
Rainfall intensity duration frequency curve statistical analysis and modeling...
Using data from 41 years in Patna’ India’ the study’s goal is to analyze the trends of how often it rains on a weekly, seasonal, and annual basis (1981−2020). First, utilizing the intensity-duration-frequency (IDF) curve and the relationship by statistically analyzing rainfall’ the historical rainfall data set for Patna’ India’ during a 41 year period (1981−2020), was evaluated for its quality. Changes in the hydrologic cycle as a result of increased greenhouse gas emissions are expected to induce variations in the intensity, length, and frequency of precipitation events. One strategy to lessen vulnerability is to quantify probable changes and adapt to them. Techniques such as log-normal, normal, and Gumbel are used (EV-I). Distributions were created with durations of 1, 2, 3, 6, and 24 h and return times of 2, 5, 10, 25, and 100 years. There were also mathematical correlations discovered between rainfall and recurrence interval.
Findings: Based on findings, the Gumbel approach produced the highest intensity values, whereas the other approaches produced values that were close to each other. The data indicates that 461.9 mm of rain fell during the monsoon season’s 301st week. However, it was found that the 29th week had the greatest average rainfall, 92.6 mm. With 952.6 mm on average, the monsoon season saw the highest rainfall. Calculations revealed that the yearly rainfall averaged 1171.1 mm. Using Weibull’s method, the study was subsequently expanded to examine rainfall distribution at different recurrence intervals of 2, 5, 10, and 25 years. Rainfall and recurrence interval mathematical correlations were also developed. Further regression analysis revealed that short wave irrigation, wind direction, wind speed, pressure, relative humidity, and temperature all had a substantial influence on rainfall.
Originality and value: The results of the rainfall IDF curves can provide useful information to policymakers in making appropriate decisions in managing and minimizing floods in the study area.
AI assisted telemedicine KIOSK for Rural India.pptx
It gives the overall description of SIH problem statement " AI assisted telemedicine KIOSK for Rural India".
Use PyCharm for remote debugging of WSL on a Windo cf5c162d672e4e58b4dde5d797...
This document serves as a comprehensive step-by-step guide on how to effectively use PyCharm for remote debugging of the Windows Subsystem for Linux (WSL) on a local Windows machine. It meticulously outlines several critical steps in the process, starting with the crucial task of enabling permissions, followed by the installation and configuration of WSL.
The guide then proceeds to explain how to set up the SSH service within the WSL environment, an integral part of the process. Alongside this, it also provides detailed instructions on how to modify the inbound rules of the Windows firewall to facilitate the process, ensuring that there are no connectivity issues that could potentially hinder the debugging process.
The document further emphasizes on the importance of checking the connection between the Windows and WSL environments, providing instructions on how to ensure that the connection is optimal and ready for remote debugging.
It also offers an in-depth guide on how to configure the WSL interpreter and files within the PyCharm environment. This is essential for ensuring that the debugging process is set up correctly and that the program can be run effectively within the WSL terminal.
Additionally, the document provides guidance on how to set up breakpoints for debugging, a fundamental aspect of the debugging process which allows the developer to stop the execution of their code at certain points and inspect their program at those stages.
Finally, the document concludes by providing a link to a reference blog. This blog offers additional information and guidance on configuring the remote Python interpreter in PyCharm, providing the reader with a well-rounded understanding of the process.
Recently uploaded (20)
IEEE Aerospace and Electronic Systems Society as a Graduate Student Member
IEEE Aerospace and Electronic Systems Society as a Graduate Student Member
Electric vehicle and photovoltaic advanced roles in enhancing the financial p...
Electric vehicle and photovoltaic advanced roles in enhancing the financial p...
Comparative analysis between traditional aquaponics and reconstructed aquapon...
Comparative analysis between traditional aquaponics and reconstructed aquapon...
Manufacturing Process of molasses based distillery ppt.pptx
Manufacturing Process of molasses based distillery ppt.pptx
artificial intelligence and data science contents.pptx
artificial intelligence and data science contents.pptx
Generative AI leverages algorithms to create various forms of content
Generative AI leverages algorithms to create various forms of content
Advanced control scheme of doubly fed induction generator for wind turbine us...
Advanced control scheme of doubly fed induction generator for wind turbine us...
Rainfall intensity duration frequency curve statistical analysis and modeling...
Rainfall intensity duration frequency curve statistical analysis and modeling...
AI assisted telemedicine KIOSK for Rural India.pptx
AI assisted telemedicine KIOSK for Rural India.pptx
Use PyCharm for remote debugging of WSL on a Windo cf5c162d672e4e58b4dde5d797...
Use PyCharm for remote debugging of WSL on a Windo cf5c162d672e4e58b4dde5d797...
Sieve size analysis
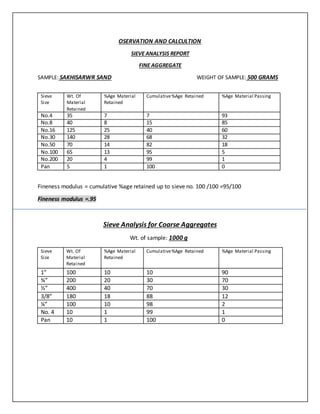
- 1. OSERVATION AND CALCULTION SIEVE ANALYSIS REPORT FINE AGGREGATE SAMPLE: SAKHISARWR SAND WEIGHT OF SAMPLE: 500 GRAMS Fineness modulus = cumulative %age retained up to sieve no. 100 /100 =95/100 Fineness modulus =.95 Sieve Analysis for Coarse Aggregates Wt. of sample: 1000 g Sieve Size Wt. Of Material Retained %Age Material Retained Cumulative%Age Retained %Age Material Passing 1” 100 10 10 90 ¾” 200 20 30 70 ½” 400 40 70 30 3/8” 180 18 88 12 ¼” 100 10 98 2 No. 4 10 1 99 1 Pan 10 1 100 0 Sieve Size Wt. Of Material Retained %Age Material Retained Cumulative%Age Retained %Age Material Passing No.4 35 7 7 93 No.8 40 8 15 85 No.16 125 25 40 60 No.30 140 28 68 32 No.50 70 14 82 18 No.100 65 13 95 5 No.200 20 4 99 1 Pan 5 1 100 0