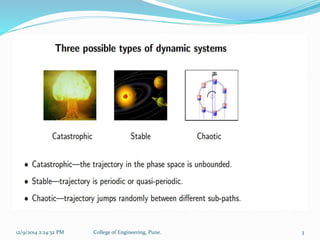
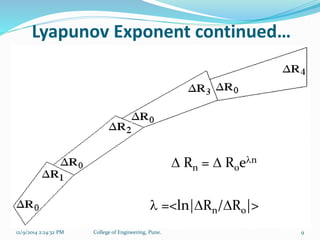
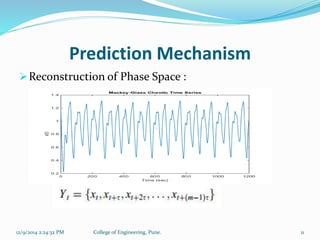
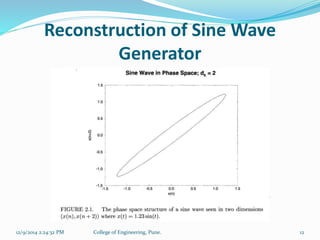
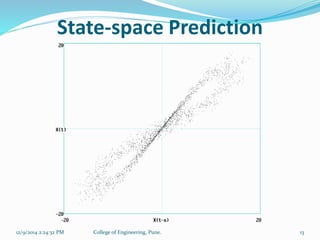
- By Mr. Suhel S. Mulla 
SY M. Tech (Digital System). 
MIS No. – 121333009. 
College of Engineering, Pune.
Time Series : 
A time series a sequence of data points, typically consisting 
of successive measurements made over a time interval. 
e.g. ocean tides, counts of sunspots, and the daily closing 
value of the Dow Jones Industrial Average. 
Dynamical System : 
A dynamical system is a concept in mathematics where a 
fixed rule describes how a point in a geometrical space 
depends on time. 
e.g. Mathematical models that describe the swinging of a 
clock pendulum, the flow of water in a pipe, and the 
number of fish each springtime in a lake. 
12/9/2014 2:24:32 PM College of Engineering, Pune. 2
12/9/2014 2:24:32 PM College of Engineering, Pune. 3
What is Chaos…?? 
In common usage, chaos means “a state of disorder” 
 Difference between chaotic and random signal. 
Chaos theory studies behavior of dynamical systems 
which are sensitive to initial conditions. 
Chaotic system can be analog or digital. In analog 
chaos, it is given by differential equation while in 
digital case, it is given by difference equation 
Chaotic systems are predictable for a while, then they 
appear to become random. 
12/9/2014 2:24:32 PM College of Engineering, Pune. 4
Continued…… 
 In Lorenz words : 
“Chaos is when present determines future, but 
approximate present determines approximate future.” 
 The approximate present information comes from even 
minute errors in measurement which are inevitable. 
Thus, correct measurement of chaotic system is not 
possible. 
 This makes the system forecast possible for small period of 
time. 
 The term used for prediction interval of chaotic system is 
called as Lyapunov Exponent. 
12/9/2014 2:24:32 PM College of Engineering, Pune. 5
Attractors 
An attractor is a set of numerical properties toward 
which a system tends to evolve, for a wide variety of 
starting conditions of the system. 
Types – 
1. Fixed Point 
2. Limit Cycle 
3. Limit Torous 
4. Strange Attractor. 
12/9/2014 2:24:32 PM College of Engineering, Pune. 6
Types of Attractors 
Fixed Point Limit Cycle 
Focus Node 
Torus Strange Attractor 
12/9/2014 2:24:32 PM College of Engineering, Pune. 7
Lyapunov Exponent 
 It is a quantity that characterizes the rate of 
separation of infinitesimally close trajectories. 
Quantitatively, two trajectories in phase space with 
initial separation δZ0 diverge at a rate given by 
where λ is the Lyapunov exponent. 
It determines a notion of predictability for a 
dynamical system. 
For the chaotic system it has to be between 0 and 1. 
12/9/2014 2:24:32 PM College of Engineering, Pune. 8
Lyapunov Exponent continued… 
 Rn =  R0en 
 =<ln|Rn/R0|> 
12/9/2014 2:24:32 PM College of Engineering, Pune. 9
Takens Theorem 
 It gives a notion through which complete system can be 
reconstructed from the observed time series. 
 The key point is that, though we are observing only one 
time series, it is made by all the state variables present in 
the system. 
 Thus, the history of time series can determine the nature of 
all the state variables in the system. 
 According to Taken’s theorem, an m-dimensional 
system requires (2m+1) delay co-ordinated graph of 
observed time series. 
 It tells us that we do not have to measure all the state space 
variables of the system for finding out the internal details 
of the system. 
12/9/2014 2:24:32 PM College of Engineering, Pune. 10
Prediction Mechanism 
Reconstruction of Phase Space : 
12/9/2014 2:24:32 PM College of Engineering, Pune. 11
Reconstruction of Sine Wave 
Generator 
12/9/2014 2:24:32 PM College of Engineering, Pune. 12
State-space Prediction 
12/9/2014 2:24:32 PM College of Engineering, Pune. 13
Determination of Delay time ‘τ’ 
Delay time can be calculated by finding 
autocorrelation function of the data and selecting ‘τ’ 
as its first zero crossing. 
 Small value of ‘τ’ gives the reconstructed delay 
graph approximately linear whereas large value of 
‘τ’ gives completely uncorrelated graph. 
 Along with all the methods, ‘τ’ can also be calculated 
by trial and error method, such results give satisfactory 
answers in some cases. 
12/9/2014 2:24:32 PM College of Engineering, Pune. 14
Embedding Dimensions ‘d’ 
 If the co-ordinated graph has less dimensions 
provided by Taken’s theorem, then the orbits overlap 
and a complex path crisis is created. 
 Sometimes the reconstructed graph with less 
dimensions than required may help, this occurs 
only when and n dimensional system can be uniquely 
represented in (n-m) dimensions. 
 If the system is reconstructed with less than required 
dimensions, overlap points occur as shown in the 
figure. 
12/9/2014 2:24:32 PM College of Engineering, Pune. 15
 Continued……………. 
The overlap in above figure can be removed by adding 
extra dimensions to the graph by means of new delay 
co-ordinates. 
 This process is repeated till all the overlaps are 
removed. 
12/9/2014 2:24:32 PM College of Engineering, Pune. 16
Correlation Dimension 
 It gives the dimensionality of the space occupied by a 
set of random points, often referred to as a type of fractal 
dimension. 
 It is a measure of the extent to which the presence of a data 
point affects the position of the other point lying on the 
attractor. 
 If correlation dimensions value is finite low and non-integer, 
the system is chaotic. 
 If correlation exponent increases without bound with 
increase in the embedding dimensions, the system is 
stochastic. 
12/9/2014 2:24:32 PM College of Engineering, Pune. 17
Largest Lyapunov Exponent Calculation & 
Prediction 
 After the correct reconstructed phase space plot is 
configured, Lyapunov exponent for each is 
calculated and the largest among them all is 
selected for future prediction. 
 The period limit on accurate prediction of a chaotic 
system is a function of largest Lyapunov Exponent. 
 To be chaotic, the largest Lyapunov exponent must 
be between zero and one. 
 If Lyapunov exponent is greater than one, the system 
is stochastic. 
12/9/2014 2:24:32 PM College of Engineering, Pune. 18
Algorithm : 
1. Start with unfolded attractor in m-dimensional space 
and time lag τ. 
2. Take the initial vector y(t1). 
3. Select the k nearest trajectories on the attractor. 
4. Afterwards select the respective k nearest points to 
y(t1), one on each trajectory. 
5. An average of all these trajectories is calculated 
6. The determined value is used to point next point on 
predicted trajectory. 
7. The predicted point is then set as a new starting 
vector and the process is repeated. 
12/9/2014 2:24:32 PM College of Engineering, Pune. 19
References 
 Arslan Basharat, Mubarak Shah, “Time Series 
Prediction by Chaotic Modeling of Nonlinear 
Dynamical Systems,” IEEE cpnference 2009. 
 Pengjian Shang, Xuewei Li, Santi Kamae, “Chaotic 
analysis of traffic time series,” IEEE conference 2004. 
H. D. I. Abarbanel, “Analysis of Observed Chaotic 
Data,” Springer, 1995. 
 Steven H. Strogatz, “Non-linear Dynamics and Chaos 
with applications to Physics, Biology, Chemistry and 
Engineering,” Westview Press. Perseus Publishing, 
2004. 
12/9/2014 2:24:32 PM College of Engineering, Pune. 20
Thank You….. 
12/9/2014 2:24:32 PM College of Engineering, Pune. 21

A Prediction Technique for Chaotic Time Series

  • 1.
    - By Mr.Suhel S. Mulla SY M. Tech (Digital System). MIS No. – 121333009. College of Engineering, Pune.
  • 2.
    Time Series : A time series a sequence of data points, typically consisting of successive measurements made over a time interval. e.g. ocean tides, counts of sunspots, and the daily closing value of the Dow Jones Industrial Average. Dynamical System : A dynamical system is a concept in mathematics where a fixed rule describes how a point in a geometrical space depends on time. e.g. Mathematical models that describe the swinging of a clock pendulum, the flow of water in a pipe, and the number of fish each springtime in a lake. 12/9/2014 2:24:32 PM College of Engineering, Pune. 2
  • 3.
    12/9/2014 2:24:32 PMCollege of Engineering, Pune. 3
  • 4.
    What is Chaos…?? In common usage, chaos means “a state of disorder”  Difference between chaotic and random signal. Chaos theory studies behavior of dynamical systems which are sensitive to initial conditions. Chaotic system can be analog or digital. In analog chaos, it is given by differential equation while in digital case, it is given by difference equation Chaotic systems are predictable for a while, then they appear to become random. 12/9/2014 2:24:32 PM College of Engineering, Pune. 4
  • 5.
    Continued……  InLorenz words : “Chaos is when present determines future, but approximate present determines approximate future.”  The approximate present information comes from even minute errors in measurement which are inevitable. Thus, correct measurement of chaotic system is not possible.  This makes the system forecast possible for small period of time.  The term used for prediction interval of chaotic system is called as Lyapunov Exponent. 12/9/2014 2:24:32 PM College of Engineering, Pune. 5
  • 6.
    Attractors An attractoris a set of numerical properties toward which a system tends to evolve, for a wide variety of starting conditions of the system. Types – 1. Fixed Point 2. Limit Cycle 3. Limit Torous 4. Strange Attractor. 12/9/2014 2:24:32 PM College of Engineering, Pune. 6
  • 7.
    Types of Attractors Fixed Point Limit Cycle Focus Node Torus Strange Attractor 12/9/2014 2:24:32 PM College of Engineering, Pune. 7
  • 8.
    Lyapunov Exponent It is a quantity that characterizes the rate of separation of infinitesimally close trajectories. Quantitatively, two trajectories in phase space with initial separation δZ0 diverge at a rate given by where λ is the Lyapunov exponent. It determines a notion of predictability for a dynamical system. For the chaotic system it has to be between 0 and 1. 12/9/2014 2:24:32 PM College of Engineering, Pune. 8
  • 9.
    Lyapunov Exponent continued…  Rn =  R0en  =<ln|Rn/R0|> 12/9/2014 2:24:32 PM College of Engineering, Pune. 9
  • 10.
    Takens Theorem It gives a notion through which complete system can be reconstructed from the observed time series.  The key point is that, though we are observing only one time series, it is made by all the state variables present in the system.  Thus, the history of time series can determine the nature of all the state variables in the system.  According to Taken’s theorem, an m-dimensional system requires (2m+1) delay co-ordinated graph of observed time series.  It tells us that we do not have to measure all the state space variables of the system for finding out the internal details of the system. 12/9/2014 2:24:32 PM College of Engineering, Pune. 10
  • 11.
    Prediction Mechanism Reconstructionof Phase Space : 12/9/2014 2:24:32 PM College of Engineering, Pune. 11
  • 12.
    Reconstruction of SineWave Generator 12/9/2014 2:24:32 PM College of Engineering, Pune. 12
  • 13.
    State-space Prediction 12/9/20142:24:32 PM College of Engineering, Pune. 13
  • 14.
    Determination of Delaytime ‘τ’ Delay time can be calculated by finding autocorrelation function of the data and selecting ‘τ’ as its first zero crossing.  Small value of ‘τ’ gives the reconstructed delay graph approximately linear whereas large value of ‘τ’ gives completely uncorrelated graph.  Along with all the methods, ‘τ’ can also be calculated by trial and error method, such results give satisfactory answers in some cases. 12/9/2014 2:24:32 PM College of Engineering, Pune. 14
  • 15.
    Embedding Dimensions ‘d’  If the co-ordinated graph has less dimensions provided by Taken’s theorem, then the orbits overlap and a complex path crisis is created.  Sometimes the reconstructed graph with less dimensions than required may help, this occurs only when and n dimensional system can be uniquely represented in (n-m) dimensions.  If the system is reconstructed with less than required dimensions, overlap points occur as shown in the figure. 12/9/2014 2:24:32 PM College of Engineering, Pune. 15
  • 16.
     Continued……………. Theoverlap in above figure can be removed by adding extra dimensions to the graph by means of new delay co-ordinates.  This process is repeated till all the overlaps are removed. 12/9/2014 2:24:32 PM College of Engineering, Pune. 16
  • 17.
    Correlation Dimension It gives the dimensionality of the space occupied by a set of random points, often referred to as a type of fractal dimension.  It is a measure of the extent to which the presence of a data point affects the position of the other point lying on the attractor.  If correlation dimensions value is finite low and non-integer, the system is chaotic.  If correlation exponent increases without bound with increase in the embedding dimensions, the system is stochastic. 12/9/2014 2:24:32 PM College of Engineering, Pune. 17
  • 18.
    Largest Lyapunov ExponentCalculation & Prediction  After the correct reconstructed phase space plot is configured, Lyapunov exponent for each is calculated and the largest among them all is selected for future prediction.  The period limit on accurate prediction of a chaotic system is a function of largest Lyapunov Exponent.  To be chaotic, the largest Lyapunov exponent must be between zero and one.  If Lyapunov exponent is greater than one, the system is stochastic. 12/9/2014 2:24:32 PM College of Engineering, Pune. 18
  • 19.
    Algorithm : 1.Start with unfolded attractor in m-dimensional space and time lag τ. 2. Take the initial vector y(t1). 3. Select the k nearest trajectories on the attractor. 4. Afterwards select the respective k nearest points to y(t1), one on each trajectory. 5. An average of all these trajectories is calculated 6. The determined value is used to point next point on predicted trajectory. 7. The predicted point is then set as a new starting vector and the process is repeated. 12/9/2014 2:24:32 PM College of Engineering, Pune. 19
  • 20.
    References  ArslanBasharat, Mubarak Shah, “Time Series Prediction by Chaotic Modeling of Nonlinear Dynamical Systems,” IEEE cpnference 2009.  Pengjian Shang, Xuewei Li, Santi Kamae, “Chaotic analysis of traffic time series,” IEEE conference 2004. H. D. I. Abarbanel, “Analysis of Observed Chaotic Data,” Springer, 1995.  Steven H. Strogatz, “Non-linear Dynamics and Chaos with applications to Physics, Biology, Chemistry and Engineering,” Westview Press. Perseus Publishing, 2004. 12/9/2014 2:24:32 PM College of Engineering, Pune. 20
  • 21.
    Thank You….. 12/9/20142:24:32 PM College of Engineering, Pune. 21

Editor's Notes