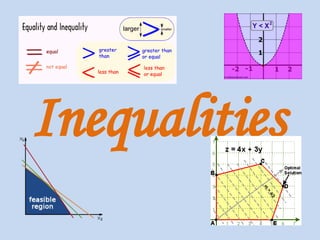
Introduction
• You willbe familiar with solving Inequalities from
GCSE maths and C1
• In this chapter you will see how to solve some more
complicated Inequalities
• You will also see how to avoid making a very common
error!
• You will see how to use diagrams to help identify the
correct regions for a question
Inequalities
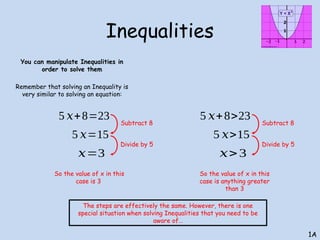
You can manipulateInequalities in
order to solve them
Remember that solving an Inequality is
very similar to solving an equation:
1A
5 𝑥+8=23 5 𝑥+8>23
5 𝑥=15 5 𝑥>15
𝑥=3 𝑥>3
Subtract 8
Divide by 5
Subtract 8
Divide by 5
So the value of x in this
case is 3
So the value of x in this
case is anything greater
than 3
The steps are effectively the same. However, there is one
special situation when solving Inequalities that you need to be
aware of…
5.
Inequalities
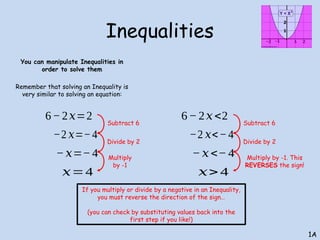
You can manipulateInequalities in
order to solve them
Remember that solving an Inequality is
very similar to solving an equation:
1A
6−2𝑥=2
−2 𝑥=−4
−𝑥=−4
Subtract 6
Divide by 2
If you multiply or divide by a negative in an Inequality,
you must reverse the direction of the sign…
(you can check by substituting values back into the
first step if you like!)
Multiply
by -1
𝑥=4
6−2𝑥<2
−2 𝑥<−4
−𝑥<−4
Subtract 6
Divide by 2
Multiply by -1. This
REVERSES the sign!
𝑥> 4
6.
Inequalities
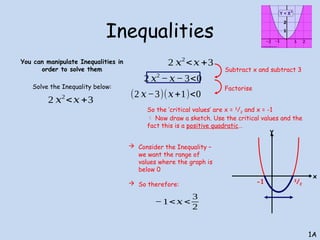
You can manipulateInequalities in
order to solve them
Solve the Inequality below:
1A
2 𝑥2
<𝑥+3
2 𝑥2
<𝑥+3
2 𝑥2
− 𝑥− 3<0
Subtract x and subtract 3
Factorise
(2 𝑥−3)(𝑥+1)<0
So the ‘critical values’ are x = 3
/2 and x = -1
Now draw a sketch. Use the critical values and the
fact this is a positive quadratic…
-1 3
/2
Consider the Inequality –
we want the range of
values where the graph is
below 0
So therefore:
−1<𝑥 <
3
2
x
y
7.
Inequalities
You can manipulateInequalities in order to solve
them
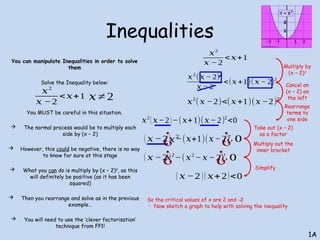
Solve the Inequality below:
You MUST be careful in this situation.
The normal process would be to multiply each
side by (x – 2)
However, this could be negative, there is no way
to know for sure at this stage
What you can do is multiply by (x – 2)2
, as this
will definitely be positive (as it has been
squared)
Then you rearrange and solve as in the previous
example…
You will need to use the ‘clever factorisation’
technique from FP1!
1A
𝑥2
𝑥 −2
<𝑥+1 𝑥 ≠ 2
𝑥2
𝑥 −2
<𝑥+1
𝑥2
(𝑥 − 2)2
𝑥 − 2
<(𝑥+1)(𝑥 − 2)
2
𝑥2
(𝑥 −2)<(𝑥+1)(𝑥−2)2
𝑥2
(𝑥−2)−(𝑥+1)(𝑥−2)2
<0
( 𝑥 −2)
¿ ¿
𝑥2
−(𝑥+1)(𝑥−2)
¿ 0
( 𝑥 −2)
𝑥2
−(𝑥2
− 𝑥− 2)
¿ ¿
¿ 0
( 𝑥 −2 )( 𝑥+2)<0
So the critical values of x are 2 and -2
Now sketch a graph to help with solving the inequality
Multiply by
(x – 2)2
Cancel an
(x – 2) on
the left
Rearrange
terms to
one side
Take out (x – 2)
as a factor
Multiply out the
inner bracket
Simplify
8.
Inequalities
You can manipulateInequalities in order to solve
them
Solve the Inequality below:
You MUST be careful in this situation.
The normal process would be to multiply each
side by (x – 2)
However, this could be negative, there is no way
to know for sure at this stage
What you can do is multiply by (x – 2)2
, as this
will definitely be positive (as it has been
squared)
Then you rearrange and solve as in the previous
example…
You will need to use the ‘clever factorisation’
technique from FP1!
1A
𝑥2
𝑥 −2
<𝑥+1 𝑥 ≠ 2
𝑥2
𝑥 −2
<𝑥+1
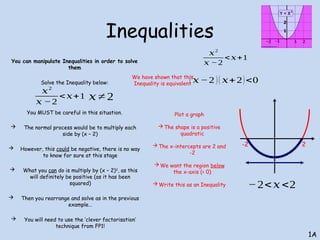
( 𝑥 −2 )( 𝑥+2)<0
We have shown that this
Inequality is equivalent
-2 2
Plot a graph
The shape is a positive
quadratic
The x-intercepts are 2 and
-2
We want the region below
the x-axis (< 0)
Write this as an Inequality −2<𝑥<2
9.
Inequalities
You can manipulateInequalities in order to
solve them
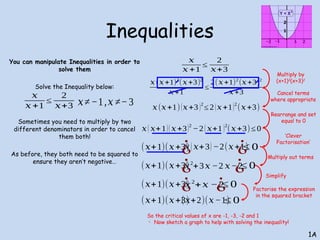
Solve the Inequality below:
Sometimes you need to multiply by two
different denominators in order to cancel
them both!
As before, they both need to be squared to
ensure they aren’t negative…
1A
𝑥
𝑥 +1
≤
2
𝑥+3 𝑥≠−1,𝑥 ≠−3
𝑥
𝑥 +1
≤
2
𝑥+3
𝑥(𝑥+1)2
(𝑥+3)2
𝑥+1
≤
2(𝑥+1)2
(𝑥+3)2
𝑥+3
𝑥(𝑥+1)(𝑥+3)2
≤ 2(𝑥+1)2
(𝑥+3)
𝑥( 𝑥+1)( 𝑥+3)2
−2( 𝑥+1)2
(𝑥+3)≤ 0
(𝑥+1)(𝑥+3)
𝑥(𝑥+3)−2(𝑥+1)
¿ ¿
≤ 0
(𝑥+1)(𝑥+3)
𝑥2
+3𝑥 −2 𝑥−2
¿ ¿
≤ 0
(𝑥+1)(𝑥+3)
𝑥2
+𝑥 −2
¿ ¿
≤ 0
(𝑥+1)(𝑥+3)
(𝑥+2)(𝑥−1)
≤ 0
So the critical values of x are -1, -3, -2 and 1
Now sketch a graph to help with solving the inequality!
Multiply by
(x+1)2
(x+3)2
Cancel terms
where appropriate
Rearrange and set
equal to 0
‘Clever
Factorisation’
Multiply out terms
Simplify
Factorise the expression
in the squared bracket
10.
Inequalities
You can manipulateInequalities in order to
solve them
Solve the Inequality below:
Sometimes you need to multiply by two
different denominators in order to cancel
them both!
As before, they both need to be squared to
ensure they aren’t negative…
1A
𝑥
𝑥 +1
≤
2
𝑥+3 𝑥≠−1,𝑥 ≠−3
𝑥
𝑥 +1
≤
2
𝑥+3
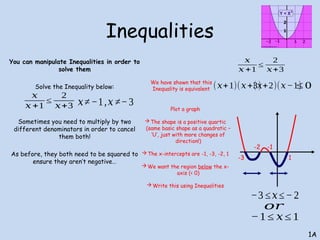
(𝑥+1)(𝑥+3)
(𝑥+2)(𝑥−1)
≤ 0
We have shown that this
Inequality is equivalent
Plot a graph
The shape is a positive quartic
(same basic shape as a quadratic –
‘U’, just with more changes of
direction!)
The x-intercepts are -1, -3, -2, 1
We want the region below the x-
axis (< 0)
Write this using Inequalities
-3
-2 -1
1
−3 ≤𝑥≤−2
−1≤ 𝑥≤ 1
𝑜𝑟
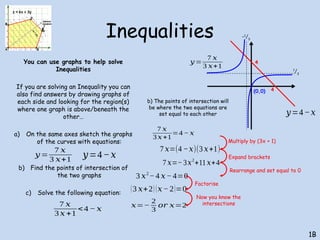
Inequalities
You can usegraphs to help solve
Inequalities
If you are solving an Inequality you can
also find answers by drawing graphs of
each side and looking for the region(s)
where one graph is above/beneath the
other…
a) On the same axes sketch the graphs
of the curves with equations:
b) Find the points of intersection of
the two graphs
c) Solve the following equation:
1B
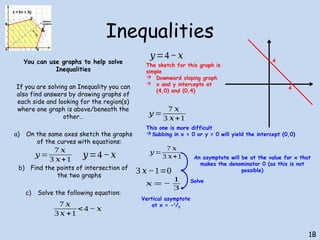
𝑦 =
7 𝑥
3 𝑥+1
𝑦=4−𝑥
7 𝑥
3 𝑥 +1
<4 − 𝑥
𝑦 =
7 𝑥
3 𝑥+1
𝑦=4−𝑥
The sketch for this graph is
simple
Downward sloping graph
x and y intercepts at
(4,0) and (0,4)
This one is more difficult
Subbing in x = 0 or y = 0 will yield the intercept (0,0)
𝑦 =
7 𝑥
3 𝑥+1
3 𝑥−1=0
𝑥=−
1
3
Vertical asymptote
at x = -1
/3
An asymptote will be at the value for x that
makes the denominator 0 (as this is not
possible)
Solve
4
4
13.
Inequalities
You can usegraphs to help solve
Inequalities
If you are solving an Inequality you can
also find answers by drawing graphs of
each side and looking for the region(s)
where one graph is above/beneath the
other…
a) On the same axes sketch the graphs
of the curves with equations:
b) Find the points of intersection of
the two graphs
c) Solve the following equation:
1B
𝑦 =
7 𝑥
3 𝑥+1
𝑦=4−𝑥
7 𝑥
3 𝑥 +1
<4 − 𝑥
𝑦 =
7 𝑥
3 𝑥+1
𝑦=4−𝑥
The sketch for this graph is
simple
Downward sloping graph
x and y intercepts at
(4,0) and (0,4)
This one is more difficult
Subbing in x = 0 or y = 0 will yield the intercept (0,0)
Vertical asymptote at x = -1
/3
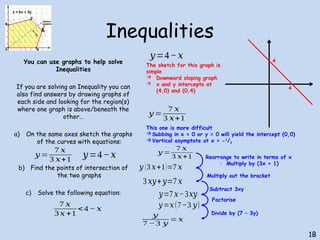
𝑦 =
7 𝑥
3 𝑥+1 Rearrange to write in terms of x
Multiply by (3x + 1)
4
4
𝑦 (3 𝑥+1)=7 𝑥
3 𝑥𝑦+𝑦=7 𝑥
𝑦=7 𝑥−3𝑥𝑦
𝑦=𝑥(7−3 𝑦)
𝑦
7 −3 𝑦
=𝑥
Multiply out the bracket
Subtract 3xy
Factorise
Divide by (7 – 3y)
14.
Inequalities
You can usegraphs to help solve
Inequalities
If you are solving an Inequality you can
also find answers by drawing graphs of
each side and looking for the region(s)
where one graph is above/beneath the
other…
a) On the same axes sketch the graphs
of the curves with equations:
b) Find the points of intersection of
the two graphs
c) Solve the following equation:
1B
𝑦 =
7 𝑥
3 𝑥+1
𝑦=4−𝑥
7 𝑥
3 𝑥 +1
<4 − 𝑥
𝑦 =
7 𝑥
3 𝑥+1
𝑦=4−𝑥
The sketch for this graph is
simple
Downward sloping graph
x and y intercepts at
(4,0) and (0,4)
This one is more difficult
Subbing in x = 0 or y = 0 will yield the intercept (0,0)
Vertical asymptote at x = -1
/3
4
4
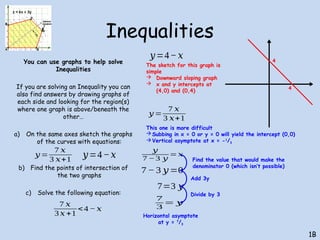
𝑦
7 −3 𝑦
=𝑥
7 − 3 𝑦=0
7=3 𝑦
7
3
= 𝑦
Find the value that would make the
denominator 0 (which isn’t possible)
Divide by 3
Add 3y
Horizontal asymptote
at y = 7
/3
15.
Inequalities
You can usegraphs to help solve
Inequalities
If you are solving an Inequality you can
also find answers by drawing graphs of
each side and looking for the region(s)
where one graph is above/beneath the
other…
a) On the same axes sketch the graphs
of the curves with equations:
b) Find the points of intersection of
the two graphs
c) Solve the following equation:
1B
𝑦 =
7 𝑥
3 𝑥+1
𝑦=4−𝑥
7 𝑥
3 𝑥 +1
<4 − 𝑥
𝑦 =
7 𝑥
3 𝑥+1
𝑦=4−𝑥
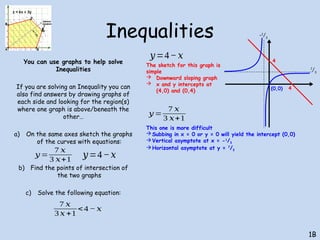
The sketch for this graph is
simple
Downward sloping graph
x and y intercepts at
(4,0) and (0,4)
This one is more difficult
Subbing in x = 0 or y = 0 will yield the intercept (0,0)
Vertical asymptote at x = -1
/3
Horizontal asymptote at y = 7
/3
4
4
-1
/3
7
/3
(0,0)
16.
Inequalities
You can usegraphs to help solve
Inequalities
If you are solving an Inequality you can
also find answers by drawing graphs of
each side and looking for the region(s)
where one graph is above/beneath the
other…
a) On the same axes sketch the graphs
of the curves with equations:
b) Find the points of intersection of
the two graphs
c) Solve the following equation:
1B
𝑦 =
7 𝑥
3 𝑥+1
𝑦=4−𝑥
7 𝑥
3 𝑥 +1
<4 − 𝑥
𝑦 =
7 𝑥
3 𝑥+1
𝑦=4−𝑥
4
4
-1
/3
7
/3
b) The points of intersection will
be where the two equations are
set equal to each other
7 𝑥
3 𝑥+1
=4 − 𝑥
7 𝑥=(4 −𝑥)(3 𝑥+1)
7 𝑥=−3𝑥2
+11 𝑥+4
3 𝑥2
−4 𝑥−4=0
(3 𝑥+2)(𝑥−2)=0
𝑥=−
2
3
𝑜𝑟 𝑥=2
Multiply by (3x + 1)
Expand brackets
Rearrange and set equal to 0
Factorise
Now you know the
intersections
(0,0)
17.
Inequalities
You can usegraphs to help solve
Inequalities
If you are solving an Inequality you can
also find answers by drawing graphs of
each side and looking for the region(s)
where one graph is above/beneath the
other…
a) On the same axes sketch the graphs
of the curves with equations:
b) Find the points of intersection of
the two graphs
c) Solve the following equation:
1B
𝑦 =
7 𝑥
3 𝑥+1
𝑦=4−𝑥
7 𝑥
3 𝑥 +1
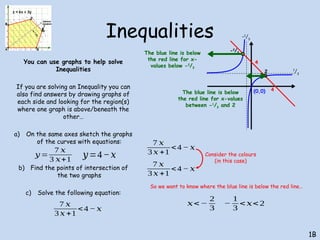
<4 − 𝑥
4
4
7 𝑥
3 𝑥 +1
<4 − 𝑥
7 𝑥
3 𝑥 +1
<4 − 𝑥
-2
/3
2
Consider the colours
(in this case)
So we want to know where the blue line is below the red line…
-1
/3
7
/3
The blue line is below
the red line for x-
values below -2
/3
The blue line is below
the red line for x-values
between -1
/3 and 2
𝑥<−
2
3
−
1
3
< 𝑥<2
(0,0)
18.
Inequalities
You can usegraphs to help solve
Inequalities
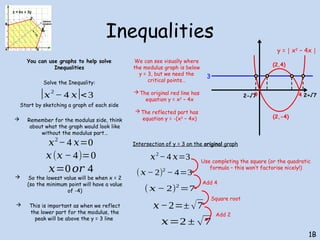
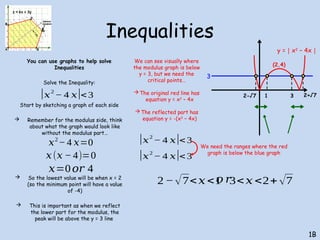
Solve the Inequality:
Start by sketching a graph of each side
Remember for the modulus side, think
about what the graph would look like
without the modulus part…
So the lowest value will be when x = 2
(so the minimum point will have a value
of -4)
This is important as when we reflect
the lower part for the modulus, the
peak will be above the y = 3 line
1B
|𝑥
2
− 4 𝑥|<3
3
y = x
│ 2
– 4x│
𝑥2
−4 𝑥=0
𝑥(𝑥 − 4)=0
𝑥=0𝑜𝑟 4
We can see visually where
the modulus graph is below
y = 3, but we need the
critical points…
The original red line has
equation y = x2
– 4x
The reflected part has
equation y = -(x2
– 4x)
𝑥2
−4 𝑥=3
(𝑥− 2)2
− 4=3
(𝑥 − 2)2
=7
𝑥−2=± √7
𝑥=2 ± √7
Use completing the square (or the quadratic
formula – this won’t factorise nicely!)
Add 4
Square root
Add 2
2-√7 2+√7
0 4
(2,-4)
(2,4)
Intersection of y = 3 on the original graph
19.
Inequalities
You can usegraphs to help solve
Inequalities
Solve the Inequality:
Start by sketching a graph of each side
Remember for the modulus side, think
about what the graph would look like
without the modulus part…
So the lowest value will be when x = 2
(so the minimum point will have a value
of -4)
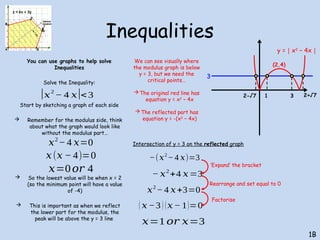
This is important as when we reflect
the lower part for the modulus, the
peak will be above the y = 3 line
1B
|𝑥
2
− 4 𝑥|<3
3
y = x
│ 2
– 4x│
𝑥2
−4 𝑥=0
𝑥(𝑥 − 4)=0
𝑥=0𝑜𝑟 4
We can see visually where
the modulus graph is below
y = 3, but we need the
critical points…
The original red line has
equation y = x2
– 4x
The reflected part has
equation y = -(x2
– 4x)
−(𝑥2
−4 𝑥)=3
‘Expand’ the bracket
2-√7 2+√7
(2,4)
Intersection of y = 3 on the reflected graph
− 𝑥2
+4 𝑥=3
𝑥2
− 4 𝑥+3=0
( 𝑥−3) (𝑥− 1)=0
Rearrange and set equal to 0
Factorise
𝑥=1 𝑜𝑟 𝑥=3
1 3
20.
Inequalities
You can usegraphs to help solve
Inequalities
Solve the Inequality:
Start by sketching a graph of each side
Remember for the modulus side, think
about what the graph would look like
without the modulus part…
So the lowest value will be when x = 2
(so the minimum point will have a value
of -4)
This is important as when we reflect
the lower part for the modulus, the
peak will be above the y = 3 line
1B
|𝑥
2
− 4 𝑥|<3
3
y = x
│ 2
– 4x│
𝑥2
−4 𝑥=0
𝑥(𝑥 − 4)=0
𝑥=0𝑜𝑟 4
We can see visually where
the modulus graph is below
y = 3, but we need the
critical points…
The original red line has
equation y = x2
– 4x
The reflected part has
equation y = -(x2
– 4x)
2-√7 2+√7
(2,4)
1 3
|𝑥2
− 4 𝑥|<3
|𝑥2
− 4 𝑥|<3
We need the ranges where the red
graph is below the blue graph
2 −√7<𝑥<1 3<𝑥 <2+√7
𝑜 𝑟
21.
Inequalities
You can usegraphs to help solve
Inequalities
Sometimes rearranging the equation
can make the sketch far easier to
draw!
Remember to be wary of whether
you might by multiplying or
dividing by a negative though!
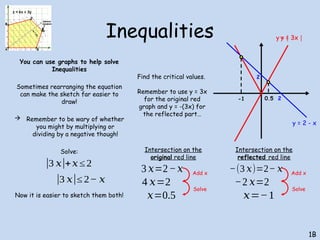
Solve:
Now it is easier to sketch them both!
1B
|3 𝑥|+𝑥≤ 2
|3 𝑥|≤ 2− 𝑥
y = 3x
│ │
y = 2 - x
2
2
Find the critical values.
Remember to use y = 3x
for the original red
graph and y = -(3x) for
the reflected part…
3 𝑥=2−𝑥
4 𝑥=2
𝑥=0.5
Intersection on the
original red line
−(3 𝑥)=2− 𝑥
−2 𝑥=2
𝑥=−1
Intersection on the
reflected red line
Add x
Solve
Add x
Solve
-1 0.5
y = 3x
22.
Inequalities
You can usegraphs to help solve
Inequalities
Sometimes rearranging the equation
can make the sketch far easier to
draw!
Remember to be wary of whether
you might by multiplying or
dividing by a negative though!
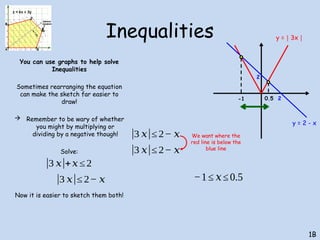
Solve:
Now it is easier to sketch them both!
1B
|3 𝑥|+𝑥≤ 2
|3 𝑥|≤ 2− 𝑥
y = 3x
│ │
y = 2 - x
2
2
-1 0.5
|3 𝑥|≤ 2− 𝑥
|3 𝑥|≤ 2− 𝑥
We want where the
red line is below the
blue line
−1≤ 𝑥≤0.5
23.
Summary
• We haveseen how to solve more
complicated Inequalities
• We have seen how to avoid multiplying
or dividing by a negative
• We have also seen how to use graphs to
help answer questions!