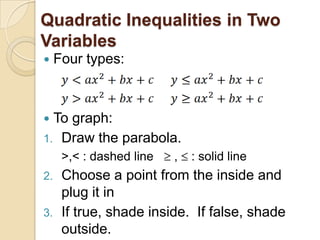
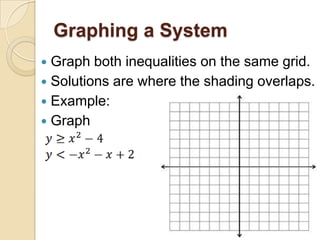
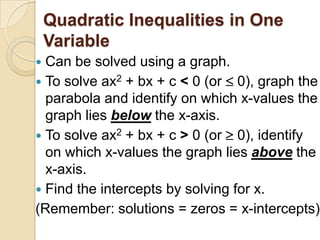
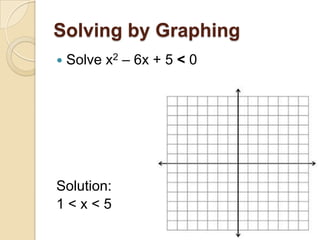
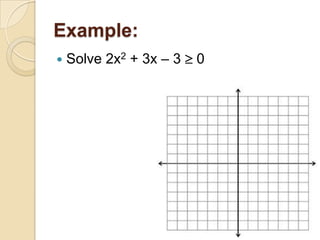
5.7 Graphing and Solving
Quadratic Inequalities
Quadratic Inequalities in Two
Variables
    Four types:


 To graph:
1. Draw the parabola.
      >,< : dashed line   ,   : solid line
2.    Choose a point from the inside and
      plug it in
3.    If true, shade inside. If false, shade
      outside.
Example:
 Graph y > x2 – 2x – 3
 Remember, find the vertex!
Your Turn!
   Graph y   2x2 - 5x – 3
Graphing a System
 Graph both inequalities on the same grid.
 Solutions are where the shading overlaps.
 Example:
 Graph
Quadratic Inequalities in One
    Variable
 Can be solved using a graph.
 To solve ax2 + bx + c < 0 (or 0), graph the
  parabola and identify on which x-values the
  graph lies below the x-axis.
 To solve ax2 + bx + c > 0 (or 0), identify
  on which x-values the graph lies above the
  x-axis.
 Find the intercepts by solving for x.
(Remember: solutions = zeros = x-intercepts)
Solving by Graphing
   Solve x2 – 6x + 5 < 0


Solution:
1<x<5
Example:
   Solve 2x2 + 3x – 3   0
Your Turn!
   Solve -x2 – 9x + 36 > 0
Solving Algebraically
1. Write as an equation and solve.
2. Plot the solutions (called critical x-values)
  on a number line.
3. Test an x-value in between the critical
  values.
  If it is true, solution is an “and”
  If it is not true, solution is an “or”
Example:
   Solve x2 + 2x   8
Your Turn!
   Solve 2x2 – x > 3

5.7 Quadratic Inequalities

  • 1.
    5.7 Graphing andSolving Quadratic Inequalities
  • 2.
    Quadratic Inequalities inTwo Variables  Four types:  To graph: 1. Draw the parabola. >,< : dashed line , : solid line 2. Choose a point from the inside and plug it in 3. If true, shade inside. If false, shade outside.
  • 3.
    Example:  Graph y> x2 – 2x – 3  Remember, find the vertex!
  • 4.
    Your Turn!  Graph y 2x2 - 5x – 3
  • 5.
    Graphing a System Graph both inequalities on the same grid.  Solutions are where the shading overlaps.  Example:  Graph
  • 6.
    Quadratic Inequalities inOne Variable  Can be solved using a graph.  To solve ax2 + bx + c < 0 (or 0), graph the parabola and identify on which x-values the graph lies below the x-axis.  To solve ax2 + bx + c > 0 (or 0), identify on which x-values the graph lies above the x-axis.  Find the intercepts by solving for x. (Remember: solutions = zeros = x-intercepts)
  • 7.
    Solving by Graphing  Solve x2 – 6x + 5 < 0 Solution: 1<x<5
  • 8.
    Example:  Solve 2x2 + 3x – 3 0
  • 9.
    Your Turn!  Solve -x2 – 9x + 36 > 0
  • 10.
    Solving Algebraically 1. Writeas an equation and solve. 2. Plot the solutions (called critical x-values) on a number line. 3. Test an x-value in between the critical values. If it is true, solution is an “and” If it is not true, solution is an “or”
  • 11.
    Example:  Solve x2 + 2x 8
  • 12.
    Your Turn!  Solve 2x2 – x > 3