Downloaded 1,230 times
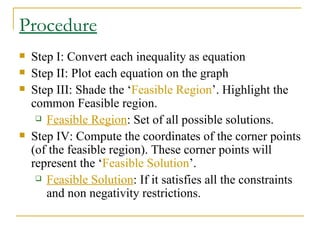
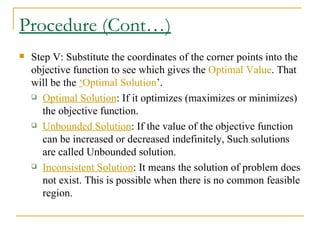
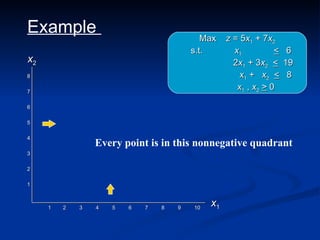
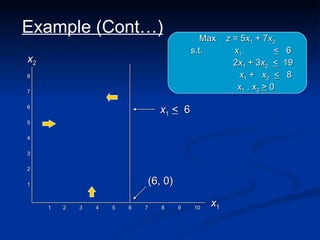
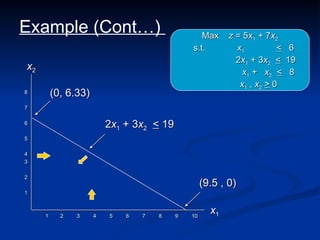
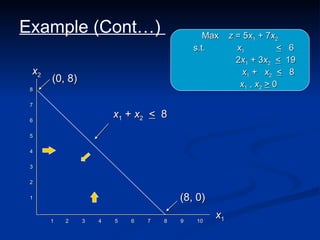
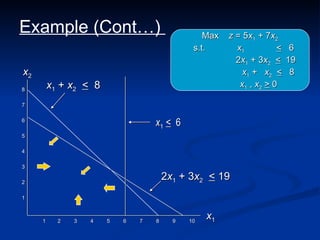
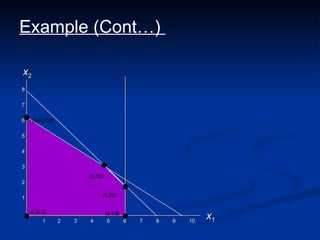
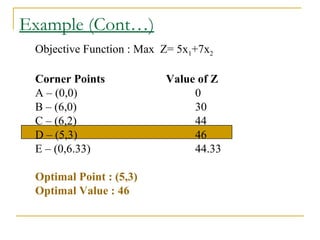
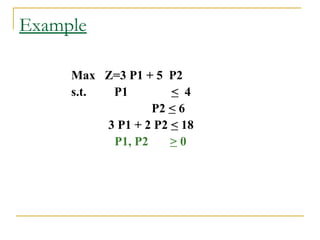
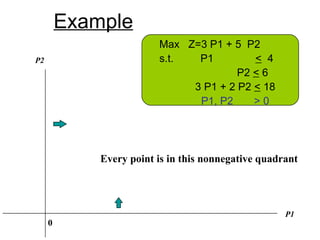
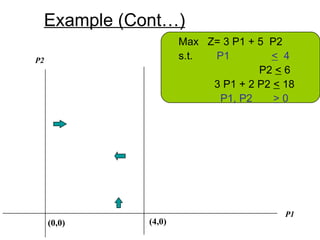
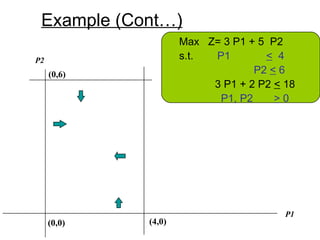
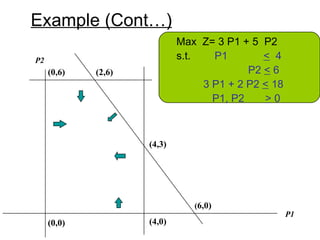
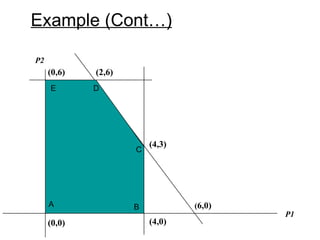
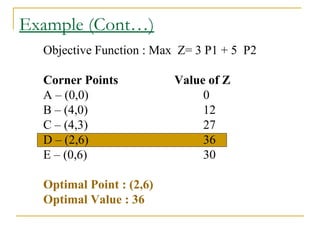
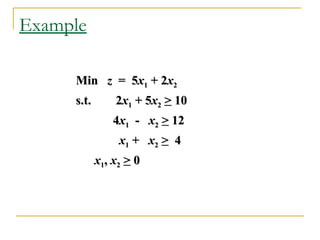
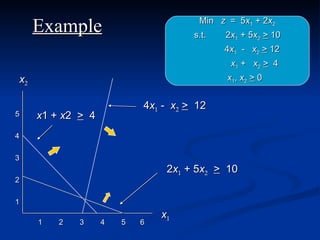
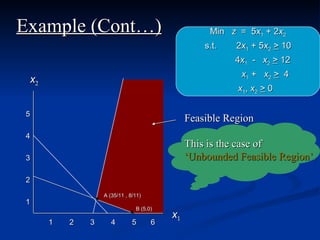
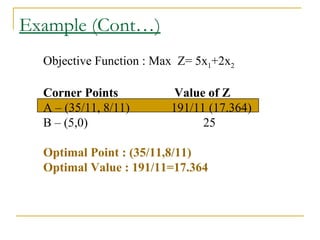
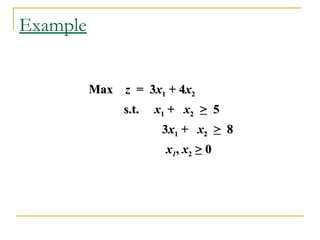
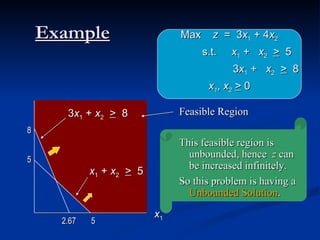
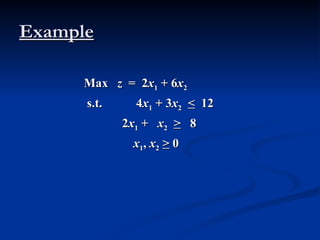
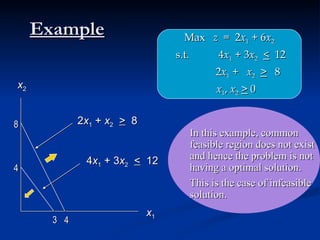

The document describes the graphical method for solving linear programming problems with two decision variables. It provides the step-by-step procedure which involves plotting the constraints on a graph to identify the feasible region, determining the corner points of this region which represent the feasible solutions, substituting these points into the objective function to find the optimal value, and identifying the optimal solution. It then provides examples demonstrating this process and different types of solutions that can arise such as unbounded, infeasible, and optimal.


![Email marketing ver 1.001 [autosaved]](https://cdn.slidesharecdn.com/ss_thumbnails/emailmarketingver1-001autosaved-110311154033-phpapp01-thumbnail.jpg?width=640&height=640&fit=bounds)


![CTEV [ clubfoot] DR ARUN LAL ,DR MOHAMED ASHRAF travancore medical college k...](https://cdn.slidesharecdn.com/ss_thumbnails/ctevclubfootdrarunlaldrmohamedashraftravancoremedicalcollegekollamkeralaindia-260208063247-18fc466c-thumbnail.jpg?width=640&height=640&fit=bounds)


