Rule #3
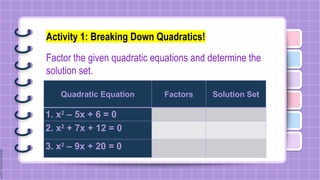
Quadratic Equation Factors Solution Set
1. x2
– 5x + 6 = 0
2. x2
+ 7x + 12 = 0
3. x2
– 9x + 20 = 0
Activity 1: Breaking Down Quadratics!
Factor the given quadratic equations and determine the
solution set.
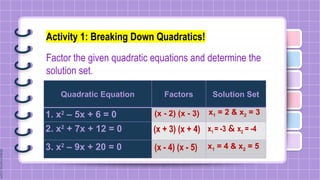
Quadratic Equation Factors Solution Set
1. x2
– 5x + 6 = 0 (x - 2) (x - 3) x1 = 2 & x2 = 3
2. x2
+ 7x + 12 = 0 (x + 3) (x + 4) x1 = -3 & x2 = -4
3. x2
– 9x + 20 = 0 (x - 4) (x - 5) x1 = 4 & x2 = 5
Activity 1: Breaking Down Quadratics!
Factor the given quadratic equations and determine the
solution set.
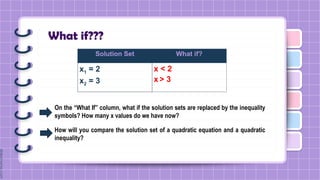
What if???
Solution Set What if?
x1 = 2
x2 = 3
x < 2
x > 3
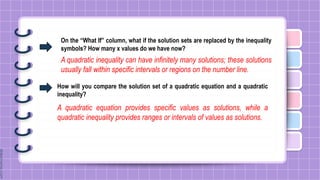
On the “What If” column, what if the solution sets are replaced by the inequality
symbols? How many x values do we have now?
How will you compare the solution set of a quadratic equation and a quadratic
inequality?
On the “What If” column, what if the solution sets are replaced by the inequality
symbols? How many x values do we have now?
How will you compare the solution set of a quadratic equation and a quadratic
inequality?
A quadratic inequality can have infinitely many solutions; these solutions
usually fall within specific intervals or regions on the number line.
A quadratic equation provides specific values as solutions, while a
quadratic inequality provides ranges or intervals of values as solutions.
Solving Quadratic
Inequalities
Lesson Objective:
Solves quadratic inequalities. (M9AL-If-2)
a. Find the solution set of quadratic inequalities algebraically.
b. Graph the solution set of quadratic inequalities on a
number line involving one variable
Group Activity!
The activity is composed of three (3) levels: Easy Level,
Medium Level, and Hard Level. The group’s performance will
be based on the given rubrics.
Rubrics
Criteria Excellent (4) Proficient (3) Needs Improvement (2) Unsatisfactory (1)
Understanding of
Concept
Demonstrates a clear
and thorough
understanding of
inequalities and how to
graph them on a
number line. All work is
accurate.
Shows a good
understanding of
inequalities with minor
mistakes in the
graphing process.
Shows a partial
understanding with
some confusion or
significant errors in
graphing inequalities.
Demonstrates little to
no understanding of
graphing inequalities;
most work is incorrect
or missing.
Accuracy of
Graph
Graph is completely
accurate with all
symbols, shading, and
endpoints correctly
placed.
Graph is mostly
accurate with only one
or two minor mistakes
in symbols, shading, or
endpoints.
Several errors are
present, but the basic
idea of graphing
inequalities is shown.
Graph is mostly
incorrect or missing
critical elements
(shading, symbols, or
endpoints).
Use of Mathematical
Symbols
Uses correct inequality
symbols (e.g., ≤, ≥, <,
>) and appropriate
representation of
open/closed circles on
the number line.
Uses mostly correct
inequality symbols and
representation with
minor errors.
Uses some correct
symbols but makes
frequent errors in
representing
open/closed circles.
Incorrect or missing
use of symbols and
incorrect
representation of
inequalities on the
number line.
Group
Collaboration
Group worked well
together; all members
contributed equally
and communicated
effectively.
Group collaborated
well, though some
members contributed
more than others.
Group worked together
but encountered
communication or
contribution issues.
Group collaboration
was poor, with one or
two members doing
most of the work.
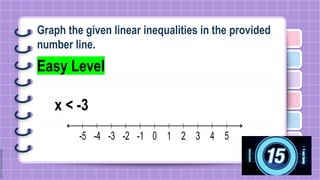
Graph the given linear inequalities in the provided
number line.
Easy Level
x < -3
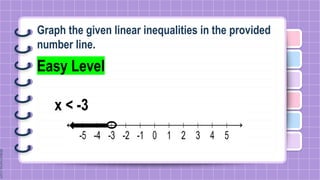
Graph the given linear inequalities in the provided
number line.
Easy Level
x < -3
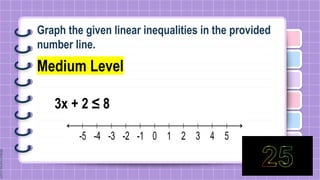
Graph the given linear inequalities in the provided
number line.
Medium Level
3x + 2 ≤ 8
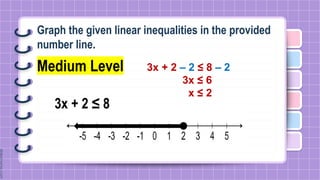
Graph the given linear inequalities in the provided
number line.
Medium Level
3x + 2 ≤ 8
3x + 2 – 2 ≤ 8 – 2
3x ≤ 6
x ≤ 2
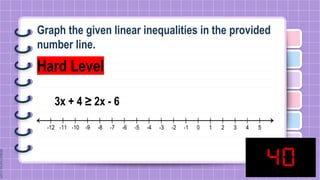
Graph the given linear inequalities in the provided
number line.
Hard Level
3x + 4 ≥ 2x - 6
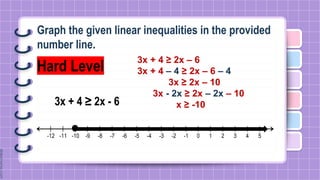
Graph the given linear inequalities in the provided
number line.
Hard Level
3x + 4 ≥ 2x - 6
3x + 4 ≥ 2x – 6
3x + 4 – 4 ≥ 2x – 6 – 4
3x ≥ 2x – 10
3x - 2x ≥ 2x – 2x – 10
x ≥ -10
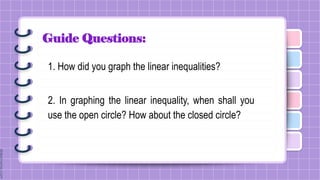
Guide Questions:
1. How did you graph the linear inequalities?
2. In graphing the linear inequality, when shall you
use the open circle? How about the closed circle?
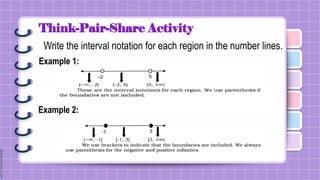
Think-Pair-Share Activity
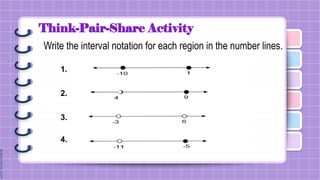
Write the interval notation for each region in the number lines.
Example 1:
Example 2:
Think-Pair-Share Activity
Write the interval notation for each region in the number lines.
1.
2.
3.
4.
Think-Pair-Share Activity
Write the interval notation for each region in the number lines.
1.
2.
3.
4.
(-∞, -10] [-10, 1] [1, +∞)
(+∞, 4) (4, 9] [9, +∞]
(-∞, -3) (-3, 6) (6, +∞)
(-∞, -11) (-11, -5] [-5, +∞)
Quadratic Inequalities
A quadratic inequality is an inequality of the form ax2
+ bx + c <
0, where a, b and c are real numbers and a≠0. The inequality
symbols >, ≤ and ≥ may also be used.
The boundary or boundaries are determined by solving for the
roots of the quadratic equation either by factoring or with the use
of the quadratic formula. After finding the roots (or boundaries), it
is best to place it on a line graph to easily find the test points.
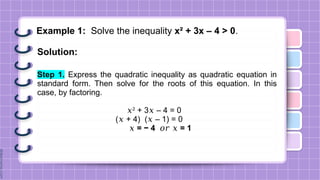
Example 1: Solve the inequality x² + 3x – 4 > 0.
Solution:
Step 1. Express the quadratic inequality as quadratic equation in
standard form. Then solve for the roots of this equation. In this
case, by factoring.
𝑥2
+ 3 – 4 = 0
𝑥
( + 4) ( – 1) = 0
𝑥 𝑥
𝑥 = − 4 𝑜𝑟 = 1
𝑥
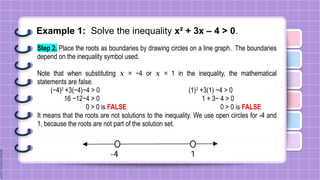
Example 1: Solve the inequality x² + 3x – 4 > 0.
Step 2. Place the roots as boundaries by drawing circles on a line graph. The boundaries
depend on the inequality symbol used.
Note that when substituting 𝑥 = −4 or 𝑥 = 1 in the inequality, the mathematical
statements are false.
(−4)2
+3(−4)−4 > 0 (1)2
+3(1) −4 > 0
16 −12−4 > 0 1 + 3− 4 > 0
0 > 0 is FALSE 0 > 0 is FALSE
It means that the roots are not solutions to the inequality. We use open circles for -4 and
1, because the roots are not part of the solution set.
Example 1: Solve the inequality x² + 3x – 4 > 0.
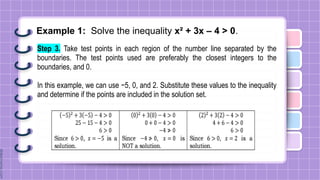
Step 3. Take test points in each region of the number line separated by the
boundaries. The test points used are preferably the closest integers to the
boundaries, and 0.
In this example, we can use −5, 0, and 2. Substitute these values to the inequality
and determine if the points are included in the solution set.
Example 1: Solve the inequality x² + 3x – 4 > 0.
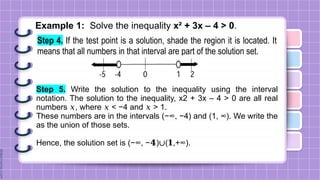
Step 4. If the test point is a solution, shade the region it is located. It
means that all numbers in that interval are part of the solution set.
Step 5. Write the solution to the inequality using the interval
notation. The solution to the inequality, x2 + 3x – 4 > 0 are all real
numbers , where < −4 and > 1.
𝑥 𝑥 𝑥
These numbers are in the intervals (−∞, −4) and (1, ∞). We write the
as the union of those sets.
Hence, the solution set is (−∞, − ) ( ,+∞).
𝟒 ∪ 𝟏
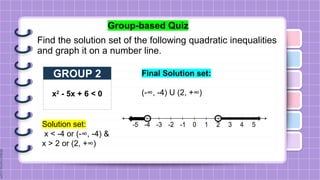
Group-based Quiz
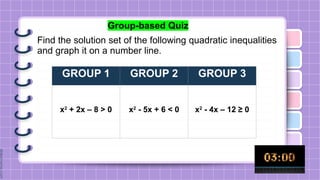
Find the solution set of the following quadratic inequalities
and graph it on a number line.
GROUP 1 GROUP 2 GROUP 3
x2
+ 2x – 8 > 0 x2
- 5x + 6 < 0 x2
- 4x – 12 ≥ 0
Group-based Quiz
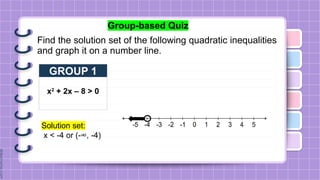
Find the solution set of the following quadratic inequalities
and graph it on a number line.
GROUP 1
x2
+ 2x – 8 > 0
Solution set:
x < -4 or (-∞, -4)
Group-based Quiz
Find the solution set of the following quadratic inequalities
and graph it on a number line.
GROUP 2
x2
- 5x + 6 < 0
Solution set:
x < -4 or (-∞, -4) &
x > 2 or (2, +∞)
Final Solution set:
(-∞, -4) U (2, +∞)
Group-based Quiz
Find the solution set of the following quadratic inequalities
and graph it on a number line.
GROUP 3
x2
- 4x – 12 ≥ 0
Solution set:
x ≤ -2 or (-∞, -2] &
x ≥ 6 or [6, +∞)
Final Solution set:
(-∞, -2] U [6, +∞)
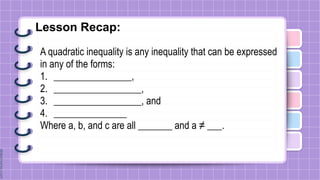
Lesson Recap:
A quadratic inequality is any inequality that can be expressed
in any of the forms:
1. ________________,
2. __________________,
3. __________________, and
4. _______________
Where a, b, and c are all _______ and a ≠ ___.
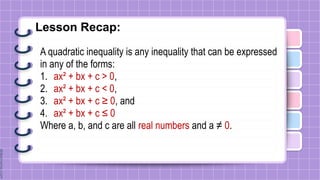
Lesson Recap:
A quadratic inequality is any inequality that can be expressed
in any of the forms:
1. ax² + bx + c > 0,
2. ax² + bx + c < 0,
3. ax² + bx + c ≥ 0, and
4. ax² + bx + c ≤ 0
Where a, b, and c are all real numbers and a ≠ 0.
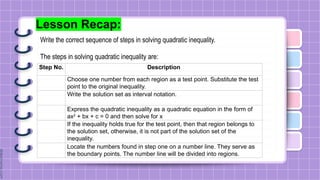
Lesson Recap:
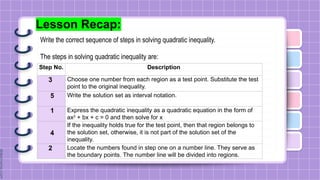
Write the correct sequence of steps in solving quadratic inequality.
The steps in solving quadratic inequality are:
Step No. Description
Choose one number from each region as a test point. Substitute the test
point to the original inequality.
Write the solution set as interval notation.
Express the quadratic inequality as a quadratic equation in the form of
ax2
+ bx + c = 0 and then solve for x
If the inequality holds true for the test point, then that region belongs to
the solution set, otherwise, it is not part of the solution set of the
inequality.
Locate the numbers found in step one on a number line. They serve as
the boundary points. The number line will be divided into regions.
Lesson Recap:
Write the correct sequence of steps in solving quadratic inequality.
The steps in solving quadratic inequality are:
Step No. Description
3 Choose one number from each region as a test point. Substitute the test
point to the original inequality.
5 Write the solution set as interval notation.
1 Express the quadratic inequality as a quadratic equation in the form of
ax2
+ bx + c = 0 and then solve for x
4
If the inequality holds true for the test point, then that region belongs to
the solution set, otherwise, it is not part of the solution set of the
inequality.
2 Locate the numbers found in step one on a number line. They serve as
the boundary points. The number line will be divided into regions.
Significance of Quadratic Inequality in
Real-Life
Quadratic inequalities are more than just abstract
mathematical problems. They can model real-world situations
that involve boundaries or thresholds, helping people make
decisions about safety, cost-effectiveness, resource
management, and optimization.
Whether in engineering, economics, health, or sports,
the skills used in solving quadratic inequalities can have
practical and impactful applications in daily living.
Significance of Quadratic Inequality in
Real-Life
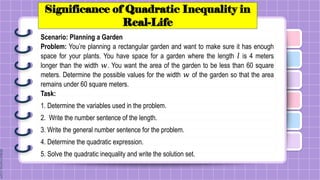
Scenario: Planning a Garden
Problem: You’re planning a rectangular garden and want to make sure it has enough
space for your plants. You have space for a garden where the length 𝑙 is 4 meters
longer than the width 𝑤. You want the area of the garden to be less than 60 square
meters. Determine the possible values for the width 𝑤 of the garden so that the area
remains under 60 square meters.
Task:
1. Determine the variables used in the problem.
2. Write the number sentence of the length.
3. Write the general number sentence for the problem.
4. Determine the quadratic expression.
5. Solve the quadratic inequality and write the solution set.
Significance of Quadratic Inequality in
Real-Life
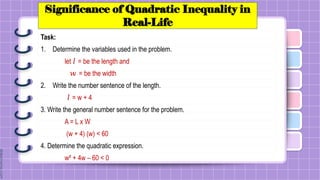
Task:
1. Determine the variables used in the problem.
let 𝑙 = be the length and
𝑤 = be the width
2. Write the number sentence of the length.
𝑙 = w + 4
3. Write the general number sentence for the problem.
A = L x W
(w + 4) (w) < 60
4. Determine the quadratic expression.
w² + 4w – 60 < 0
Significance of Quadratic Inequality in
Real-Life
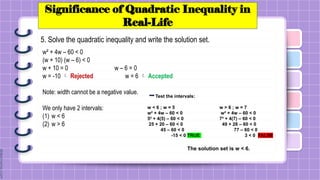
5. Solve the quadratic inequality and write the solution set.
w² + 4w – 60 < 0
(w + 10) (w – 6) < 0
w + 10 = 0 w – 6 = 0
w = -10  Rejected w = 6  Accepted
Note: width cannot be a negative value.
We only have 2 intervals:
(1) w < 6
(2) w > 6
Test the intervals:
w < 6 ; w = 5 w > 6 ; w = 7
w² + 4w – 60 < 0 w² + 4w – 60 < 0
5² + 4(5) – 60 < 0 7² + 4(7) – 60 < 0
25 + 20 – 60 < 0 49 + 28 – 60 < 0
45 – 60 < 0 77 – 60 < 0
-15 < 0 TRUE 3 < 0 FALSE
The solution set is w < 6.
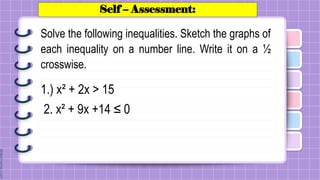
Self – Assessment:
Solve the following inequalities. Sketch the graphs of
each inequality on a number line. Write it on a ½
crosswise.
1.) x² + 2x > 15
2. x² + 9x +14 ≤ 0
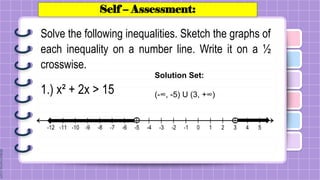
Self – Assessment:
Solve the following inequalities. Sketch the graphs of
each inequality on a number line. Write it on a ½
crosswise.
1.) x² + 2x > 15
Solution Set:
(-∞, -5) U (3, +∞)
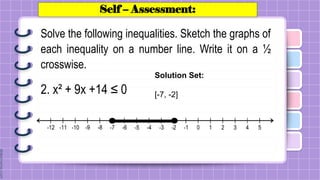
Self – Assessment:
Solve the following inequalities. Sketch the graphs of
each inequality on a number line. Write it on a ½
crosswise.
2. x² + 9x +14 ≤ 0
Solution Set:
[-7, -2]
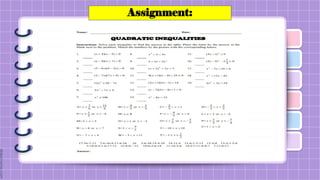
Assignment:
Thank you!