21/09/25
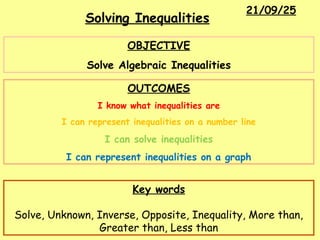
Solving Inequalities
Key words
Solve,Unknown, Inverse, Opposite, Inequality, More than,
Greater than, Less than
OBJECTIVE
Solve Algebraic Inequalities
OUTCOMES
I know what inequalities are
I can represent inequalities on a number line
I can solve inequalities
I can represent inequalities on a graph
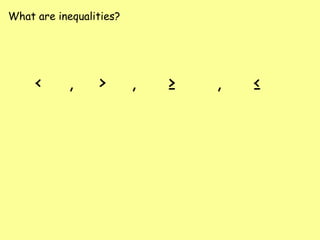
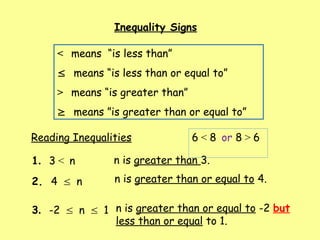
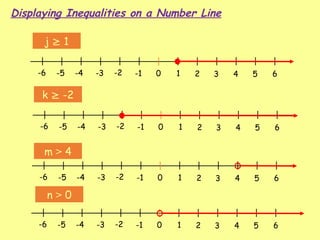
Inequality Signs
< means“is less than”
means “is less than or equal to”
> means “is greater than”
means ”is greater than or equal to”
Reading Inequalities
1. 3 < n n is greater than 3.
2. 4 n n is greater than or equal to 4.
3. -2 n 1 n is greater than or equal to -2 but
less than or equal to 1.
6 < 8 or 8 > 6
4.
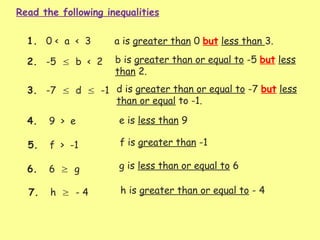
Read the followinginequalities
1. 0 < a < 3 a is greater than 0 but less than 3.
2. -5 b < 2 b is greater than or equal to -5 but less
than 2.
3. -7 d -1 d is greater than or equal to -7 but less
than or equal to -1.
4. 9 > e e is less than 9
5. f > -1 f is greater than -1
6. 6 g g is less than or equal to 6
7. h - 4 h is greater than or equal to - 4
0 1 23 4 5 6
-1
-2
-3
-4
-5
-6
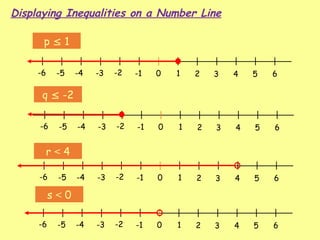
p 1
q -2
0 1 2 3 4 5 6
-1
-2
-3
-4
-5
-6
0 1 2 3 4 5 6
-1
-2
-3
-4
-5
-6
r < 4
0 1 2 3 4 5 6
-1
-2
-3
-4
-5
-6
s < 0
Displaying Inequalities on a Number Line
7.
0 1 23 4 5 6
-1
-2
-3
-4
-5
-6
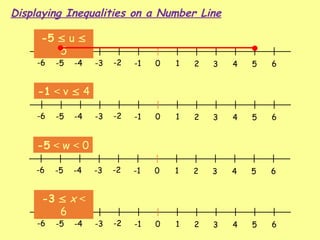
-5 u
5
0 1 2 3 4 5 6
-1
-2
-3
-4
-5
-6
-1 < v 4
0 1 2 3 4 5 6
-1
-2
-3
-4
-5
-6
-5 < w < 0
0 1 2 3 4 5 6
-1
-2
-3
-4
-5
-6
-3 x <
6
Displaying Inequalities on a Number Line
8.
0 1 23 4 5 6
-1
-2
-3
-4
-5
-6
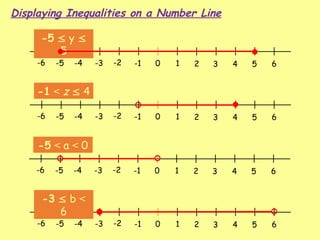
-5 y
5
0 1 2 3 4 5 6
-1
-2
-3
-4
-5
-6
-1 < z 4
0 1 2 3 4 5 6
-1
-2
-3
-4
-5
-6
-5 < a < 0
0 1 2 3 4 5 6
-1
-2
-3
-4
-5
-6
-3 b <
6
Displaying Inequalities on a Number Line
9.
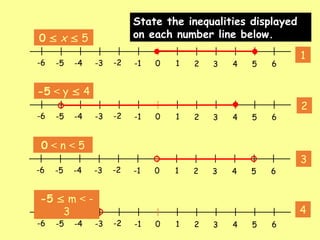
State the inequalitiesdisplayed
on each number line below.
0 1 2 3 4 5 6
-1
-2
-3
-4
-5
-6
0 1 2 3 4 5 6
-1
-2
-3
-4
-5
-6
0 1 2 3 4 5 6
-1
-2
-3
-4
-5
-6
0 1 2 3 4 5 6
-1
-2
-3
-4
-5
-6
1
2
3
4
0 x 5
-5 < y 4
0 < n < 5
-5 m < -
3
10.
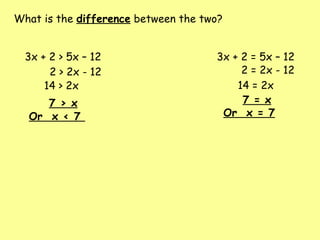
3x + 2> 5x – 12 3x + 2 = 5x – 12
What is the difference between the two?
2 > 2x - 12
14 > 2x
7 > x
Or x < 7
2 = 2x - 12
14 = 2x
7 = x
Or x = 7
11.
Example
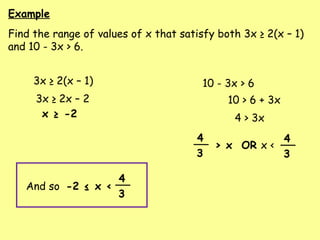
Find the rangeof values of x that satisfy both 3x ≥ 2(x – 1)
and 10 - 3x > 6.
3x ≥ 2(x – 1) 10 - 3x > 6
3x ≥ 2x – 2
x ≥ -2
10 > 6 + 3x
4 > 3x
> x OR x <
4
3
4
3
And so -2 ≤ x <
4
3
12.
Inequalities and Regions
x
y
01 2 3 4 5
-1
-2
-3
-4
1
2
3
4
5
-1
-2
-3
-4
-5
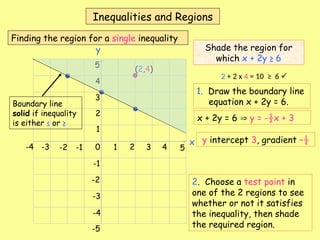
Shade the region for
which x + 2y ≥ 6
1. Draw the boundary line
equation x + 2y = 6.
2. Choose a test point in
one of the 2 regions to see
whether or not it satisfies
the inequality, then shade
the required region.
(2,4)
2 + 2 x 4 = 10 ≥ 6
Boundary line
solid if inequality
is either ≤ or ≥
x + 2y = 6 y = -½x + 3
Finding the region for a single inequality
y intercept 3, gradient –½
13.
x
y
0 1 23 4 5
-1
-2
-3
-4
1
2
3
4
5
-1
-2
-3
-4
-5
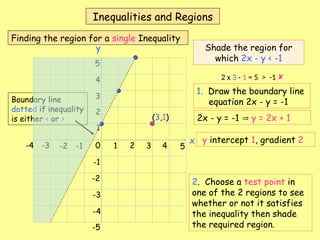
Shade the region for
which 2x - y < -1
1. Draw the boundary line
equation 2x - y = -1
2. Choose a test point in
one of the 2 regions to see
whether or not it satisfies
the inequality then shade
the required region.
(3,1)
2 x 3 - 1 = 5 > -1
2x - y = -1 y = 2x + 1
Boundary line
dotted if inequality
is either < or >
Inequalities and Regions
Finding the region for a single Inequality
y intercept 1, gradient 2
14.
Inequalities and Regions
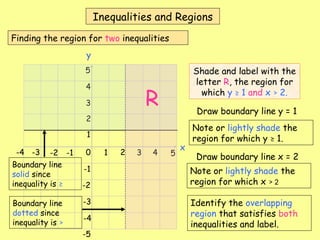
Findingthe region for two inequalities
x
y
0 1 2 3 4 5
-1
-2
-3
-4
1
2
3
4
5
-1
-2
-3
-4
-5
Shade and label with the
letter R, the region for
which y ≥ 1 and x > 2.
Draw boundary line y = 1
Note or lightly shade the
region for which y ≥ 1.
Draw boundary line x = 2
Note or lightly shade the
region for which x > 2
R
Identify the overlapping
region that satisfies both
inequalities and label.
Boundary line
solid since
inequality is ≥
Boundary line
dotted since
inequality is >
15.
x
y
0 1 23 4 5
-1
-2
-3
-4
1
2
3
4
5
-1
-2
-3
-4
-5
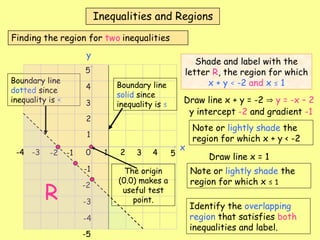
Shade and label with the
letter R, the region for which
x + y < -2 and x ≤ 1
Draw line x + y = -2 y = -x – 2
Note or lightly shade the
region for which x + y < -2
Draw line x = 1
Note or lightly shade the
region for which x ≤ 1
Identify the overlapping
region that satisfies both
inequalities and label.
Boundary line
dotted since
inequality is <
Boundary line
solid since
inequality is ≤
R
The origin
(0.0) makes a
useful test
point.
y intercept -2 and gradient -1
16.
Inequalities and Regions
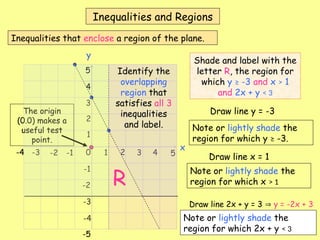
Inequalitiesthat enclose a region of the plane.
x
y
0 1 2 3 4 5
-1
-2
-3
-4
1
2
3
4
5
-1
-2
-3
-4
-5
Shade and label with the
letter R, the region for
which y ≥ -3 and x > 1
and 2x + y < 3
Draw line y = -3
Note or lightly shade the
region for which y ≥ -3.
Draw line x = 1
Note or lightly shade the
region for which x > 1
Draw line 2x + y = 3 y = -2x + 3
y intercept 3 and gradient - 2
Note or lightly shade the
region for which 2x + y < 3
The origin
(0.0) makes a
useful test
point.
R
Identify the
overlapping
region that
satisfies all 3
inequalities
and label.
17.
x
y
0 1 23 4 5
-1
-2
-3
-4
1
2
3
4
5
-1
-2
-3
-4
-5
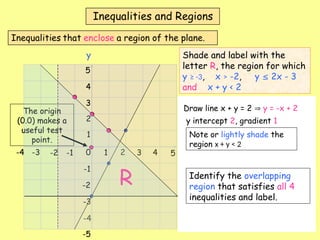
Shade and label with the
letter R, the region for which
y ≥ -3, x > -2, y 2x - 3
and x + y < 2
Draw line y = -3
Note or lightly shade the
region for which y ≥ -3.
Draw line x = -2
Note or lightly shade the
region for which x > -2
Draw line y = 2x – 3
Note or lightly shade the
region for which y 2x - 3
The origin
(0.0) makes a
useful test
point.
y intercept -3 and gradient 2.
The origin
(0.0) makes a
useful test
point.
R
Draw line x + y = 2 y = -x + 2
y intercept 2, gradient 1
Note or lightly shade the
region x + y < 2
Identify the overlapping
region that satisfies all 4
inequalities and label.