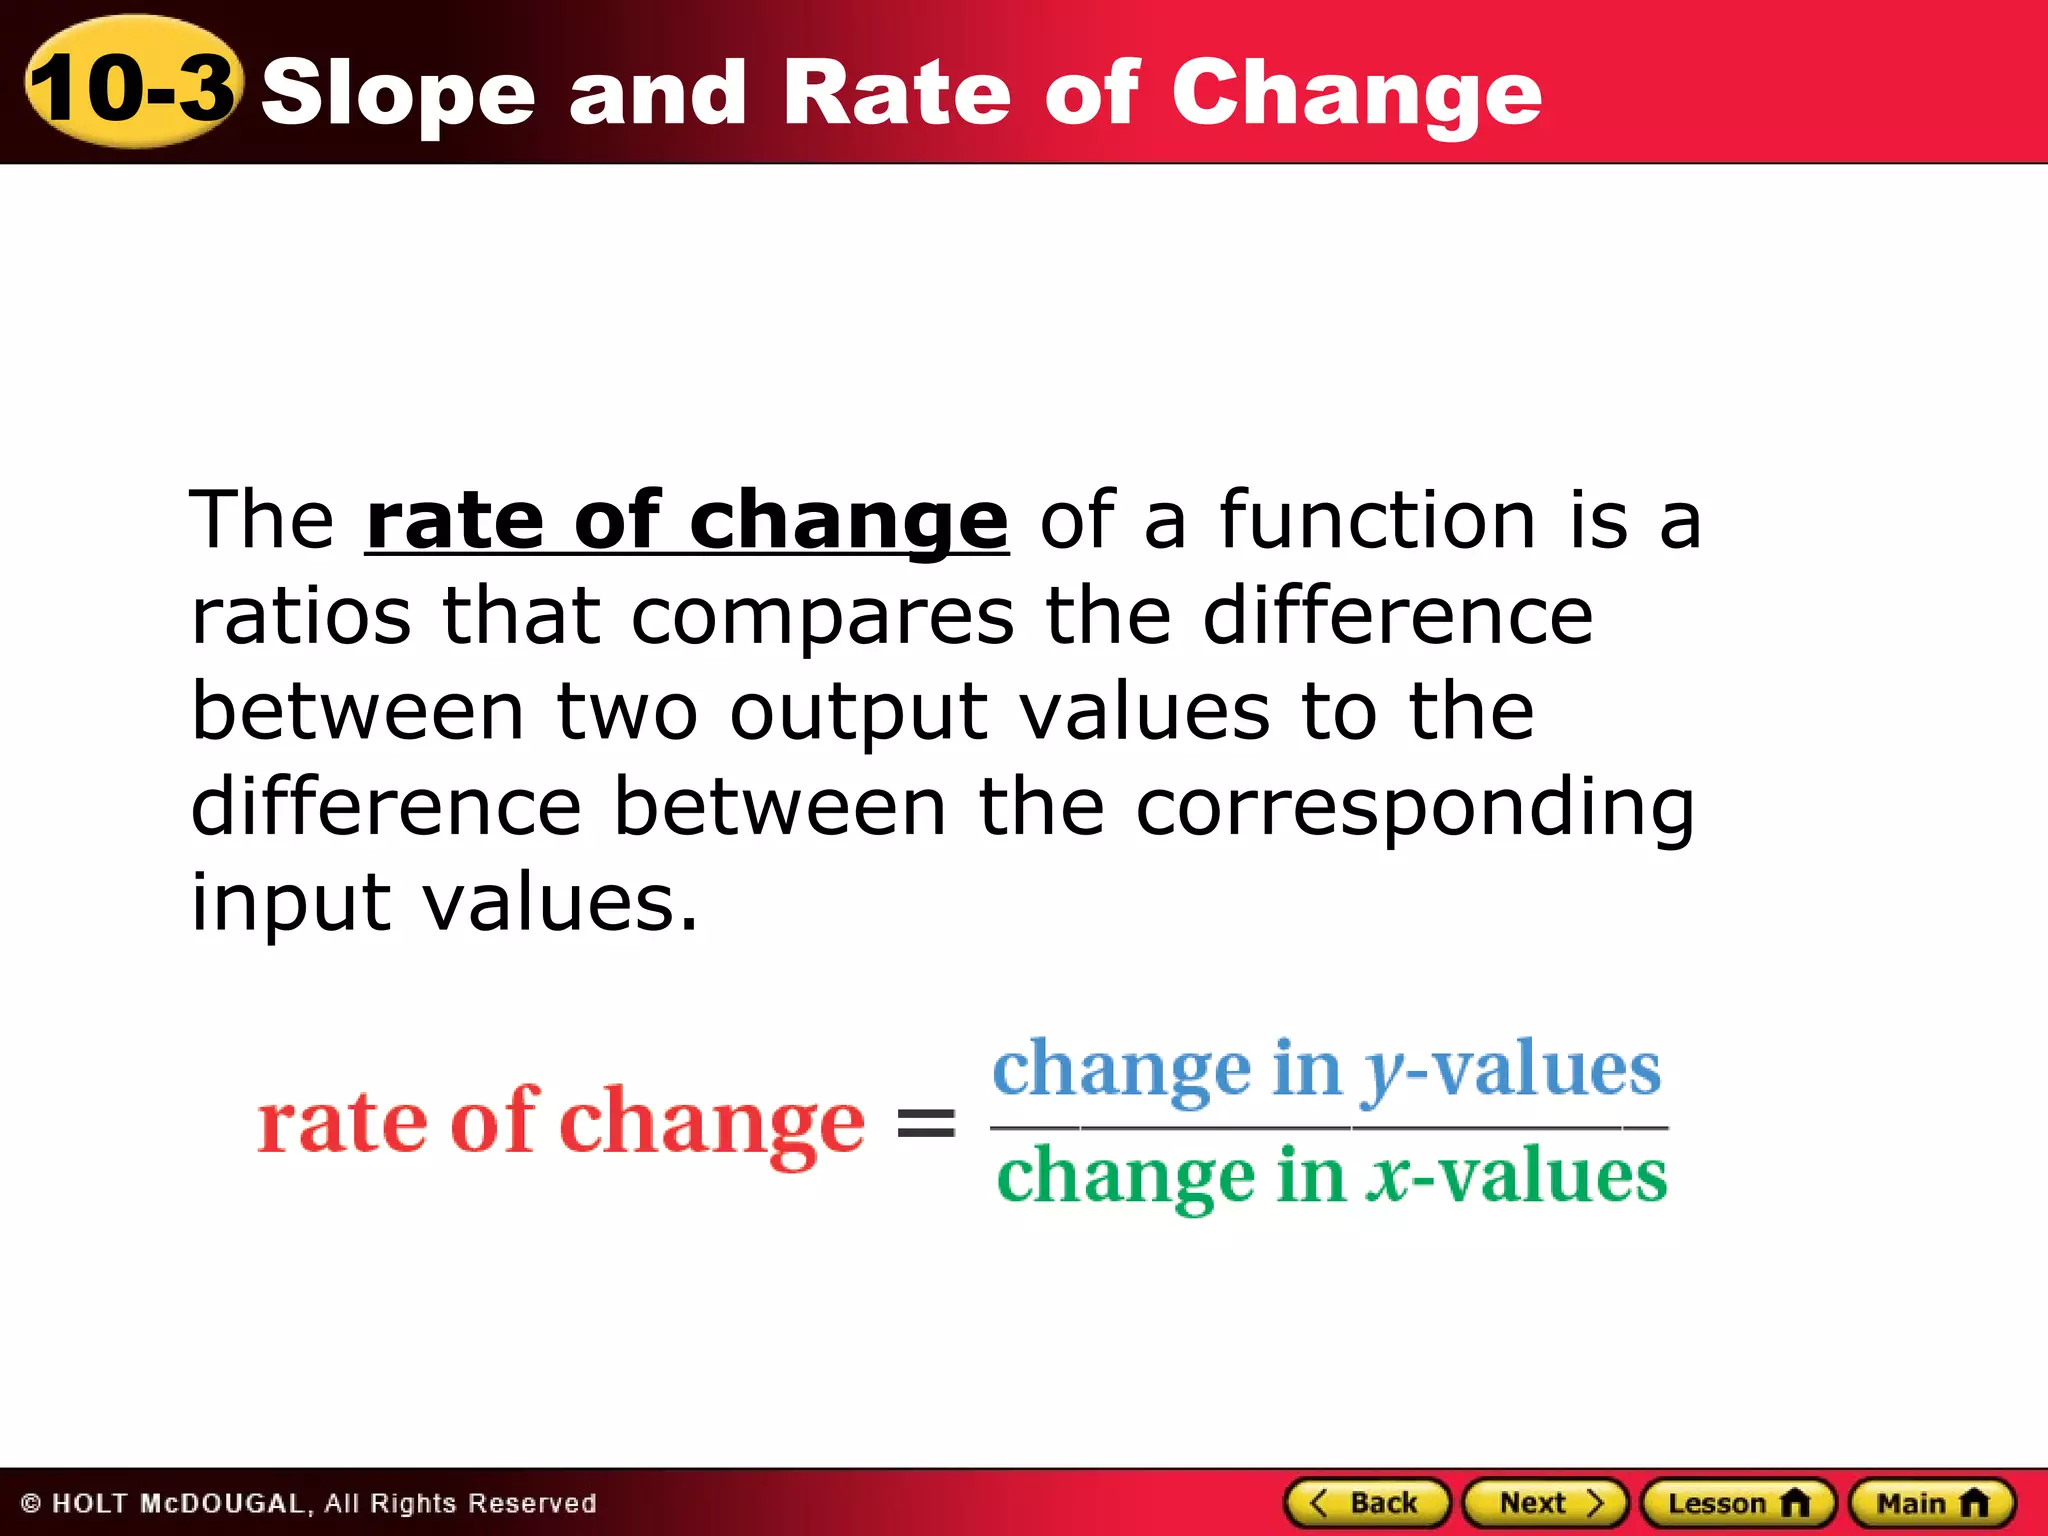
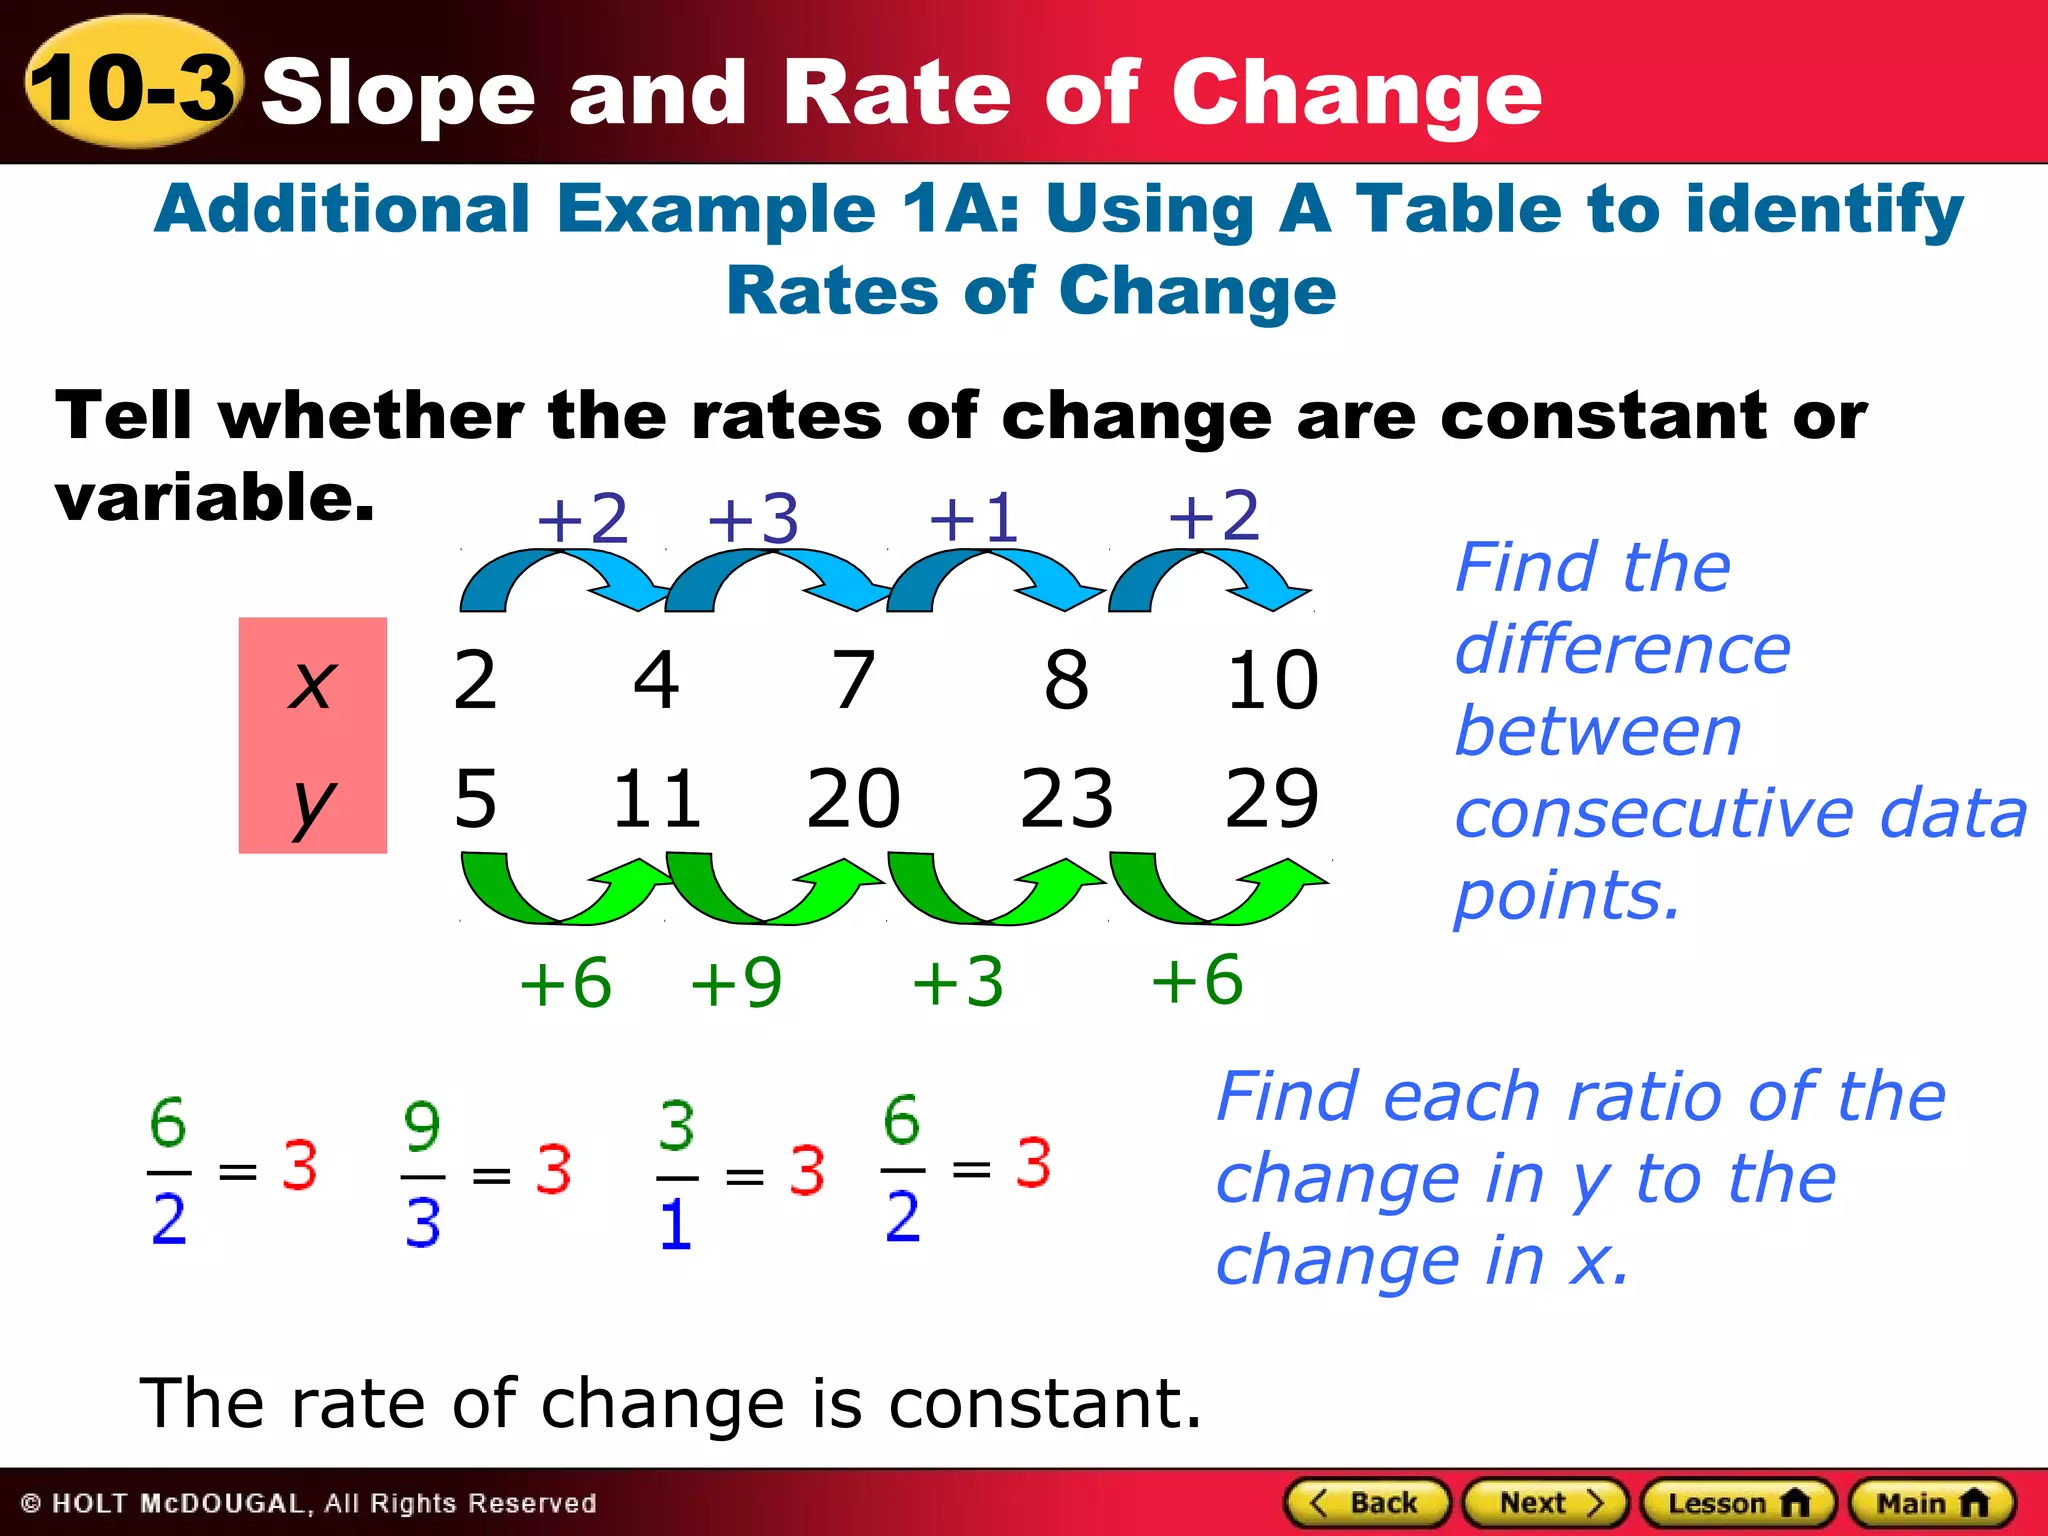
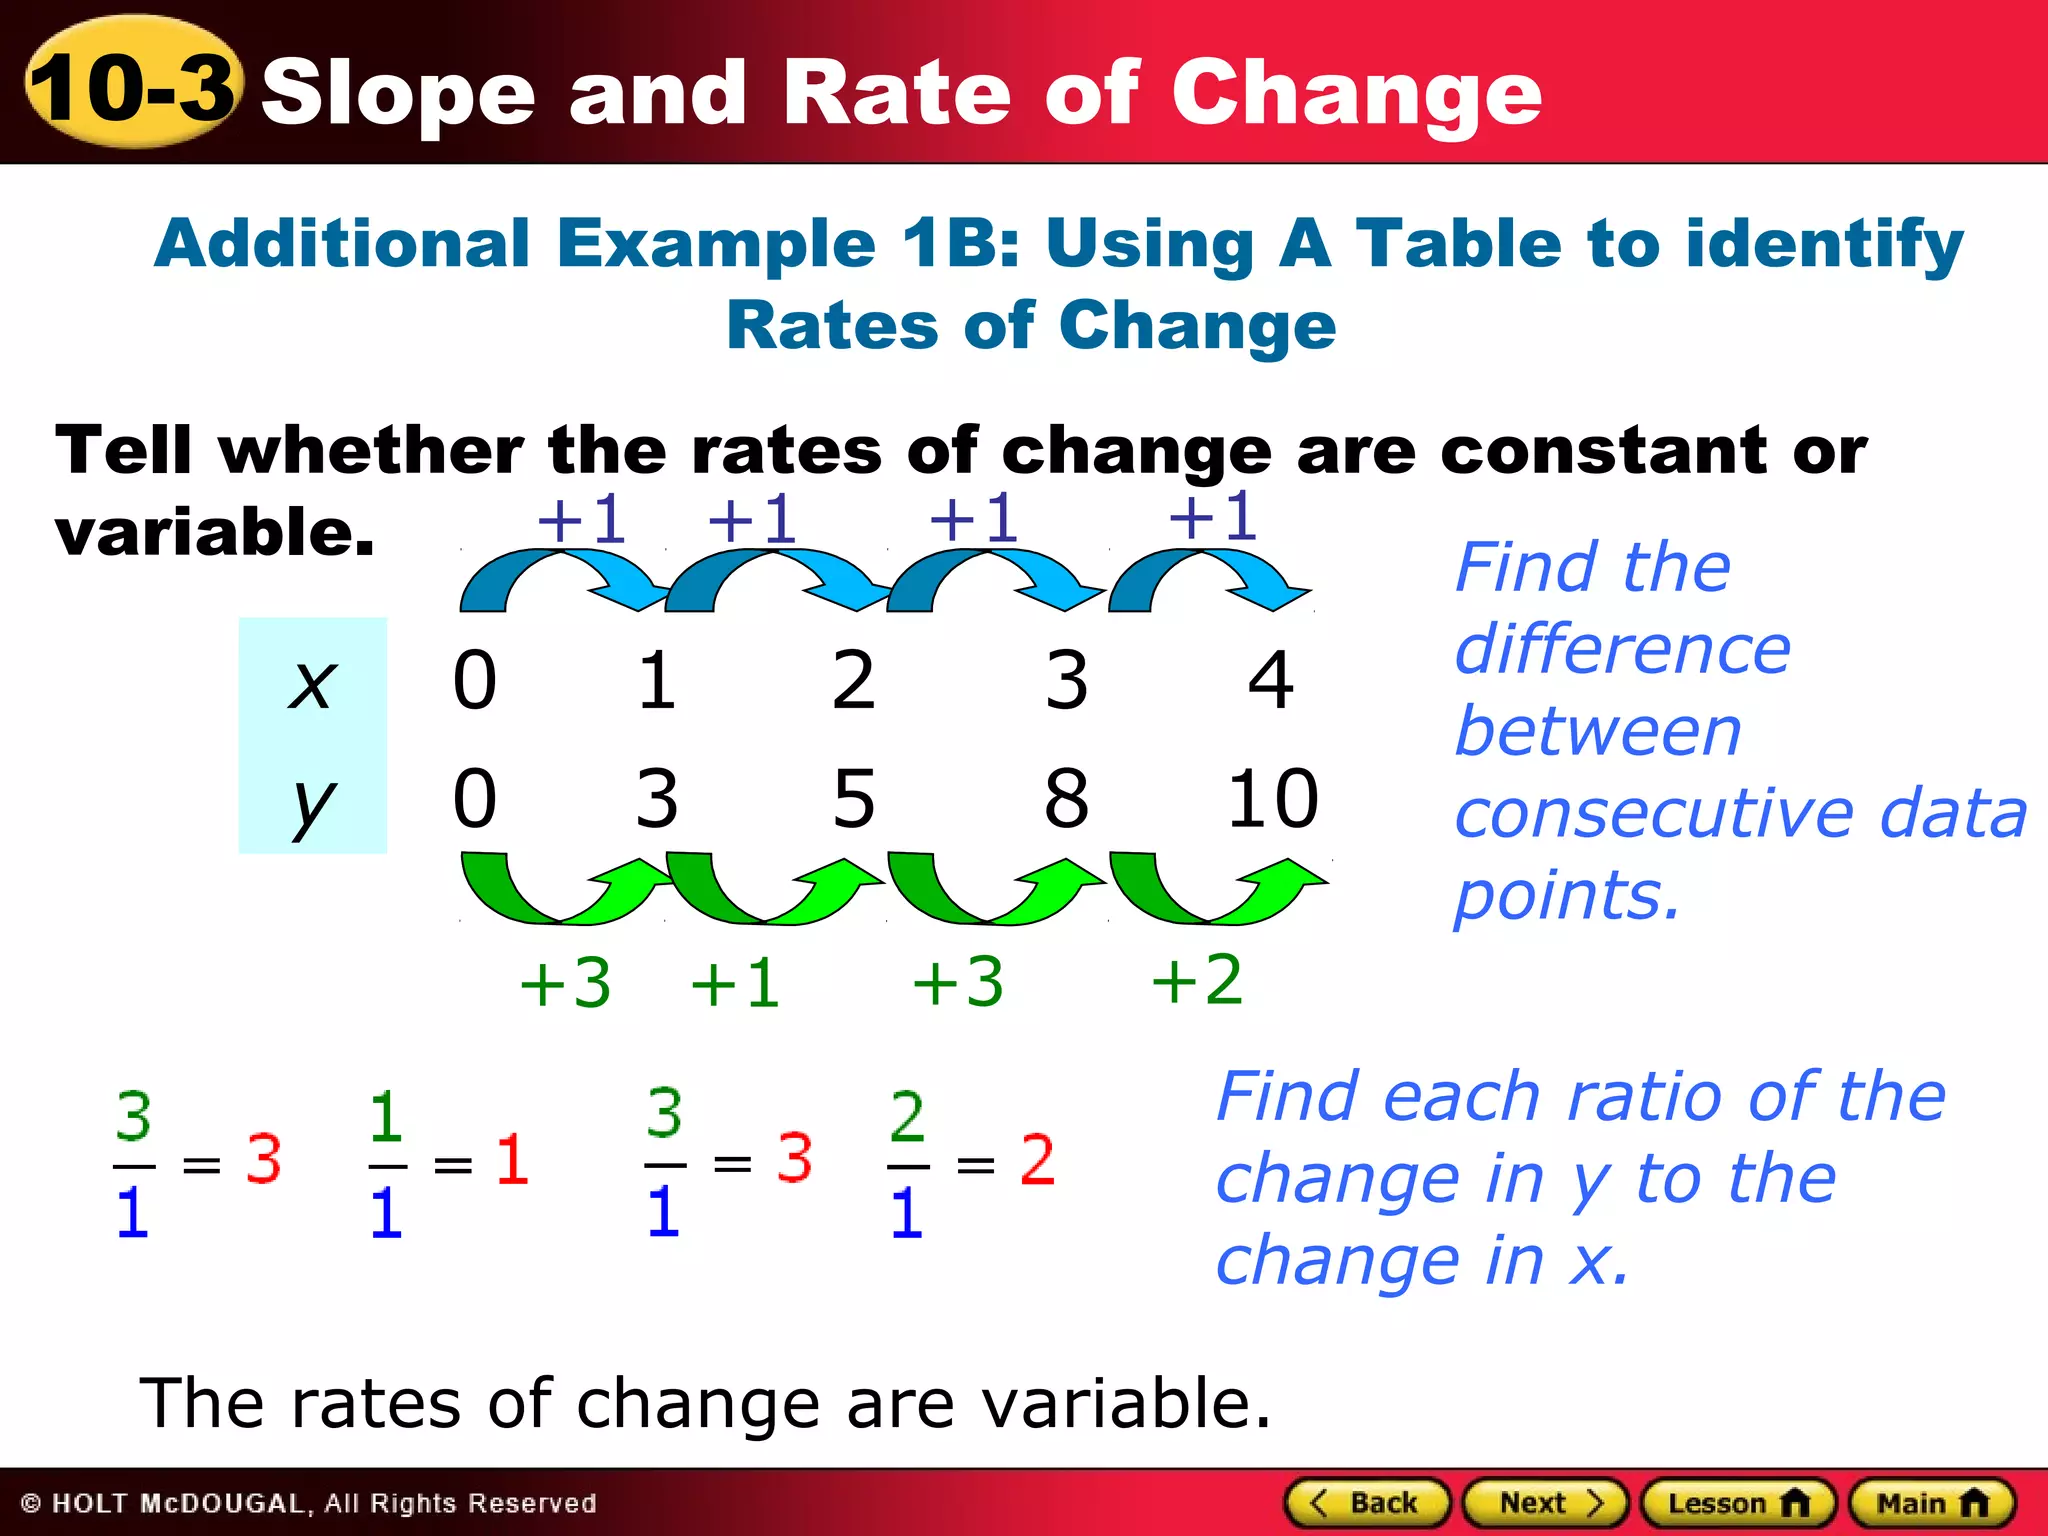
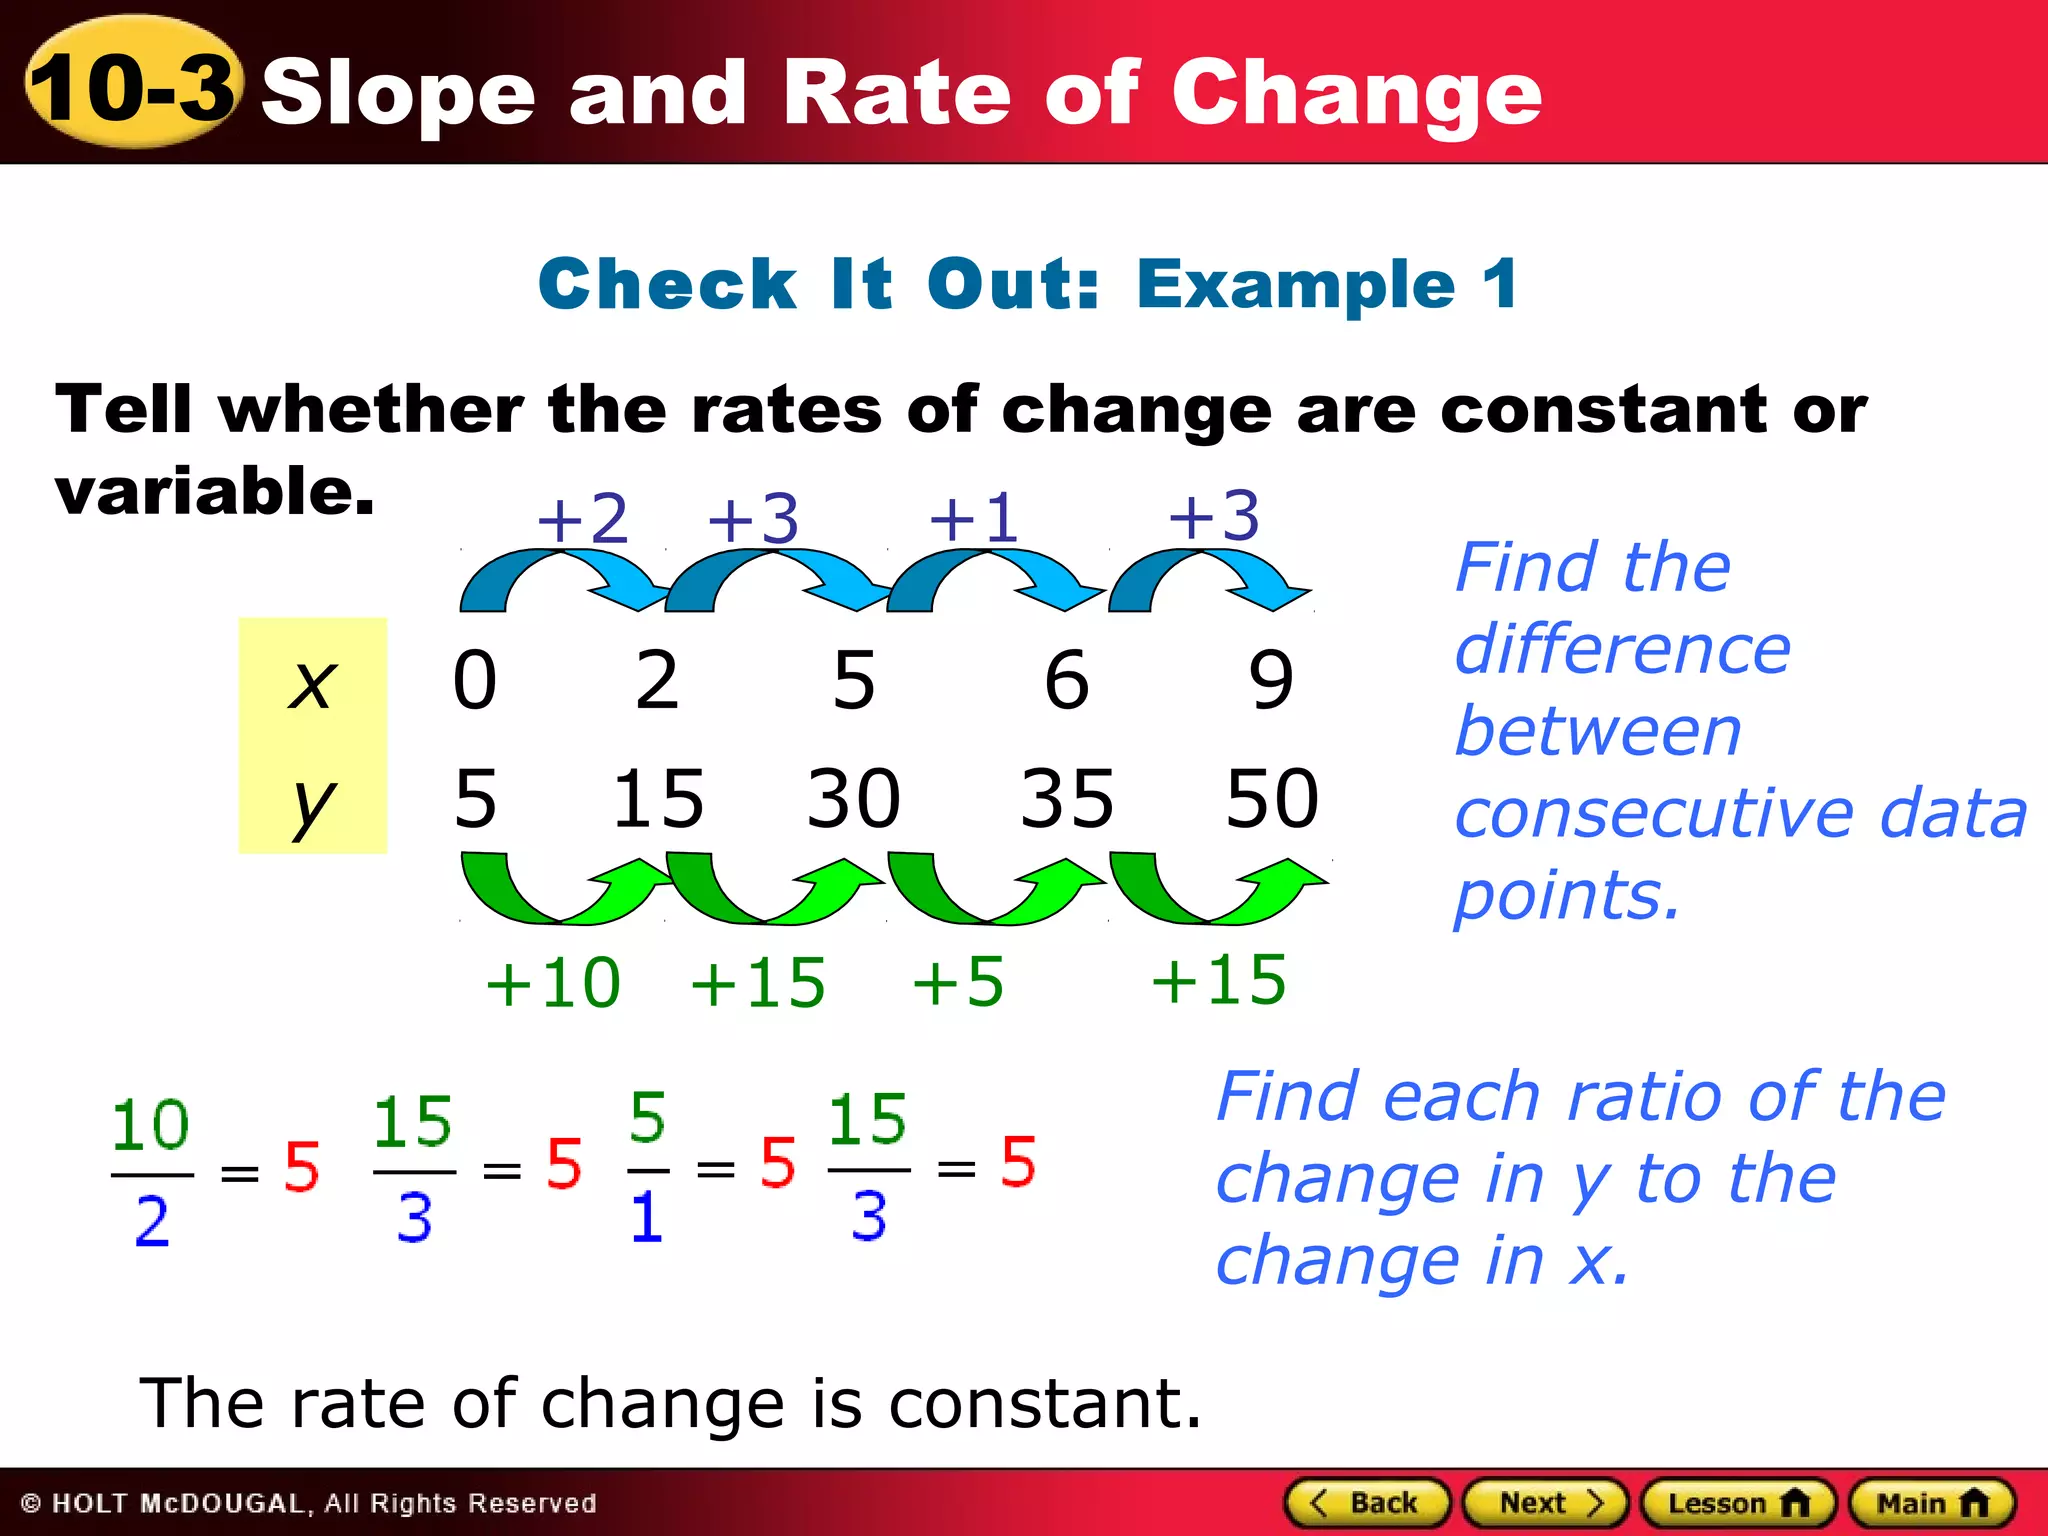
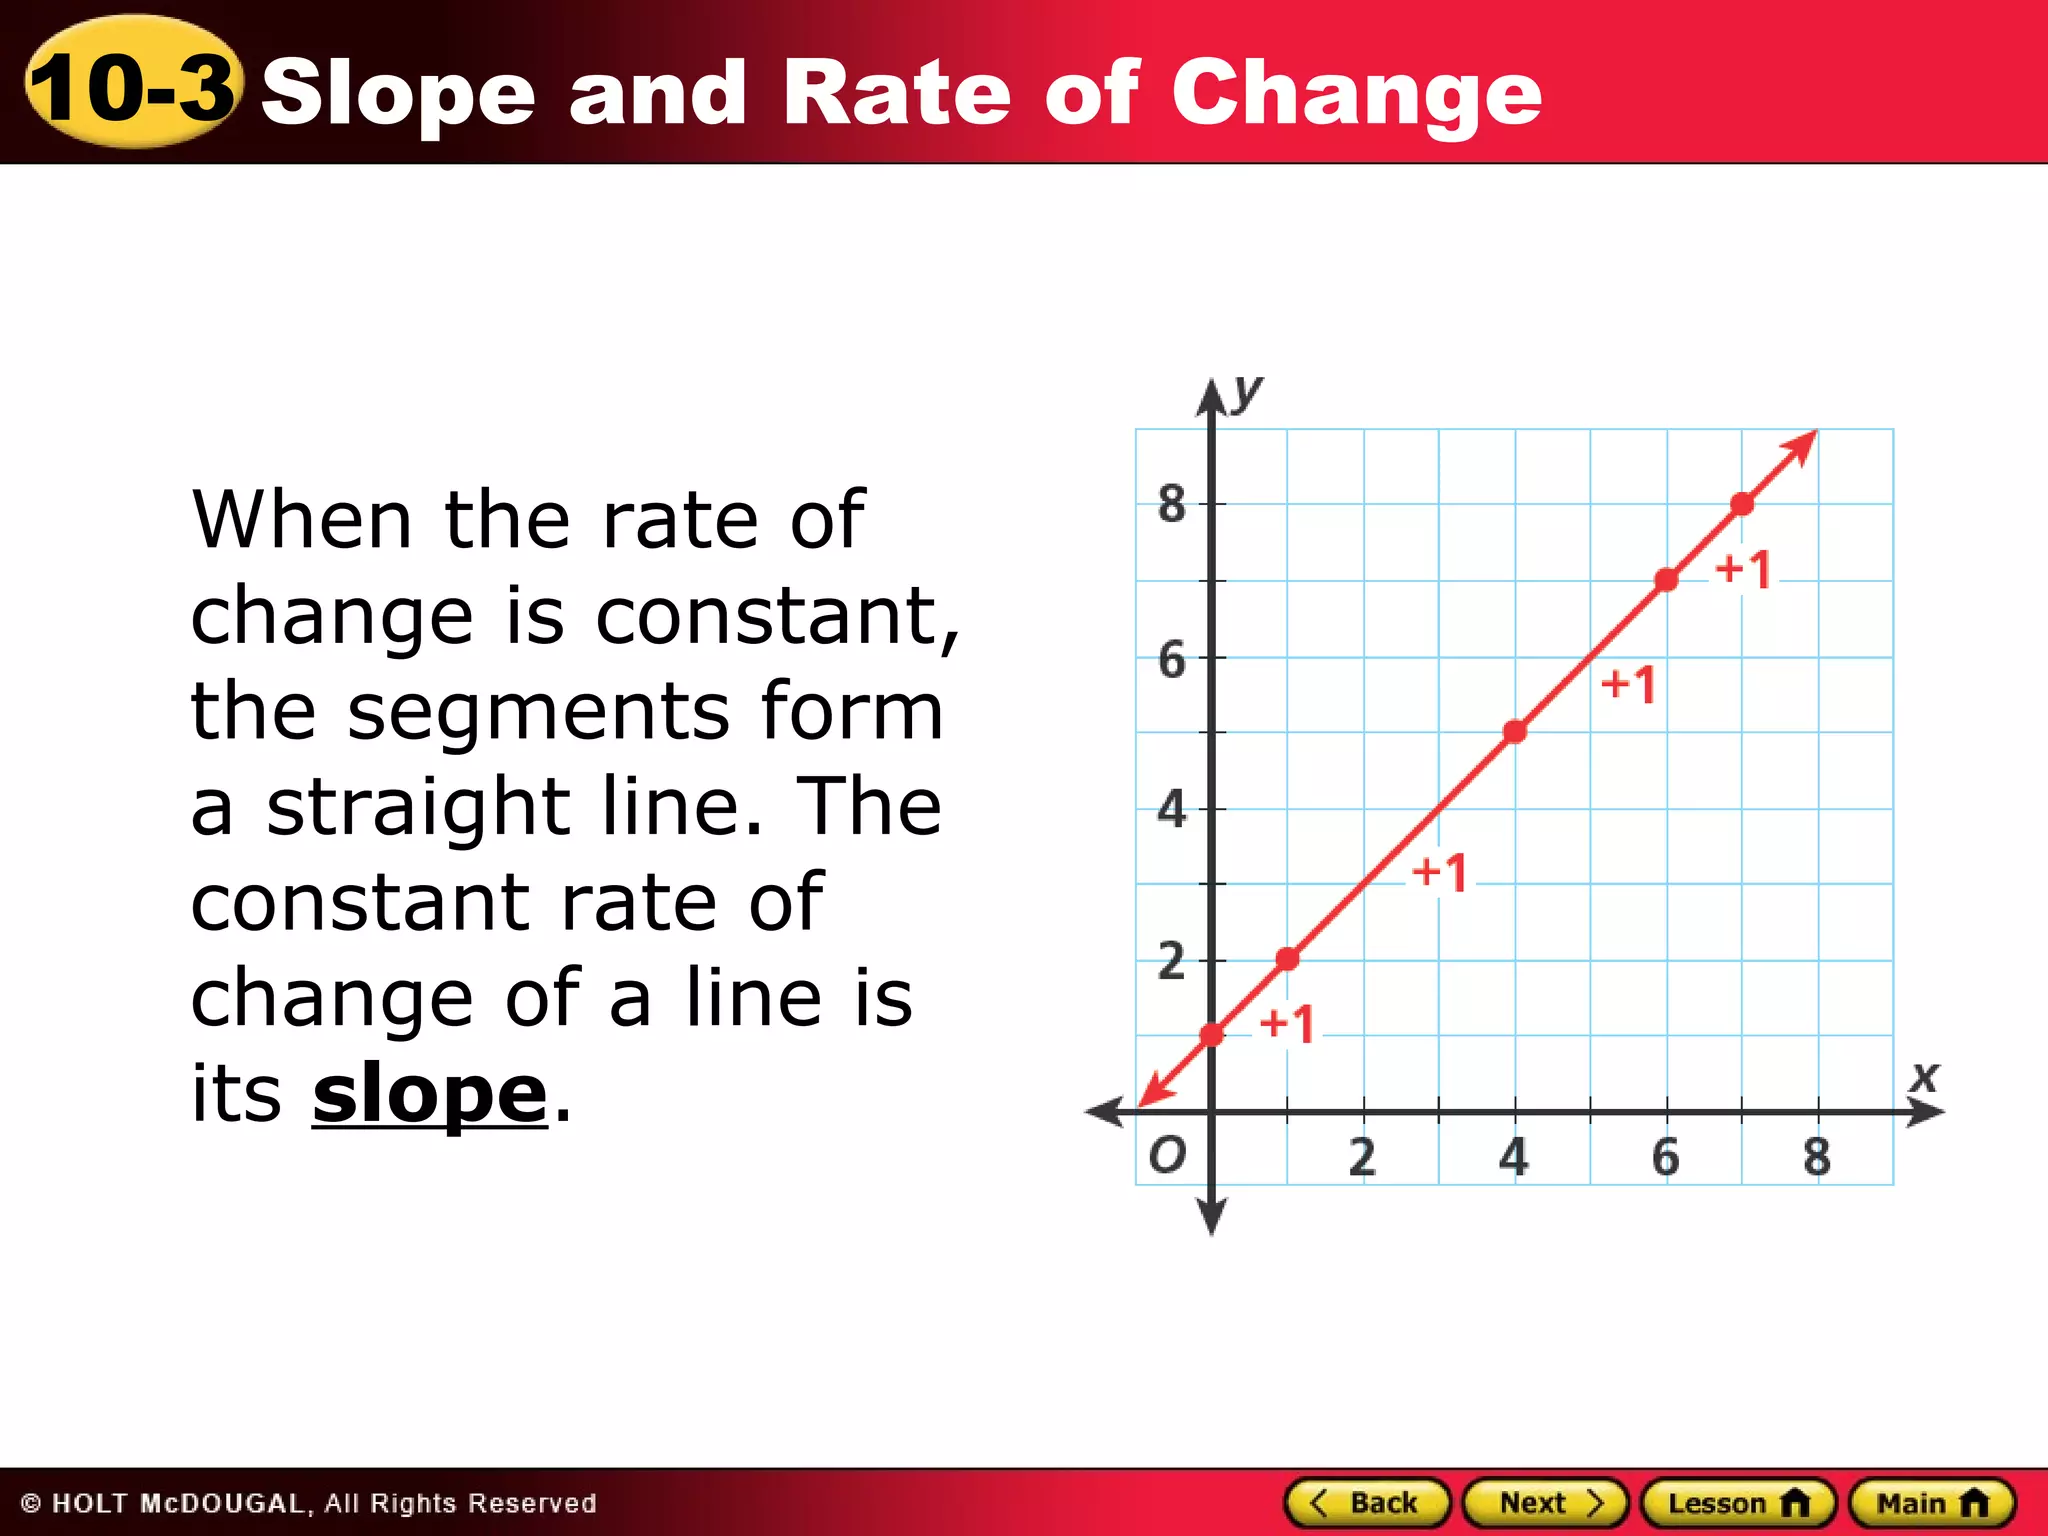
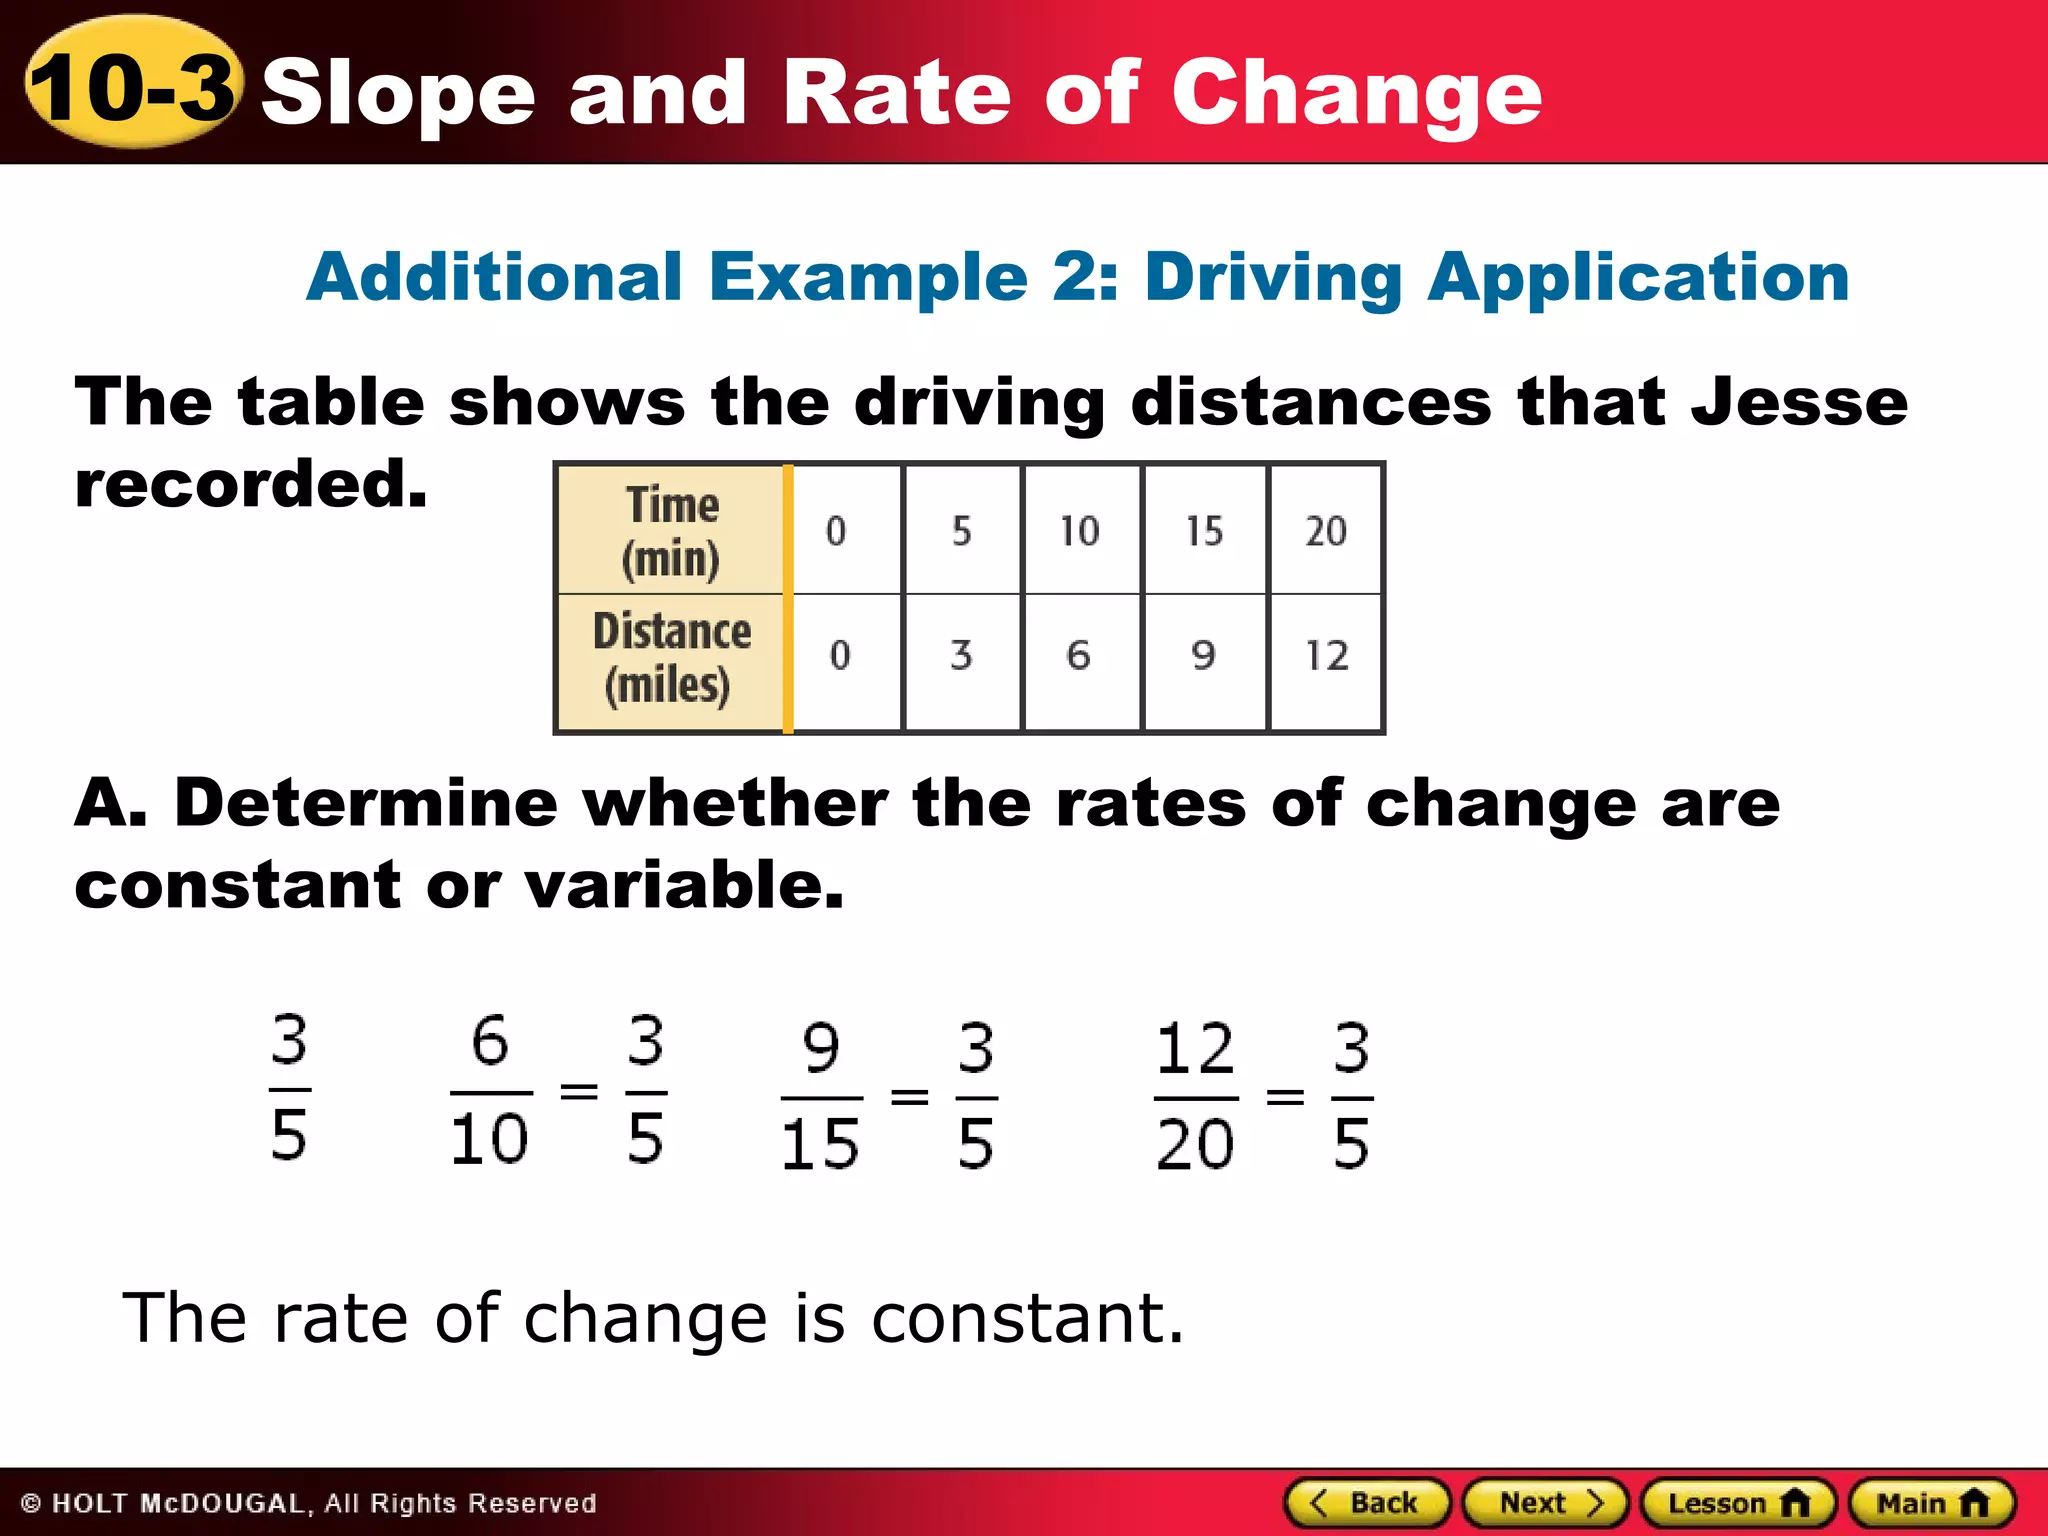
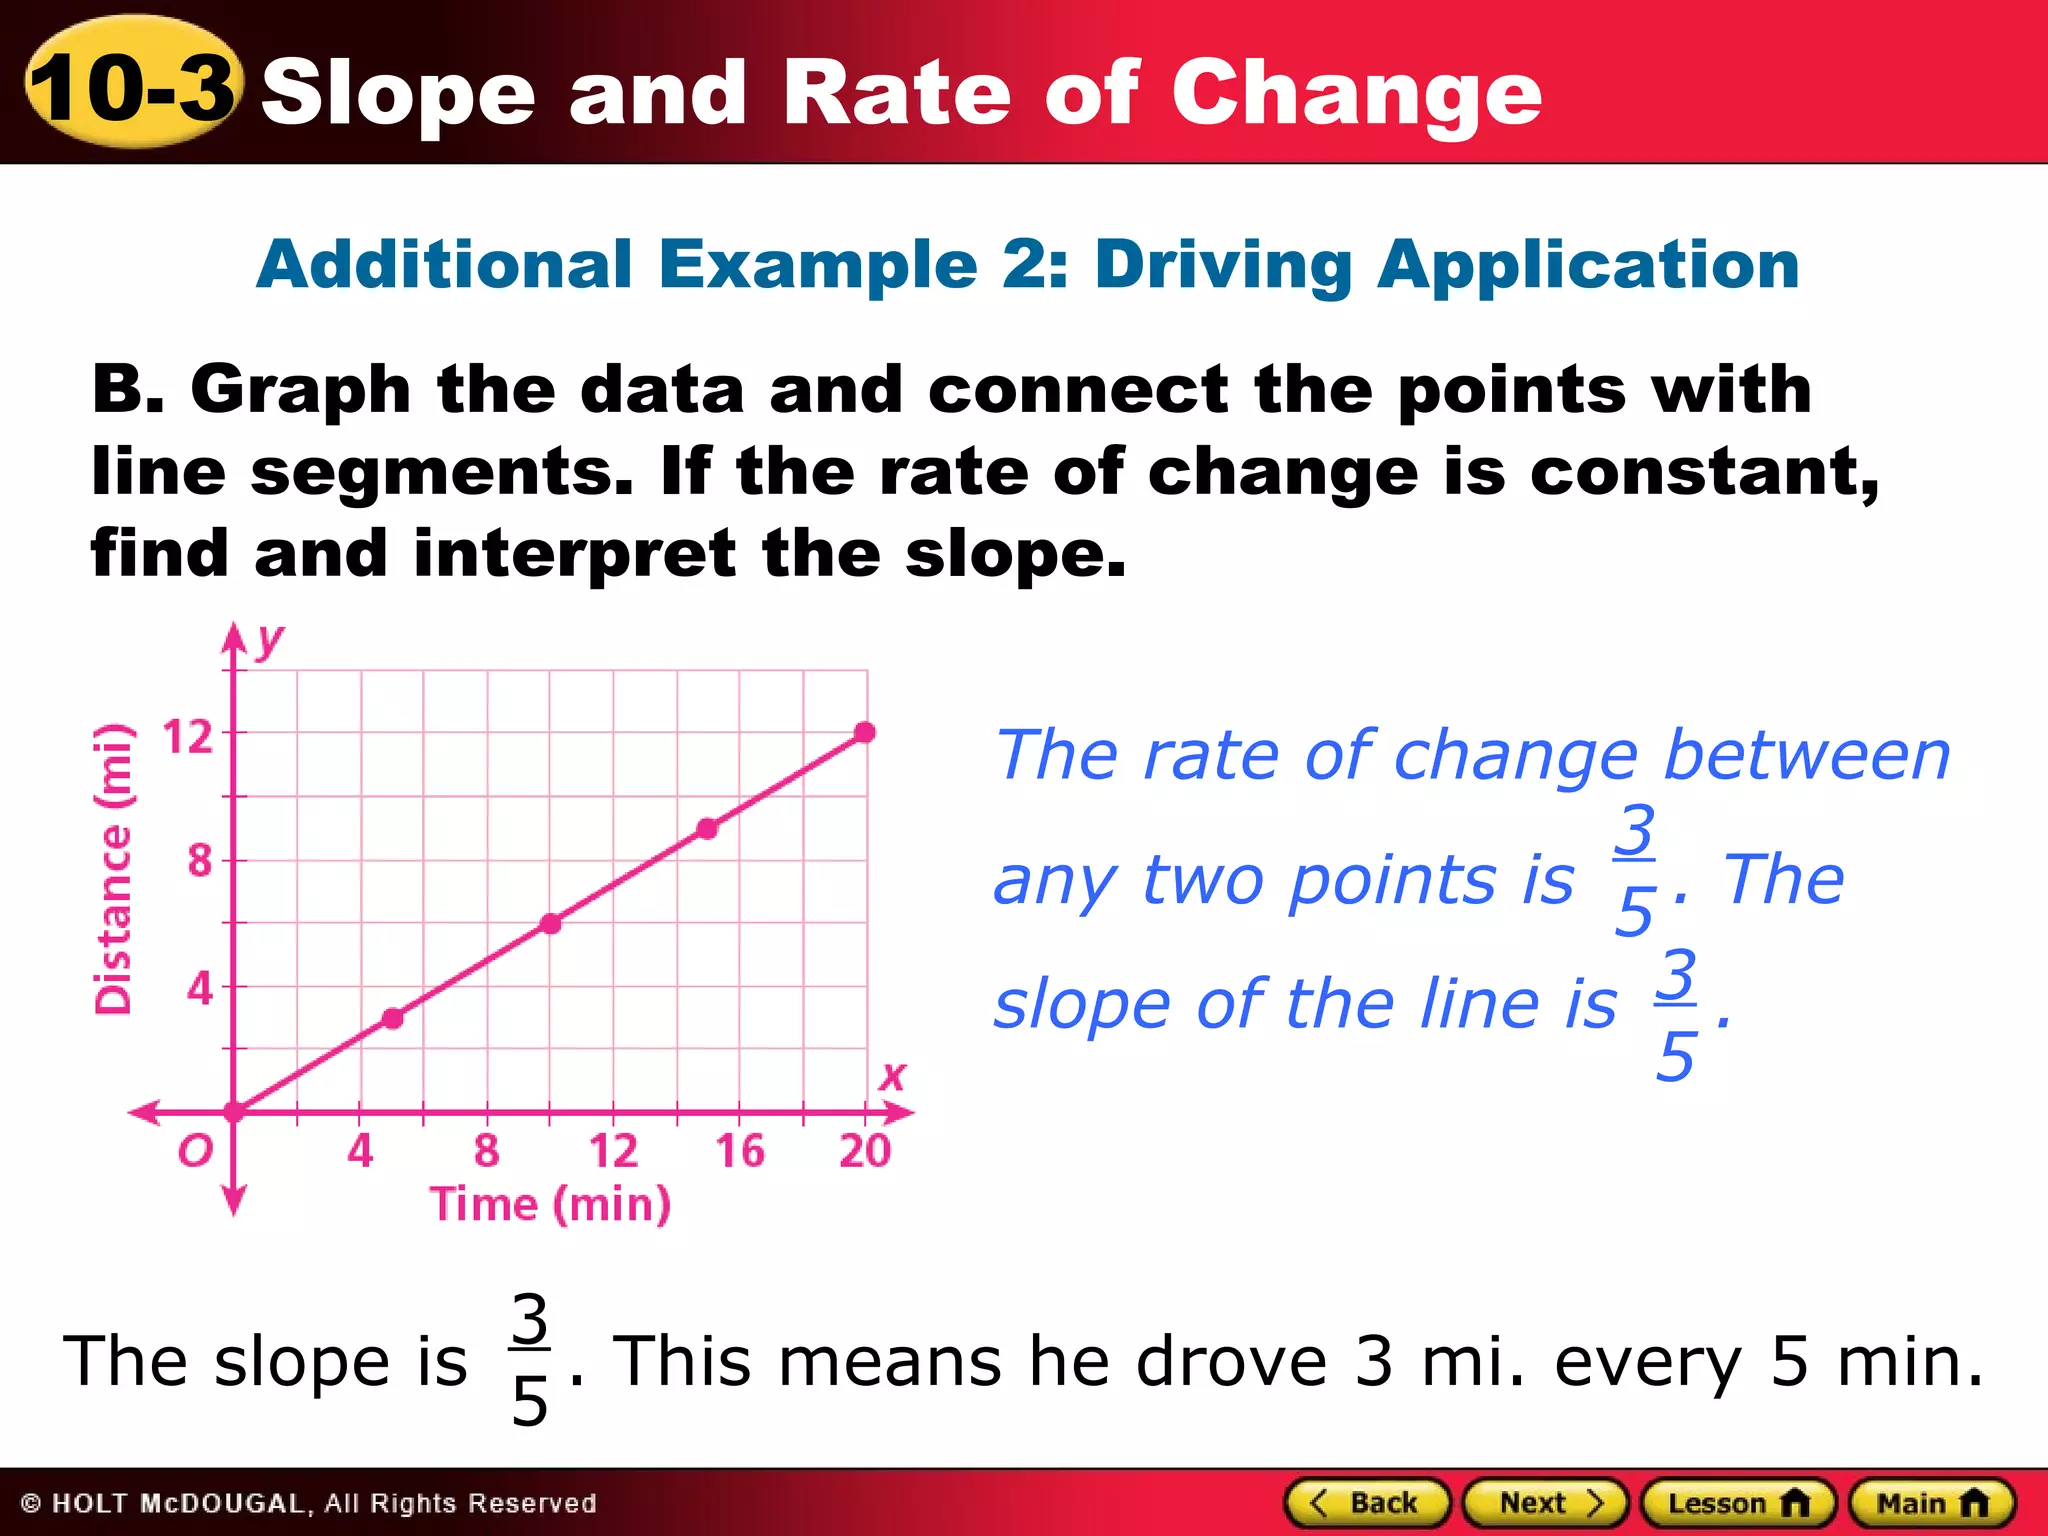
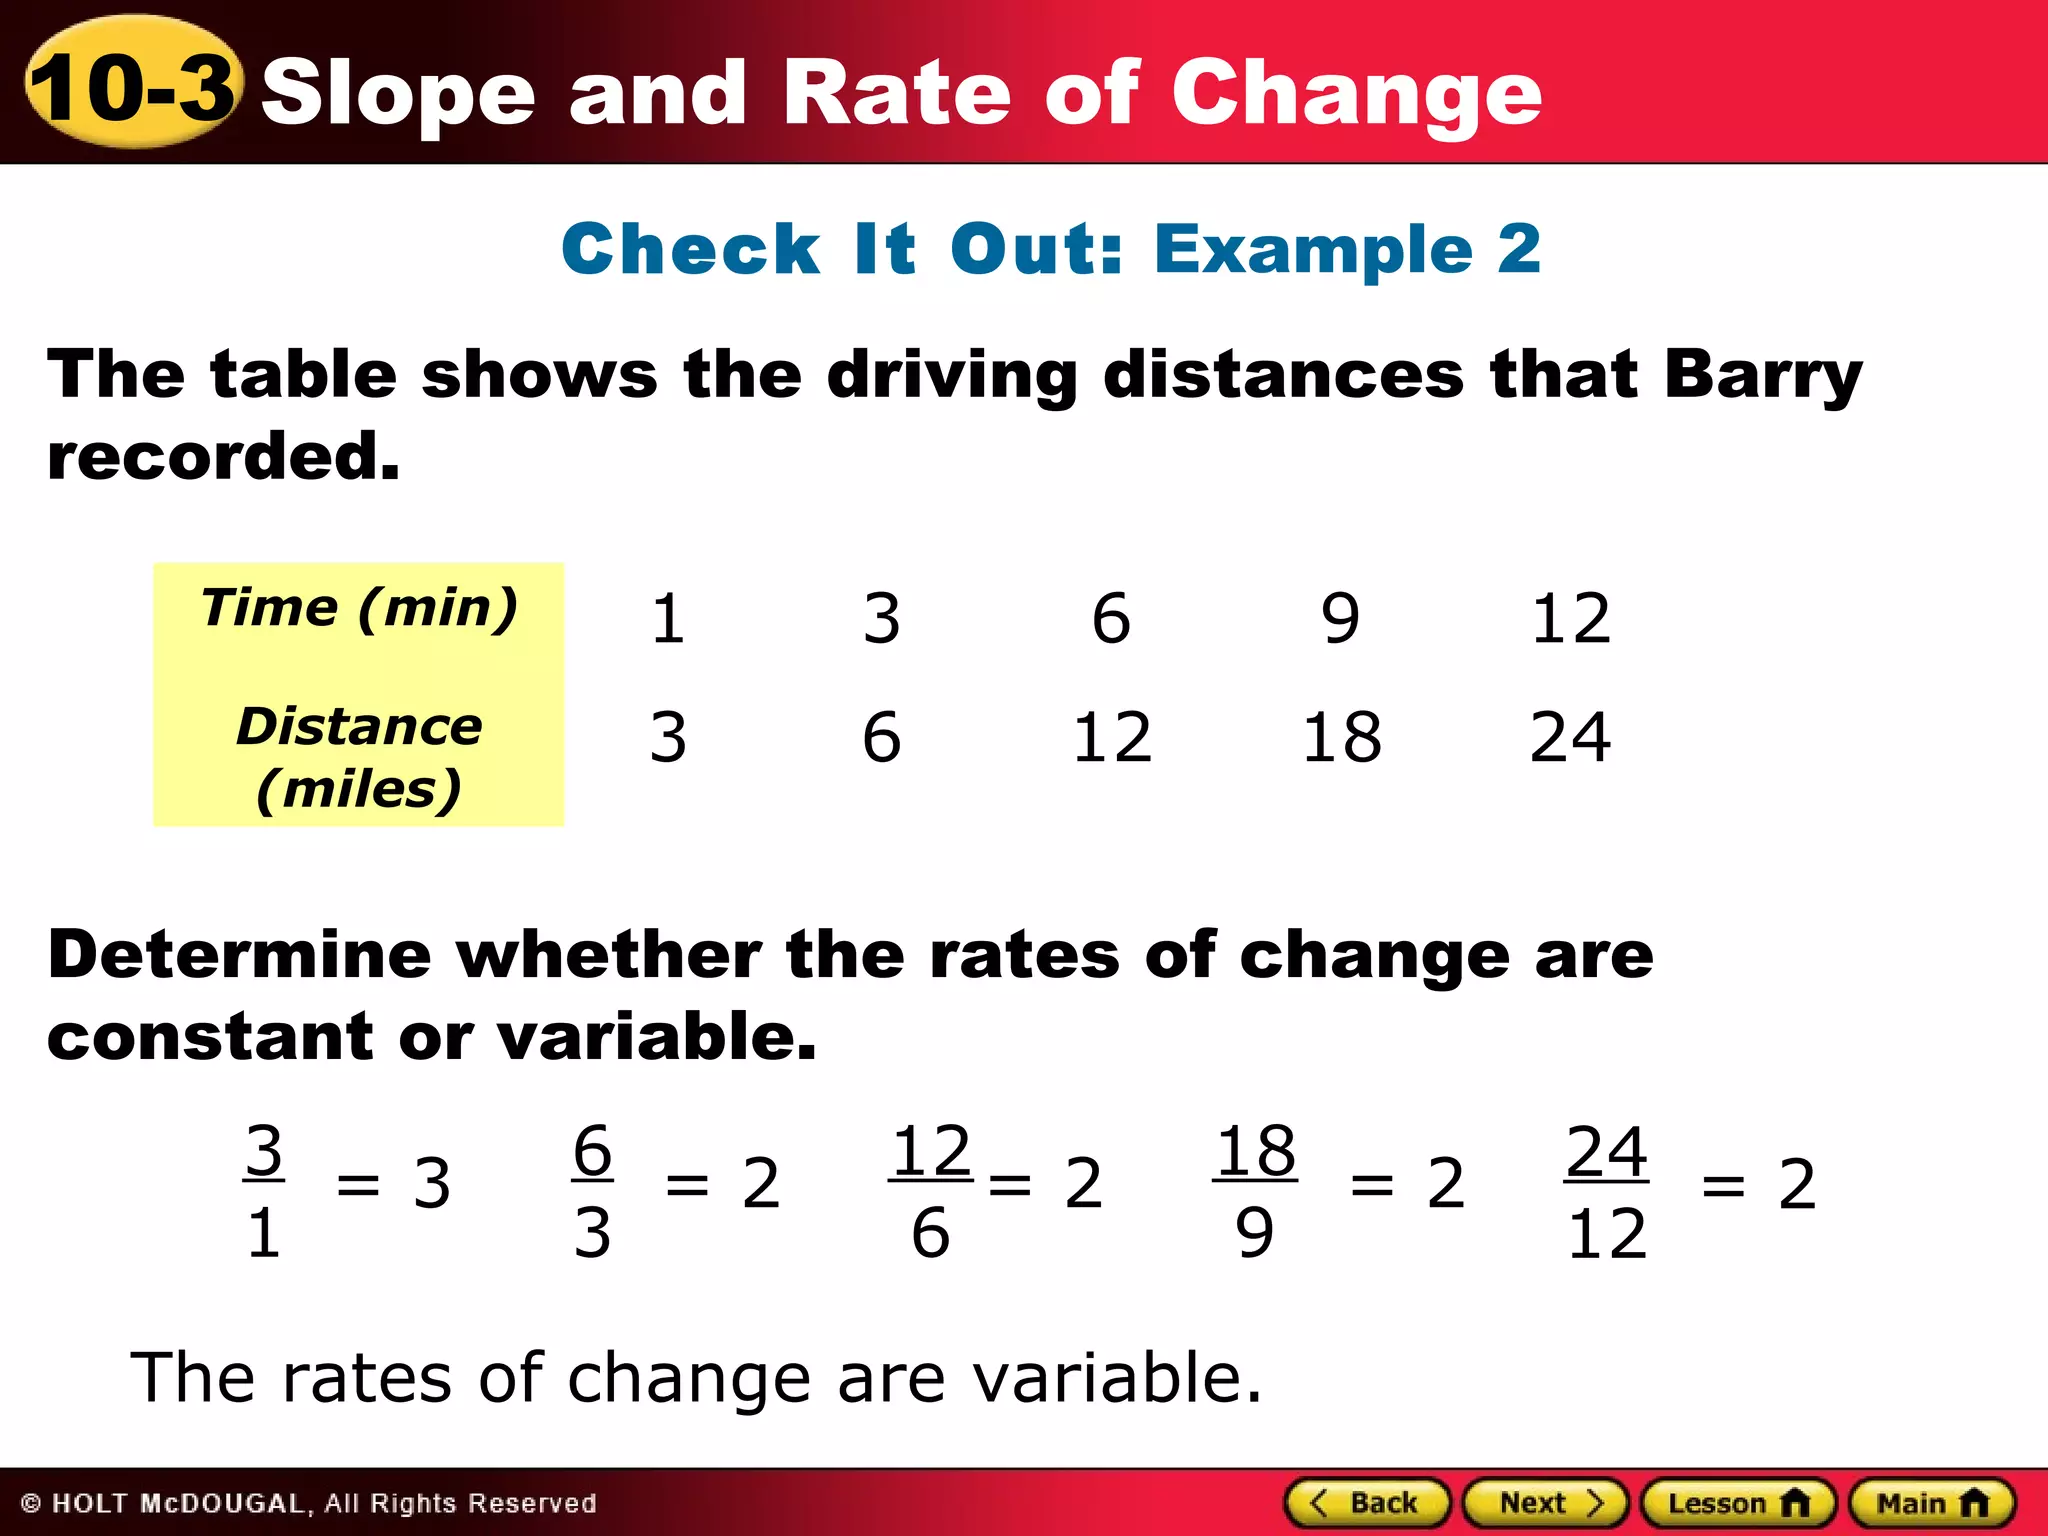
10-3 Slope and Rate of Change 
Learn to find rates of change and slopes.
10-3 Slope and Rate of Change 
Vocabulary 
rate of change 
slope
10-3 Slope and Rate of Change 
The rate of change of a function is a 
ratios that compares the difference 
between two output values to the 
difference between the corresponding 
input values.
10-3 Slope and Rate of Change 
Additional Example 1A: Using A Table to identify 
Rates of Change 
Tell whether the rates of change are constant or 
variable. 
Find the 
difference 
between 
consecutive data 
points. 
+2 +3 +1 +2 
x 2 4 7 8 10 
y 5 11 20 23 29 
+6 +9 +3 +6 
Find each ratio of the 
change in y to the 
change in x. 
The rate of change is constant.
10-3 Slope and Rate of Change 
Caution! 
Be careful to put the difference in y-values 
in the numerator and the differences in 
x-values in the denominator when you 
write a rate of change.
10-3 Slope and Rate of Change 
Additional Example 1B: Using A Table to identify 
Rates of Change 
Tell whether the rates of change are constant or 
variable. Find the 
difference 
between 
consecutive data 
points. 
+1 +1 +1 +1 
x 0 1 2 3 4 
y 0 3 5 8 10 
+3 +1 +3 +2 
Find each ratio of the 
change in y to the 
change in x. 
The rates of change are variable.
10-3 Slope and Rate of Change 
Check It Out: Example 1 
Tell whether the rates of change are constant or 
variable. 
Find the 
difference 
between 
consecutive data 
points. 
+2 +3 +1 +3 
x 0 2 5 6 9 
y 5 15 30 35 50 
+10 +15 +5 +15 
Find each ratio of the 
change in y to the 
change in x. 
The rate of change is constant.
10-3 Slope and Rate of Change 
When the rate of 
change is constant, 
the segments form 
a straight line. The 
constant rate of 
change of a line is 
its slope.
10-3 Slope and Rate of Change 
Reading Math 
Recall that a function whose graph is a 
straight line is a linear function.
10-3 Slope and Rate of Change 
Additional Example 2: Driving Application 
The table shows the driving distances that Jesse 
recorded. 
A. Determine whether the rates of change are 
constant or variable. 
The rate of change is constant.
10-3 Slope and Rate of Change 
Additional Example 2: Driving Application 
B. Graph the data and connect the points with 
line segments. If the rate of change is constant, 
find and interpret the slope. 
35 
The rate of change between 
any two points is . The 
slope of the line is . 35 
35 
The slope is . This means he drove 3 mi. every 5 min.
10-3 Slope and Rate of Change 
Check It Out: Example 2 
The table shows the driving distances that Barry 
recorded. 
Time (min) 1 3 6 9 12 
Distance 
3 6 12 18 24 
(miles) 
Determine whether the rates of change are 
constant or variable. 
31 
= 3 63 
= 2 12 
6 
= 2 18 
9 
The rates of change are variable. 
= 2 
24 
12 
= 2

Rate of change and slope

  • 1.
    10-3 Slope andRate of Change Learn to find rates of change and slopes.
  • 2.
    10-3 Slope andRate of Change Vocabulary rate of change slope
  • 3.
    10-3 Slope andRate of Change The rate of change of a function is a ratios that compares the difference between two output values to the difference between the corresponding input values.
  • 4.
    10-3 Slope andRate of Change Additional Example 1A: Using A Table to identify Rates of Change Tell whether the rates of change are constant or variable. Find the difference between consecutive data points. +2 +3 +1 +2 x 2 4 7 8 10 y 5 11 20 23 29 +6 +9 +3 +6 Find each ratio of the change in y to the change in x. The rate of change is constant.
  • 5.
    10-3 Slope andRate of Change Caution! Be careful to put the difference in y-values in the numerator and the differences in x-values in the denominator when you write a rate of change.
  • 6.
    10-3 Slope andRate of Change Additional Example 1B: Using A Table to identify Rates of Change Tell whether the rates of change are constant or variable. Find the difference between consecutive data points. +1 +1 +1 +1 x 0 1 2 3 4 y 0 3 5 8 10 +3 +1 +3 +2 Find each ratio of the change in y to the change in x. The rates of change are variable.
  • 7.
    10-3 Slope andRate of Change Check It Out: Example 1 Tell whether the rates of change are constant or variable. Find the difference between consecutive data points. +2 +3 +1 +3 x 0 2 5 6 9 y 5 15 30 35 50 +10 +15 +5 +15 Find each ratio of the change in y to the change in x. The rate of change is constant.
  • 8.
    10-3 Slope andRate of Change When the rate of change is constant, the segments form a straight line. The constant rate of change of a line is its slope.
  • 9.
    10-3 Slope andRate of Change Reading Math Recall that a function whose graph is a straight line is a linear function.
  • 10.
    10-3 Slope andRate of Change Additional Example 2: Driving Application The table shows the driving distances that Jesse recorded. A. Determine whether the rates of change are constant or variable. The rate of change is constant.
  • 11.
    10-3 Slope andRate of Change Additional Example 2: Driving Application B. Graph the data and connect the points with line segments. If the rate of change is constant, find and interpret the slope. 35 The rate of change between any two points is . The slope of the line is . 35 35 The slope is . This means he drove 3 mi. every 5 min.
  • 12.
    10-3 Slope andRate of Change Check It Out: Example 2 The table shows the driving distances that Barry recorded. Time (min) 1 3 6 9 12 Distance 3 6 12 18 24 (miles) Determine whether the rates of change are constant or variable. 31 = 3 63 = 2 12 6 = 2 18 9 The rates of change are variable. = 2 24 12 = 2