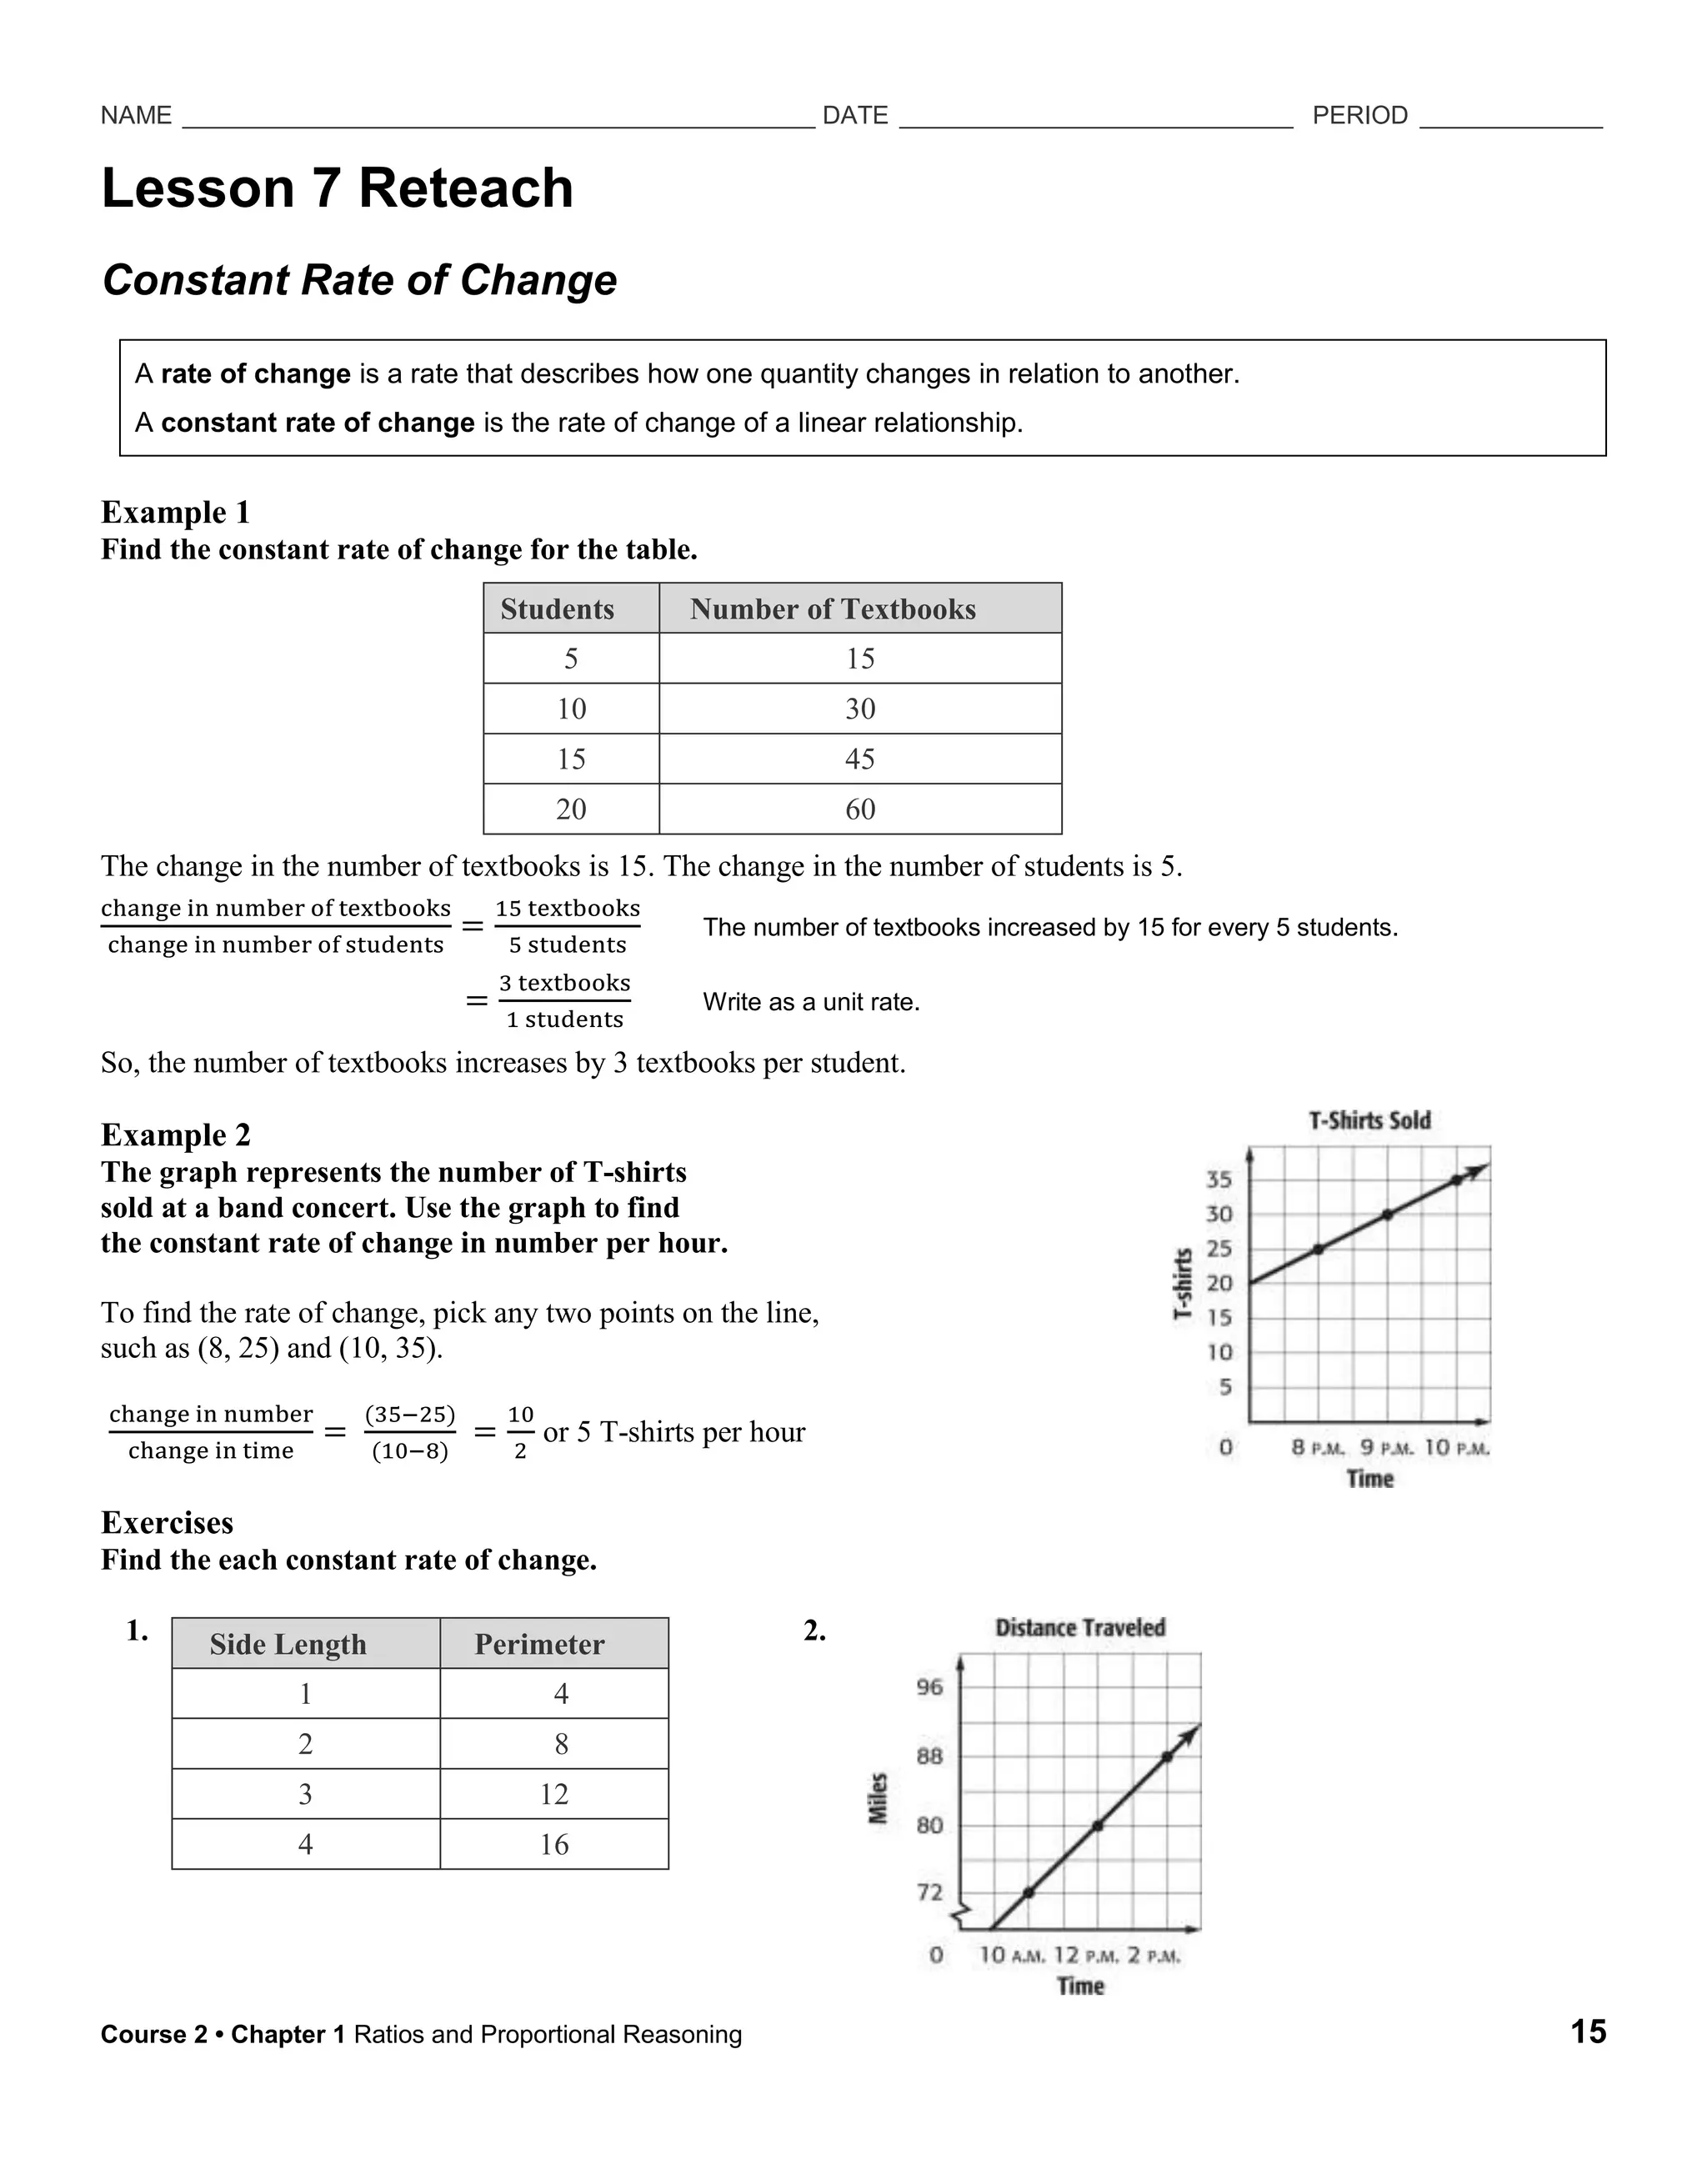
NAME _____________________________________________ DATE ____________________________ PERIOD _____________ 
Lesson 7 Reteach 
Constant Rate of Change 
A rate of change is a rate that describes how one quantity changes in relation to another. 
A constant rate of change is the rate of change of a linear relationship. 
Example 1 
Find the constant rate of change for the table. 
Students Number of Textbooks 
5 15 
10 30 
15 45 
20 60 
The change in the number of textbooks is 15. The change in the number of students is 5. 
change in number of textbooks 
15 textbooks 
= 
change in number of students 
5 students 
The number of textbooks increased by 15 for every 5 students. 
= 
3 textbooks 
1 students 
Write as a unit rate. 
So, the number of textbooks increases by 3 textbooks per student. 
Example 2 
The graph represents the number of T-shirts 
sold at a band concert. Use the graph to find 
the constant rate of change in number per hour. 
To find the rate of change, pick any two points on the line, 
such as (8, 25) and (10, 35). 
change in number 
change in time 
= 
(35−25) 
(10−8) 
= 
10 
2 
or 5 T-shirts per hour 
Exercises 
Find the each constant rate of change. 
1. 2. 
Side Length Perimeter 
1 4 
2 8 
3 12 
4 16 
Course 2 • Chapter 1 Ratios and Proportional Reasoning 15

Reteach constant rate of change

  • 1.
    NAME _____________________________________________ DATE____________________________ PERIOD _____________ Lesson 7 Reteach Constant Rate of Change A rate of change is a rate that describes how one quantity changes in relation to another. A constant rate of change is the rate of change of a linear relationship. Example 1 Find the constant rate of change for the table. Students Number of Textbooks 5 15 10 30 15 45 20 60 The change in the number of textbooks is 15. The change in the number of students is 5. change in number of textbooks 15 textbooks = change in number of students 5 students The number of textbooks increased by 15 for every 5 students. = 3 textbooks 1 students Write as a unit rate. So, the number of textbooks increases by 3 textbooks per student. Example 2 The graph represents the number of T-shirts sold at a band concert. Use the graph to find the constant rate of change in number per hour. To find the rate of change, pick any two points on the line, such as (8, 25) and (10, 35). change in number change in time = (35−25) (10−8) = 10 2 or 5 T-shirts per hour Exercises Find the each constant rate of change. 1. 2. Side Length Perimeter 1 4 2 8 3 12 4 16 Course 2 • Chapter 1 Ratios and Proportional Reasoning 15