Downloaded 146 times


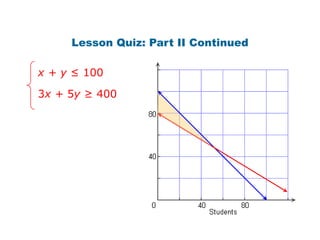

Here is the system of inequalities for the cross-country team problem: Let x = number of water bottles sold to students Let y = number of water bottles sold to others x + y ≤ 100 (they have 100 bottles total) 3x + 5y ≥ 400 (they need at least $400) Graph the regions defined by these inequalities and the overlapping region is the solution.


![7.9 notes[1]](https://cdn.slidesharecdn.com/ss_thumbnails/7-9notes1-130121125633-phpapp02-thumbnail.jpg?width=640&height=640&fit=bounds)


