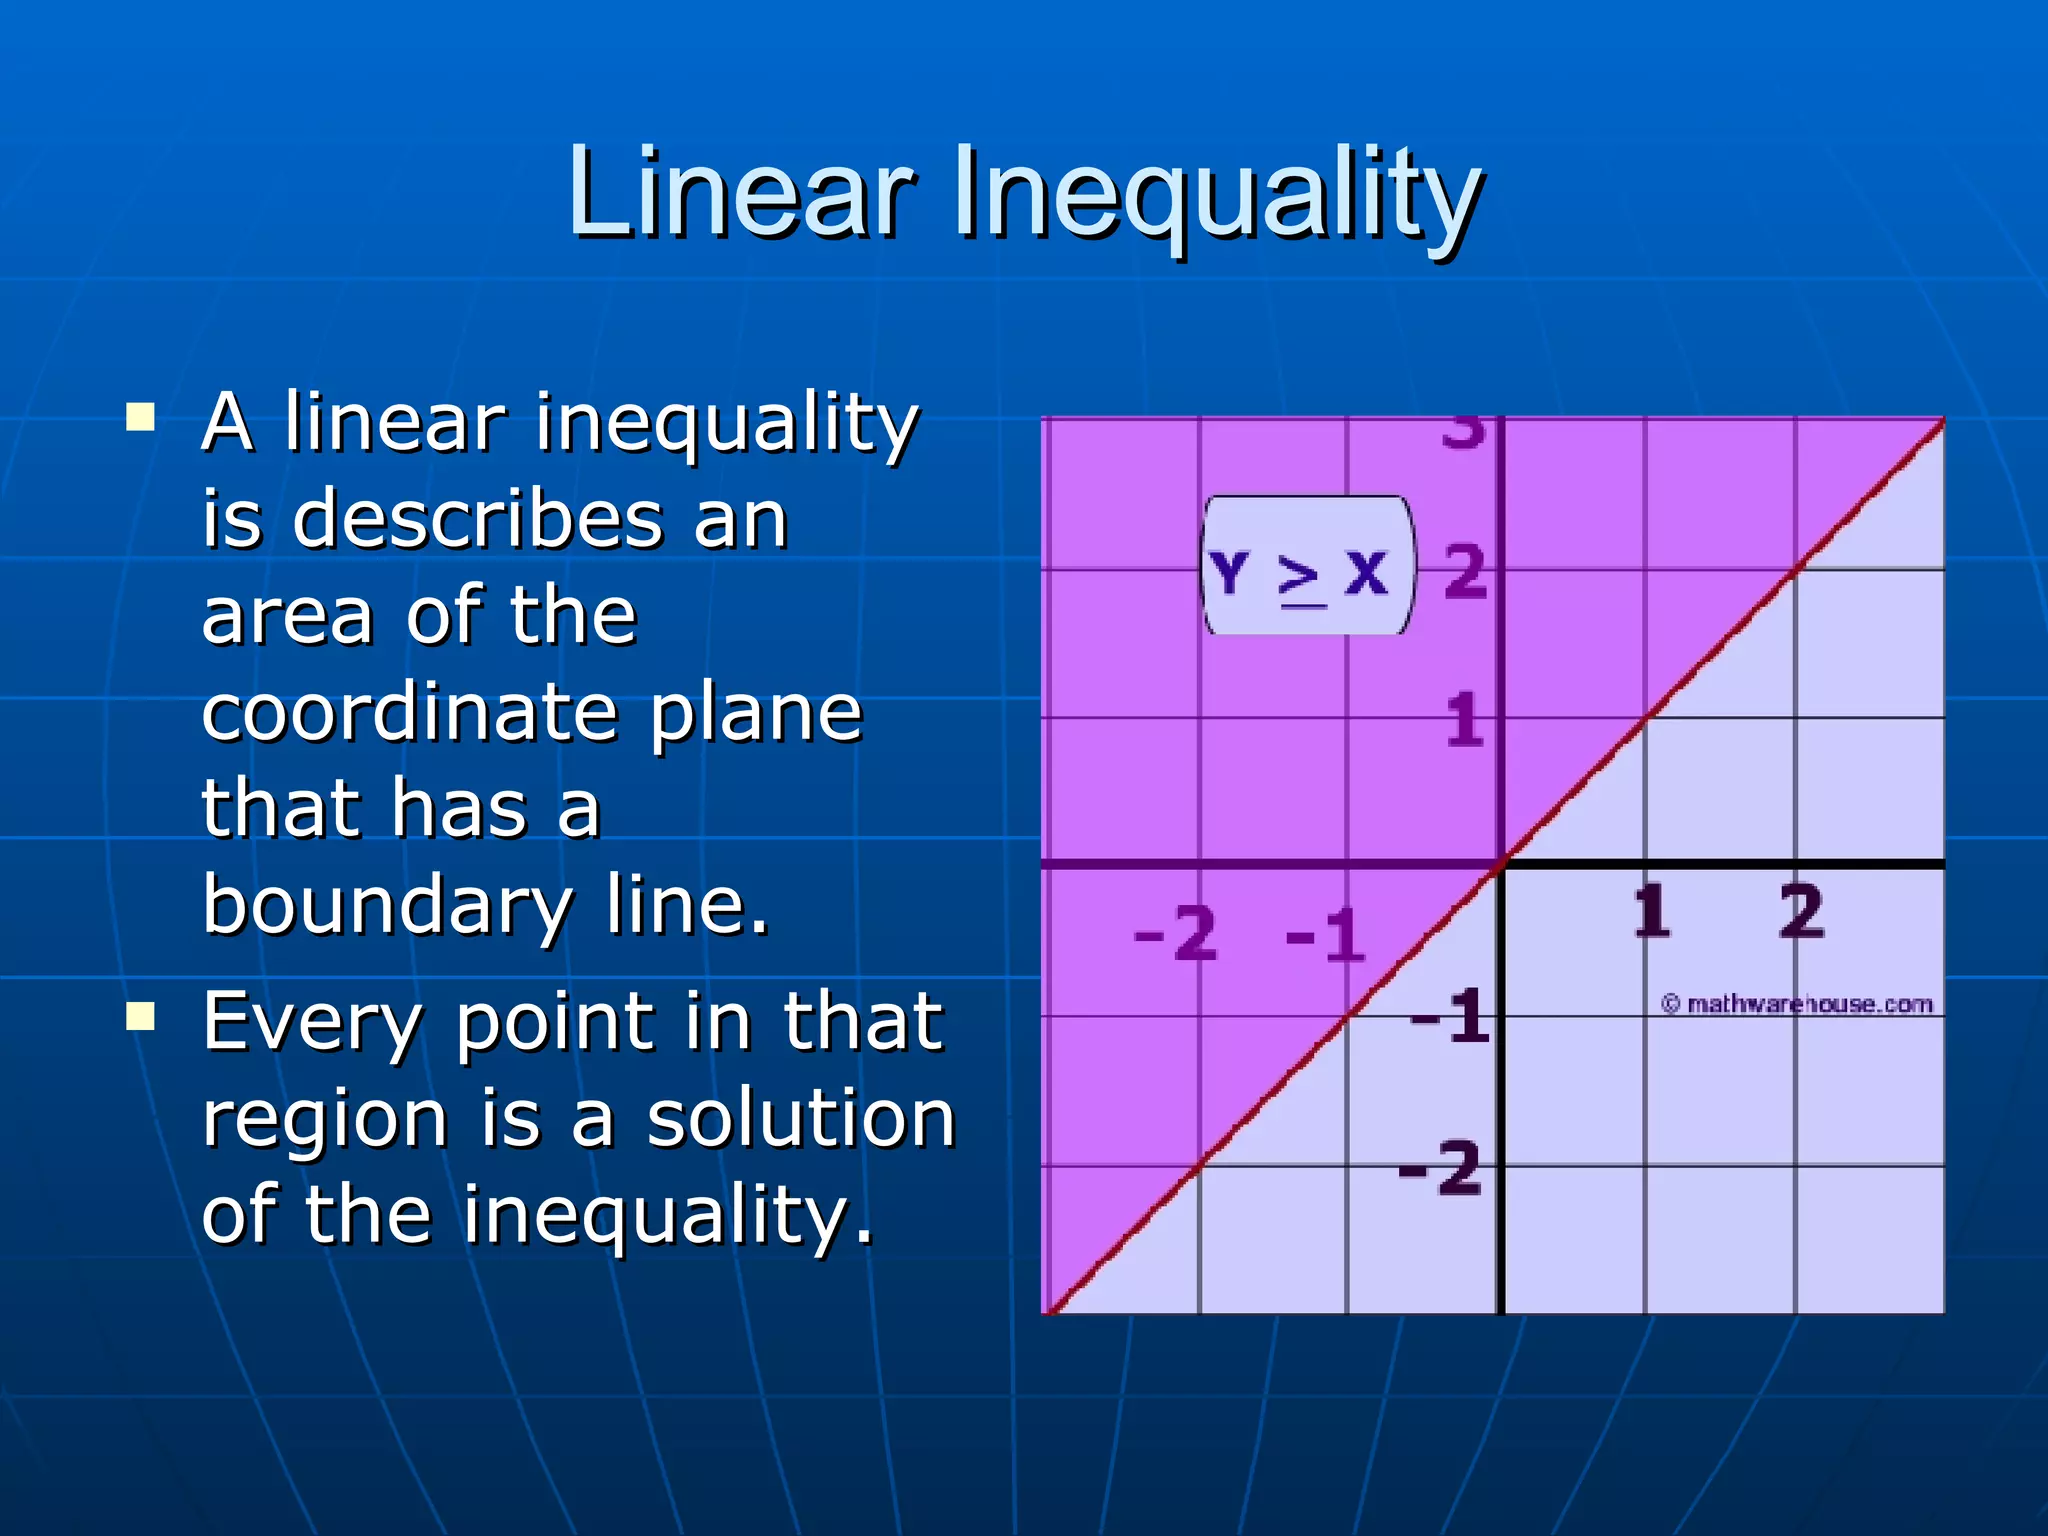
- A linear inequality describes a region of the coordinate plane bounded by a line. Any point in the shaded region is a solution to the inequality.
- To graph a linear inequality, first solve it for y and graph the resulting equation as a line. Then, test a point not on the line to determine which side of the line to shade based on whether it satisfies the inequality.
- The line is drawn solid for ≤ or ≥ and dashed for < or >. Shading the correct side of the line indicates the full solution set of the inequality.