This document provides information about solving and graphing inequalities. It defines inequalities and the symbols used such as <, ≤, >, ≥. It explains that inequalities have solutions that satisfy the given condition, unlike equations which have specific values. The document shows how to solve different types of inequalities algebraically by adding or subtracting from both sides and how to determine the direction of the shading or dashed line when graphing the solutions on a number line. It also discusses absolute value inequalities and graphing linear inequalities in two variables.
Overview of solving and graphing inequalities in Chapter 6.
Definition and examples of inequalities: 'less than', 'greater than', includes number line positions.
Introduction to graphing inequalities, covering terms and visual representation with circles.
Examples of inequality representations and visual direction on the number line.
Processes to solve inequalities with examples on finding solutions and representing them.
Instructions on reversing inequality signs during multiplication/division by negative numbers.
More practice examples are provided for solving inequalities, emphasizing sign reversal.
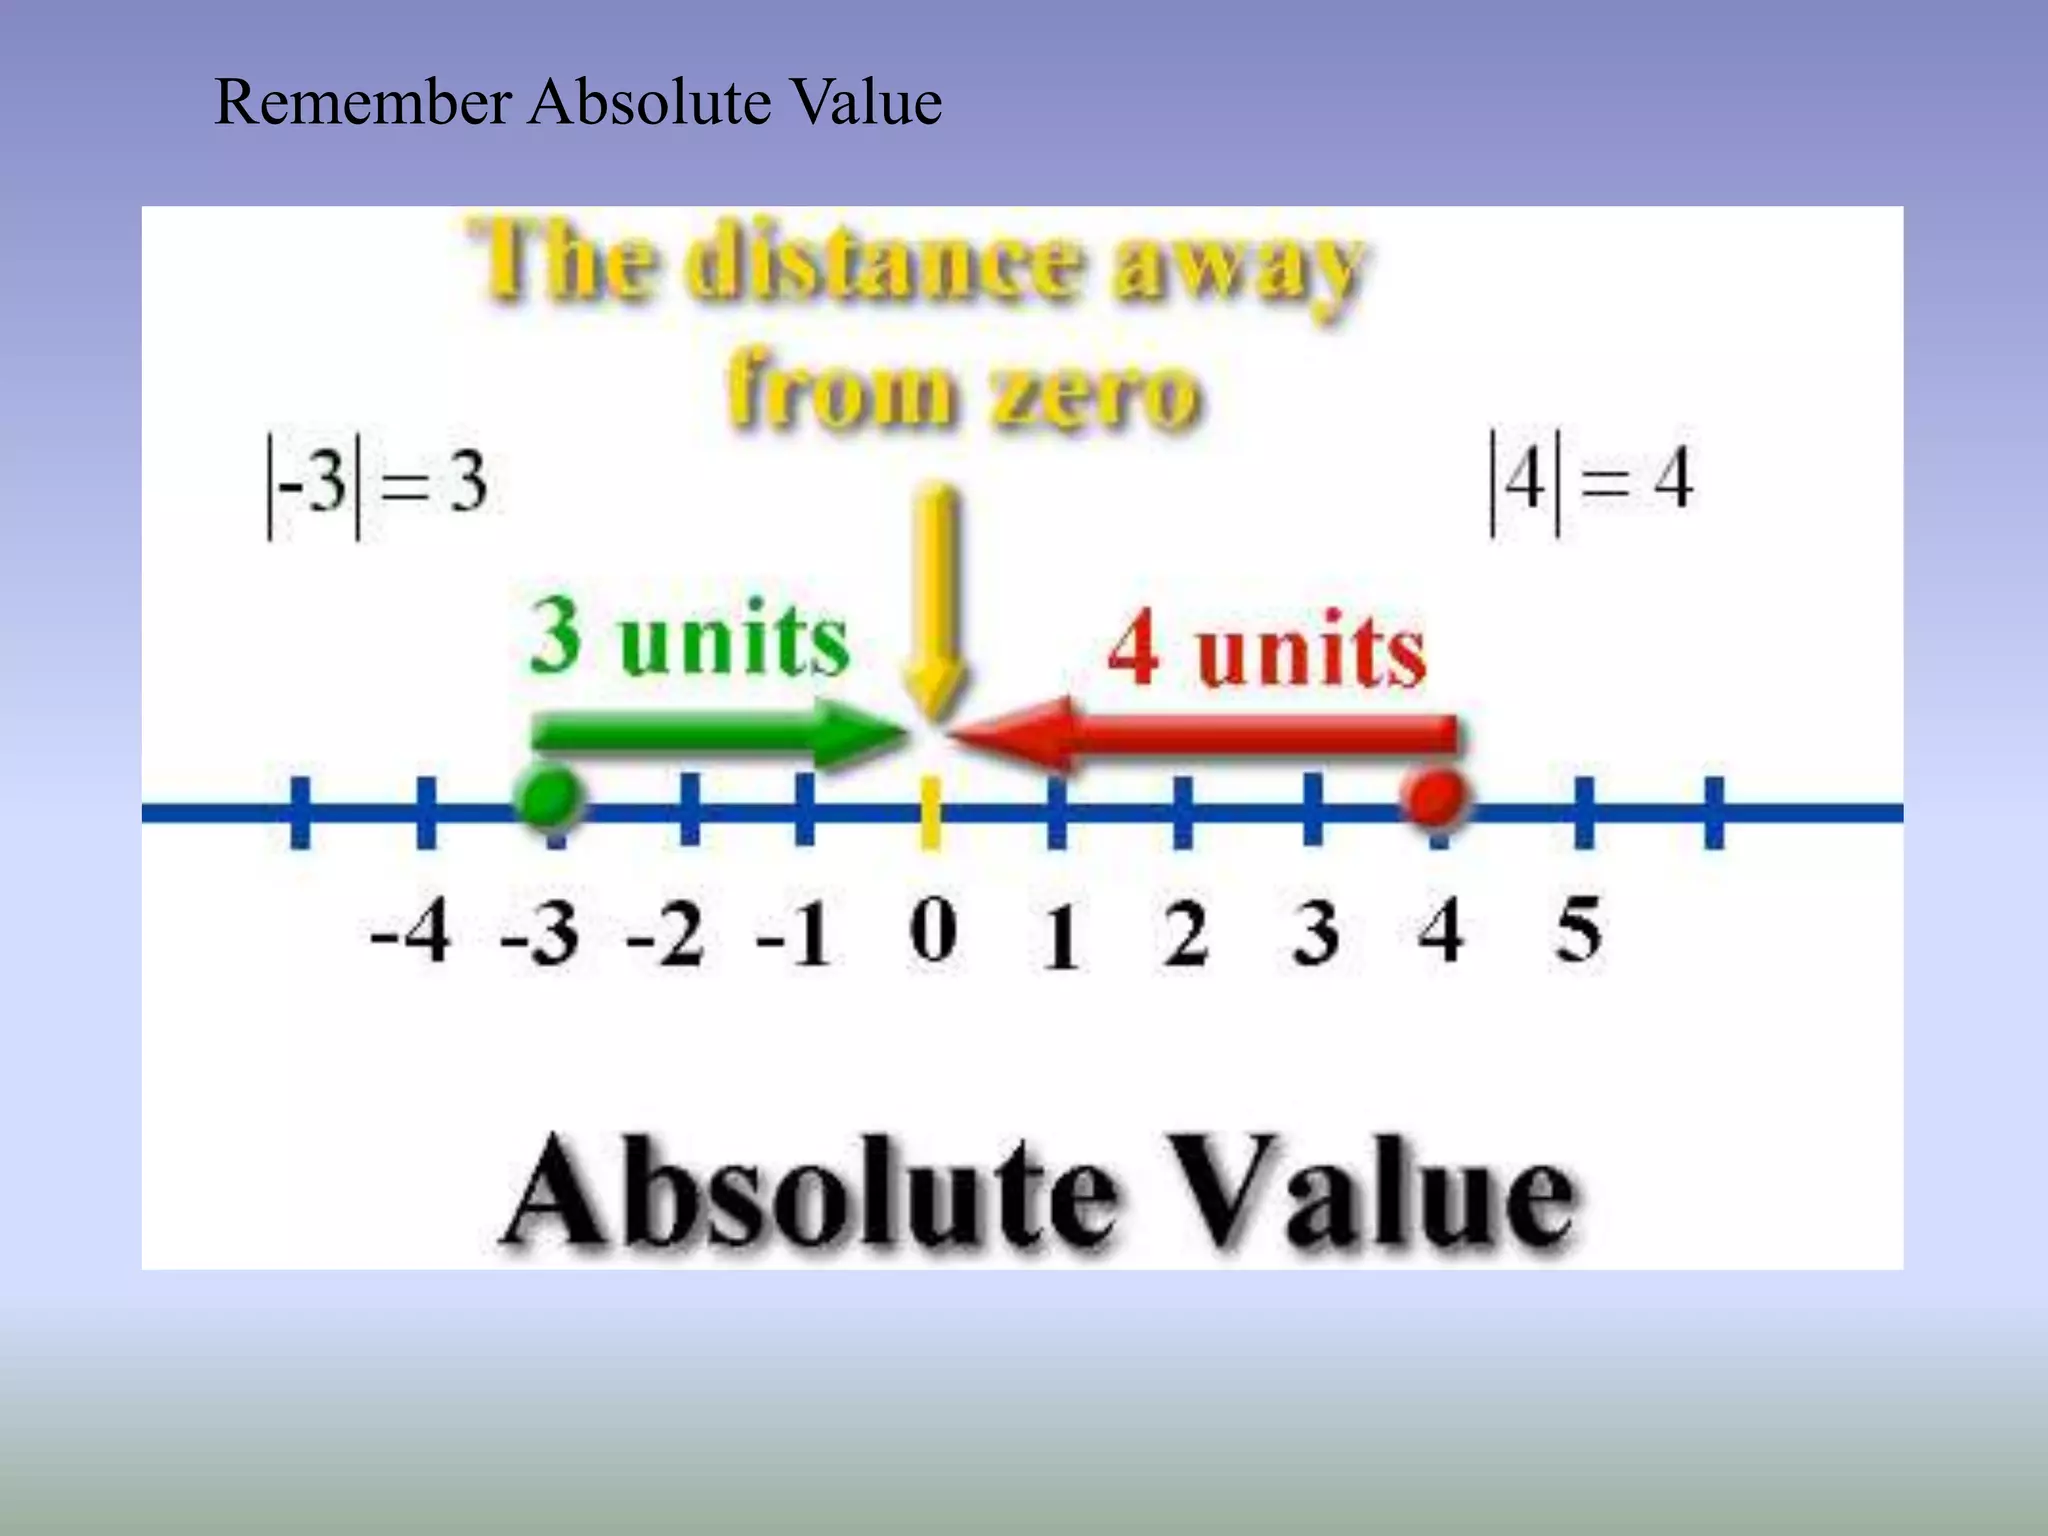
Introduction to graphing inequalities and importance of considering absolute value.
Steps for solving equations involving absolute values, distinguishing 'and' or 'or' statements.
Examples of absolute value inequalities showcasing possible and impossible scenarios.Graphing techniques for linear inequalities in two variables, including shading guidelines.
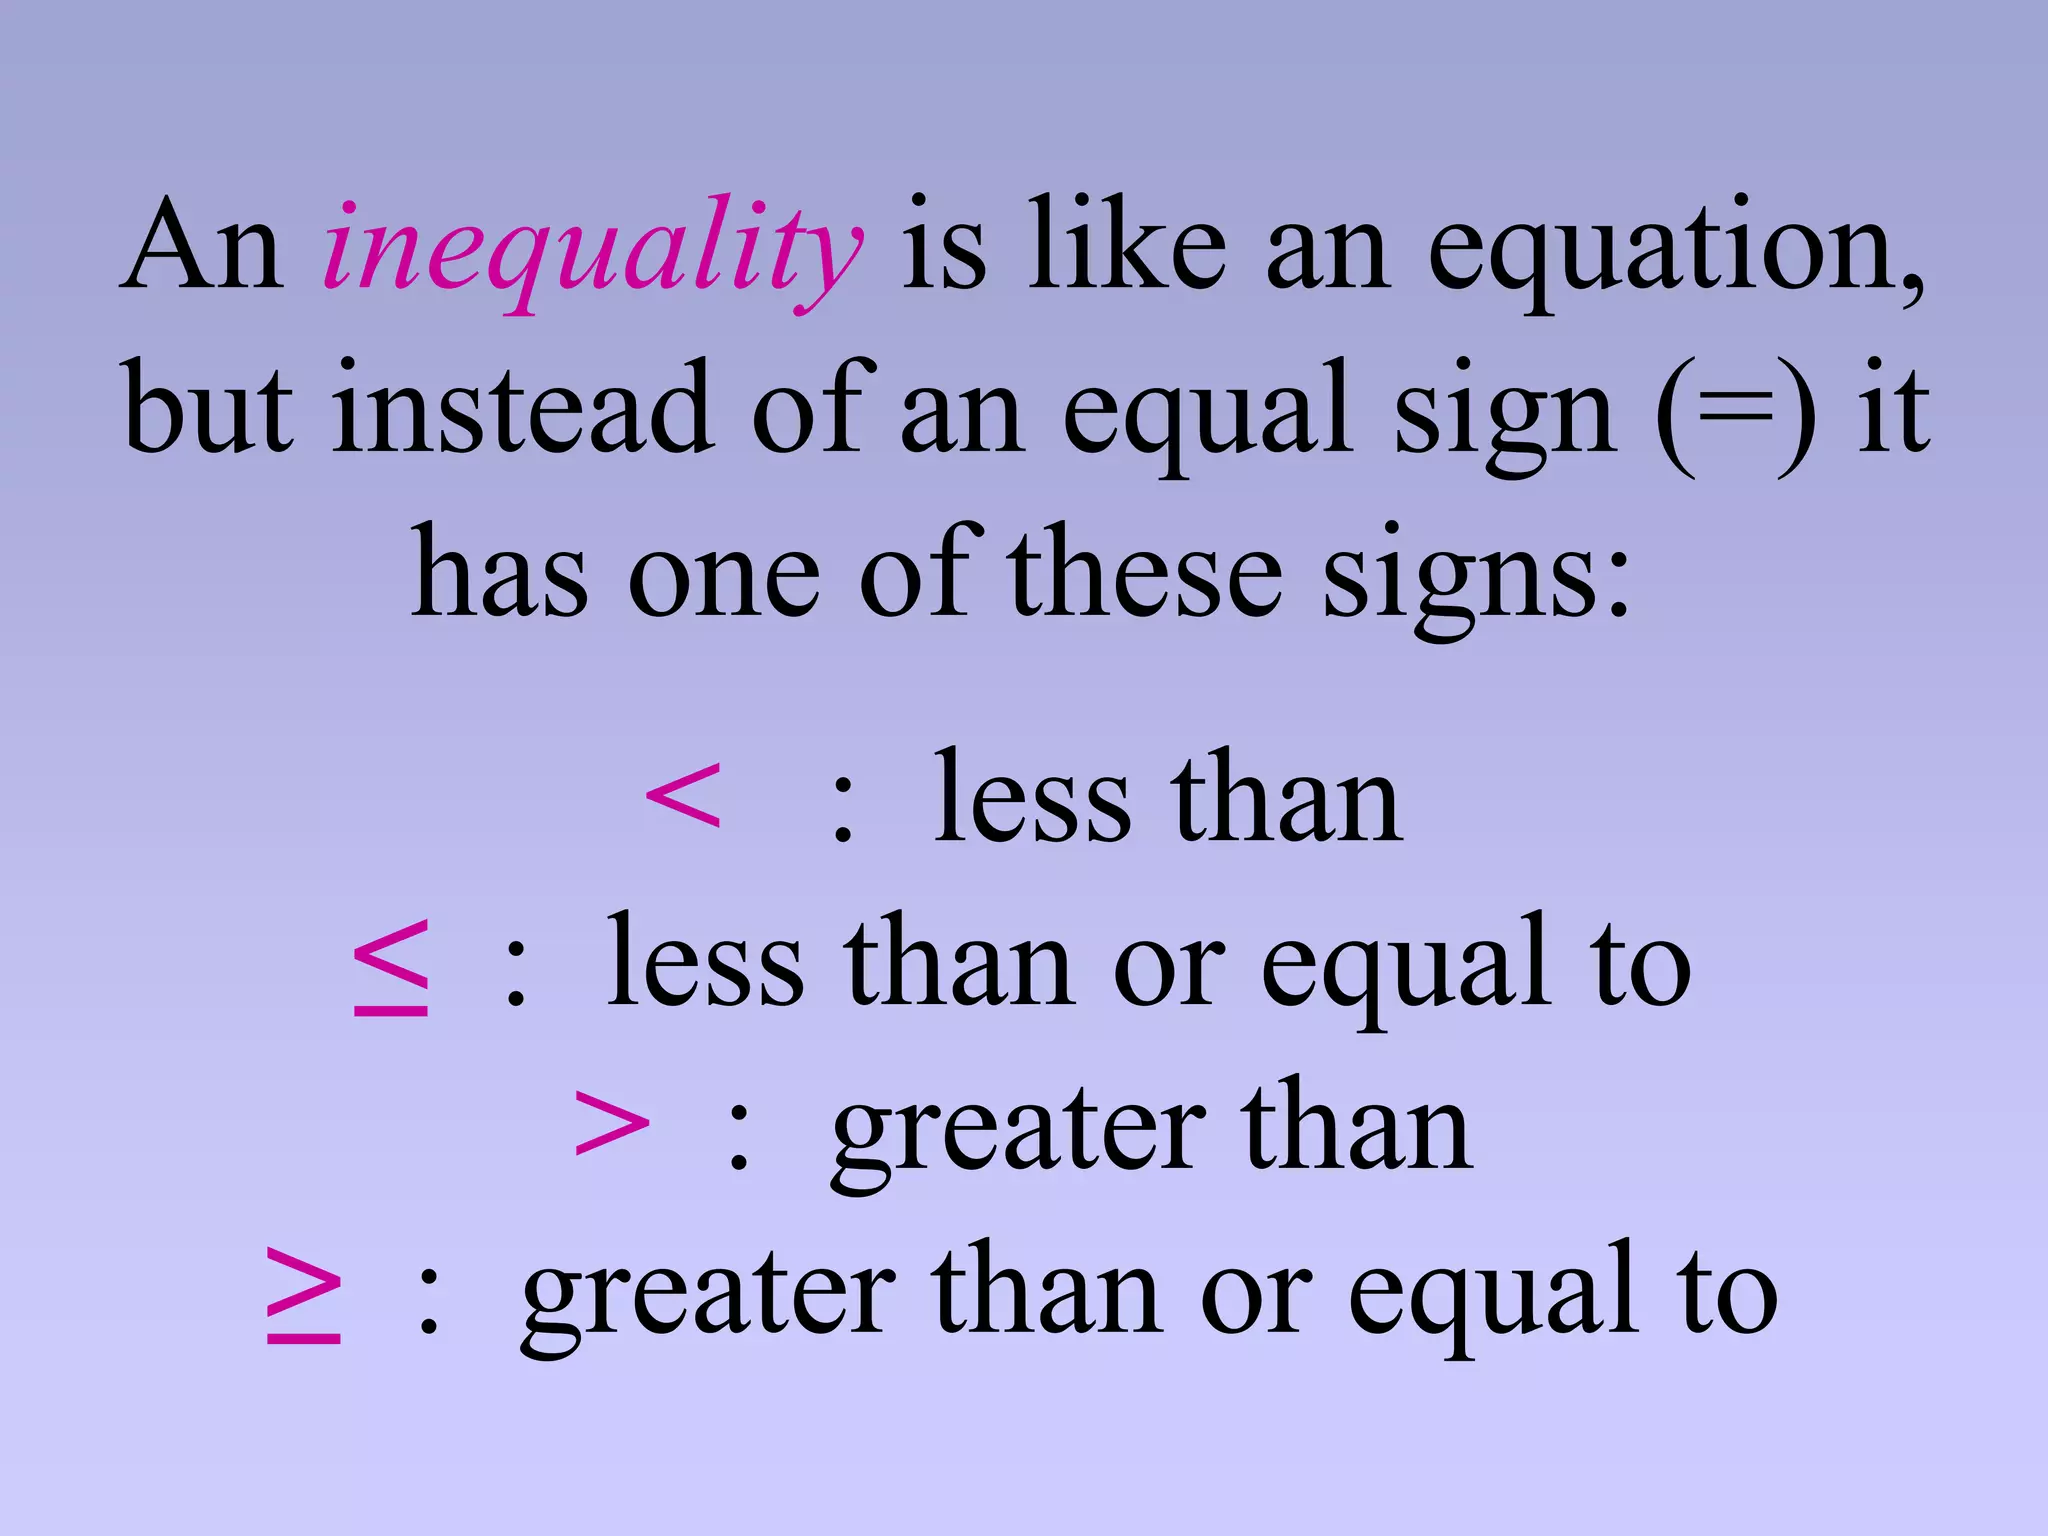
An inequality islike an equation,
but instead of an equal sign (=) it
has one of these signs:
< : less than
≤ : less than or equal to
> : greater than
≥ : greater than or equal to
3.
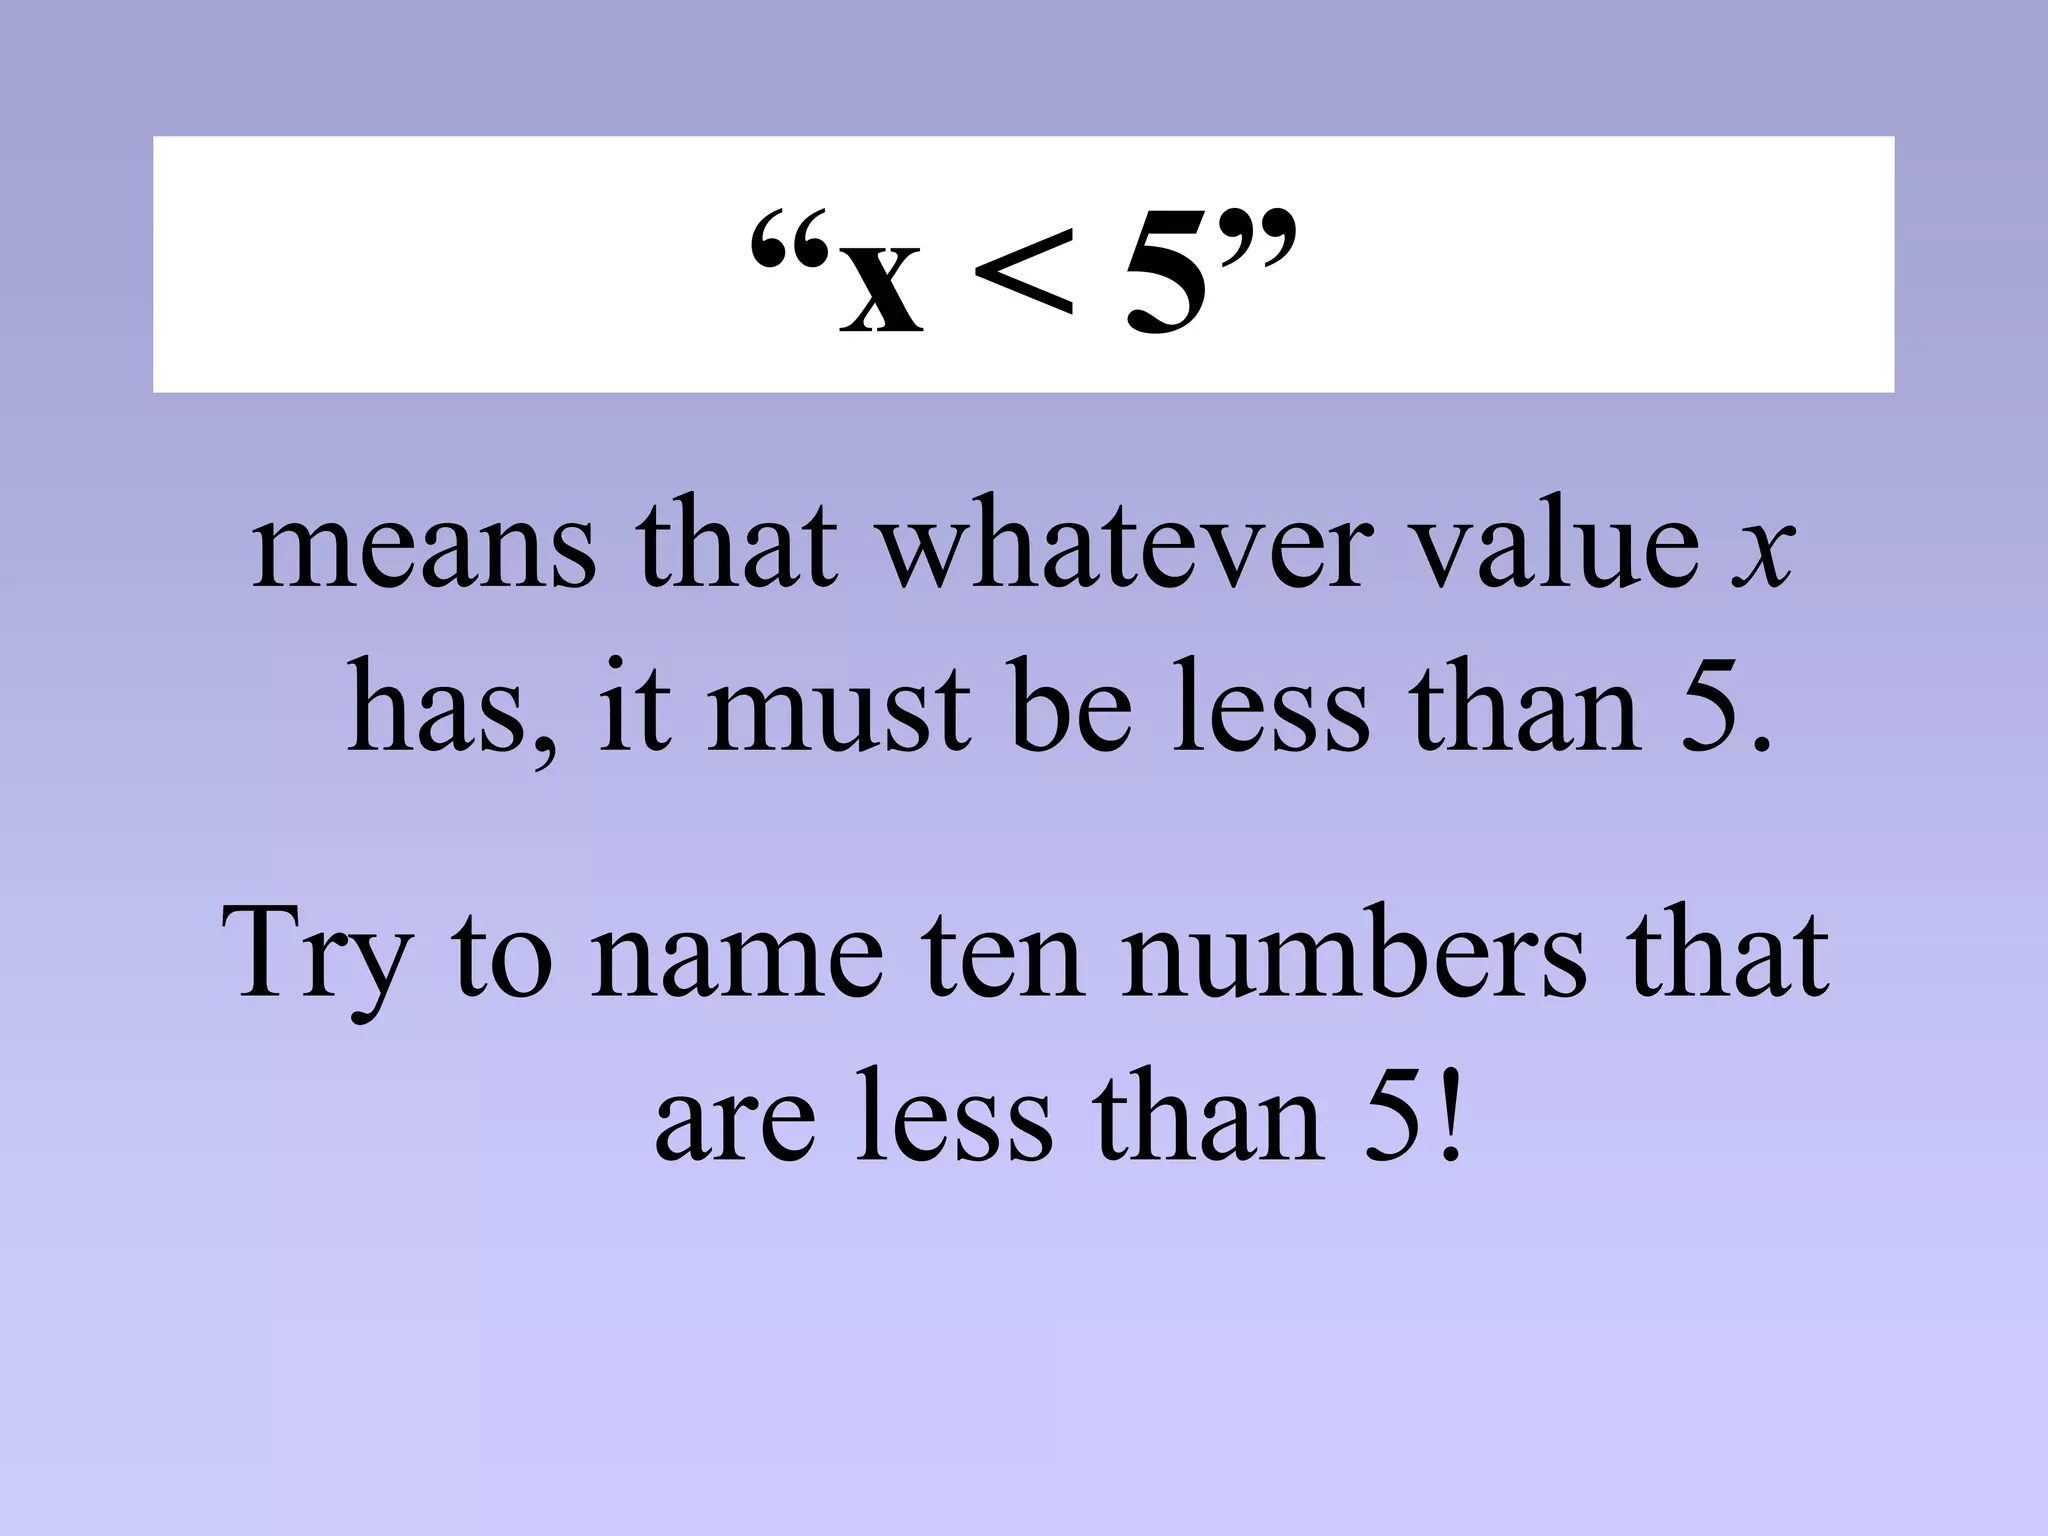
“x < 5”
meansthat whatever value x
has, it must be less than 5.
Try to name ten numbers that
are less than 5!
4.
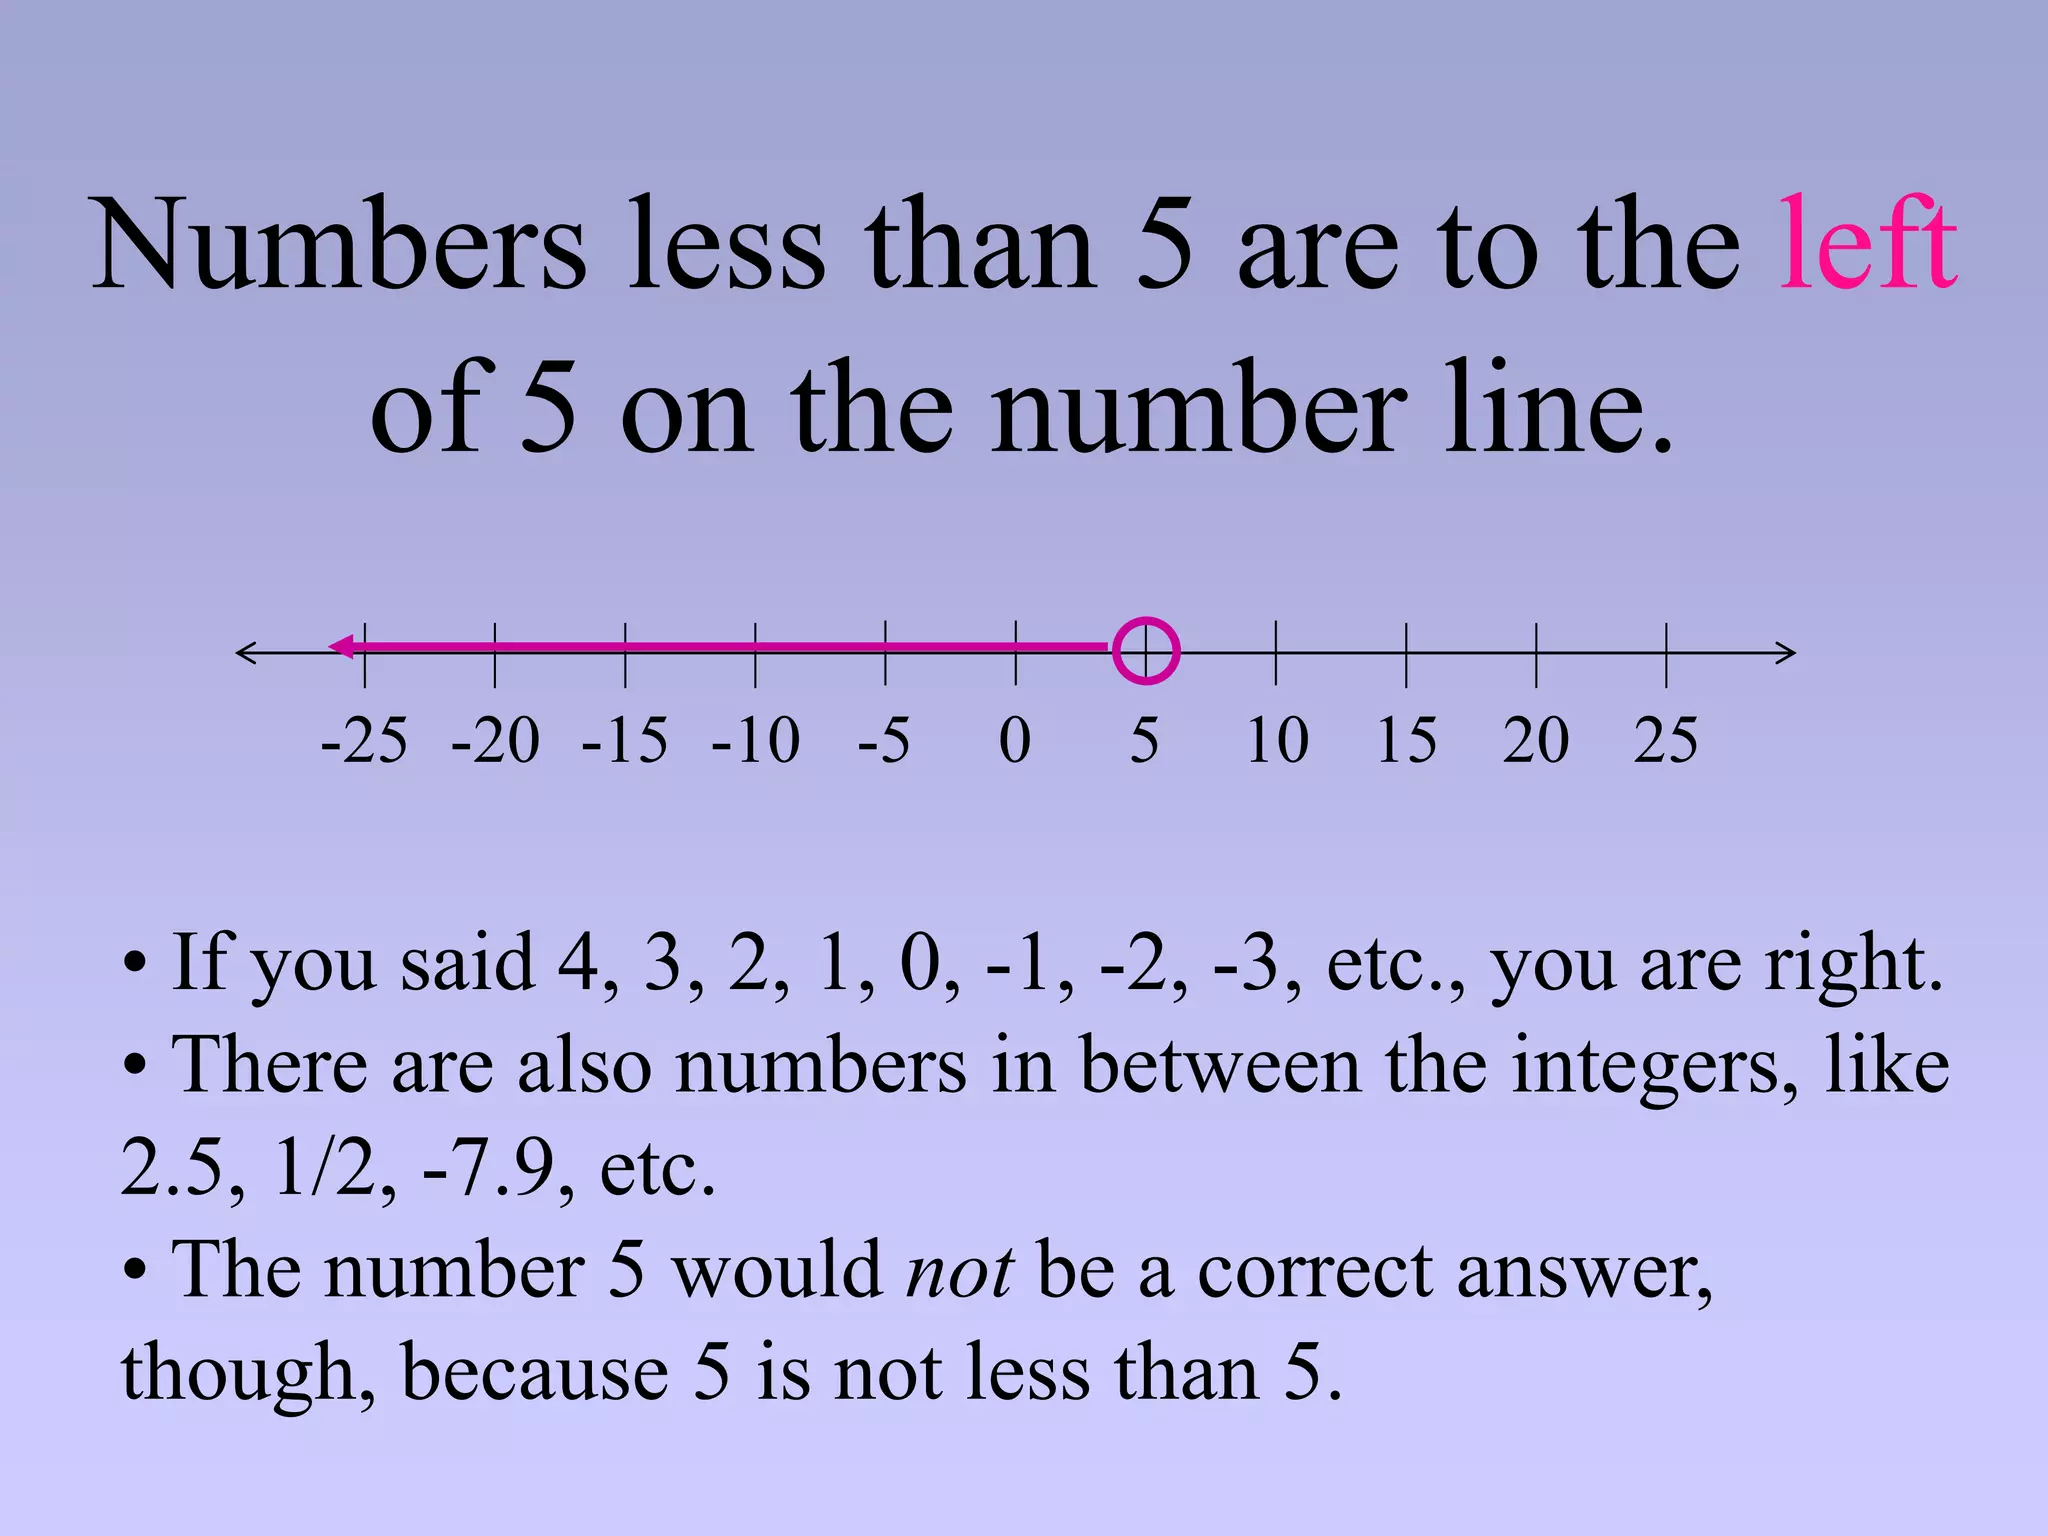
Numbers less than5 are to the left
of 5 on the number line.
0 5 10 15
-20 -15 -10 -5
-25 20 25
• If you said 4, 3, 2, 1, 0, -1, -2, -3, etc., you are right.
• There are also numbers in between the integers, like
2.5, 1/2, -7.9, etc.
• The number 5 would not be a correct answer,
though, because 5 is not less than 5.
5.
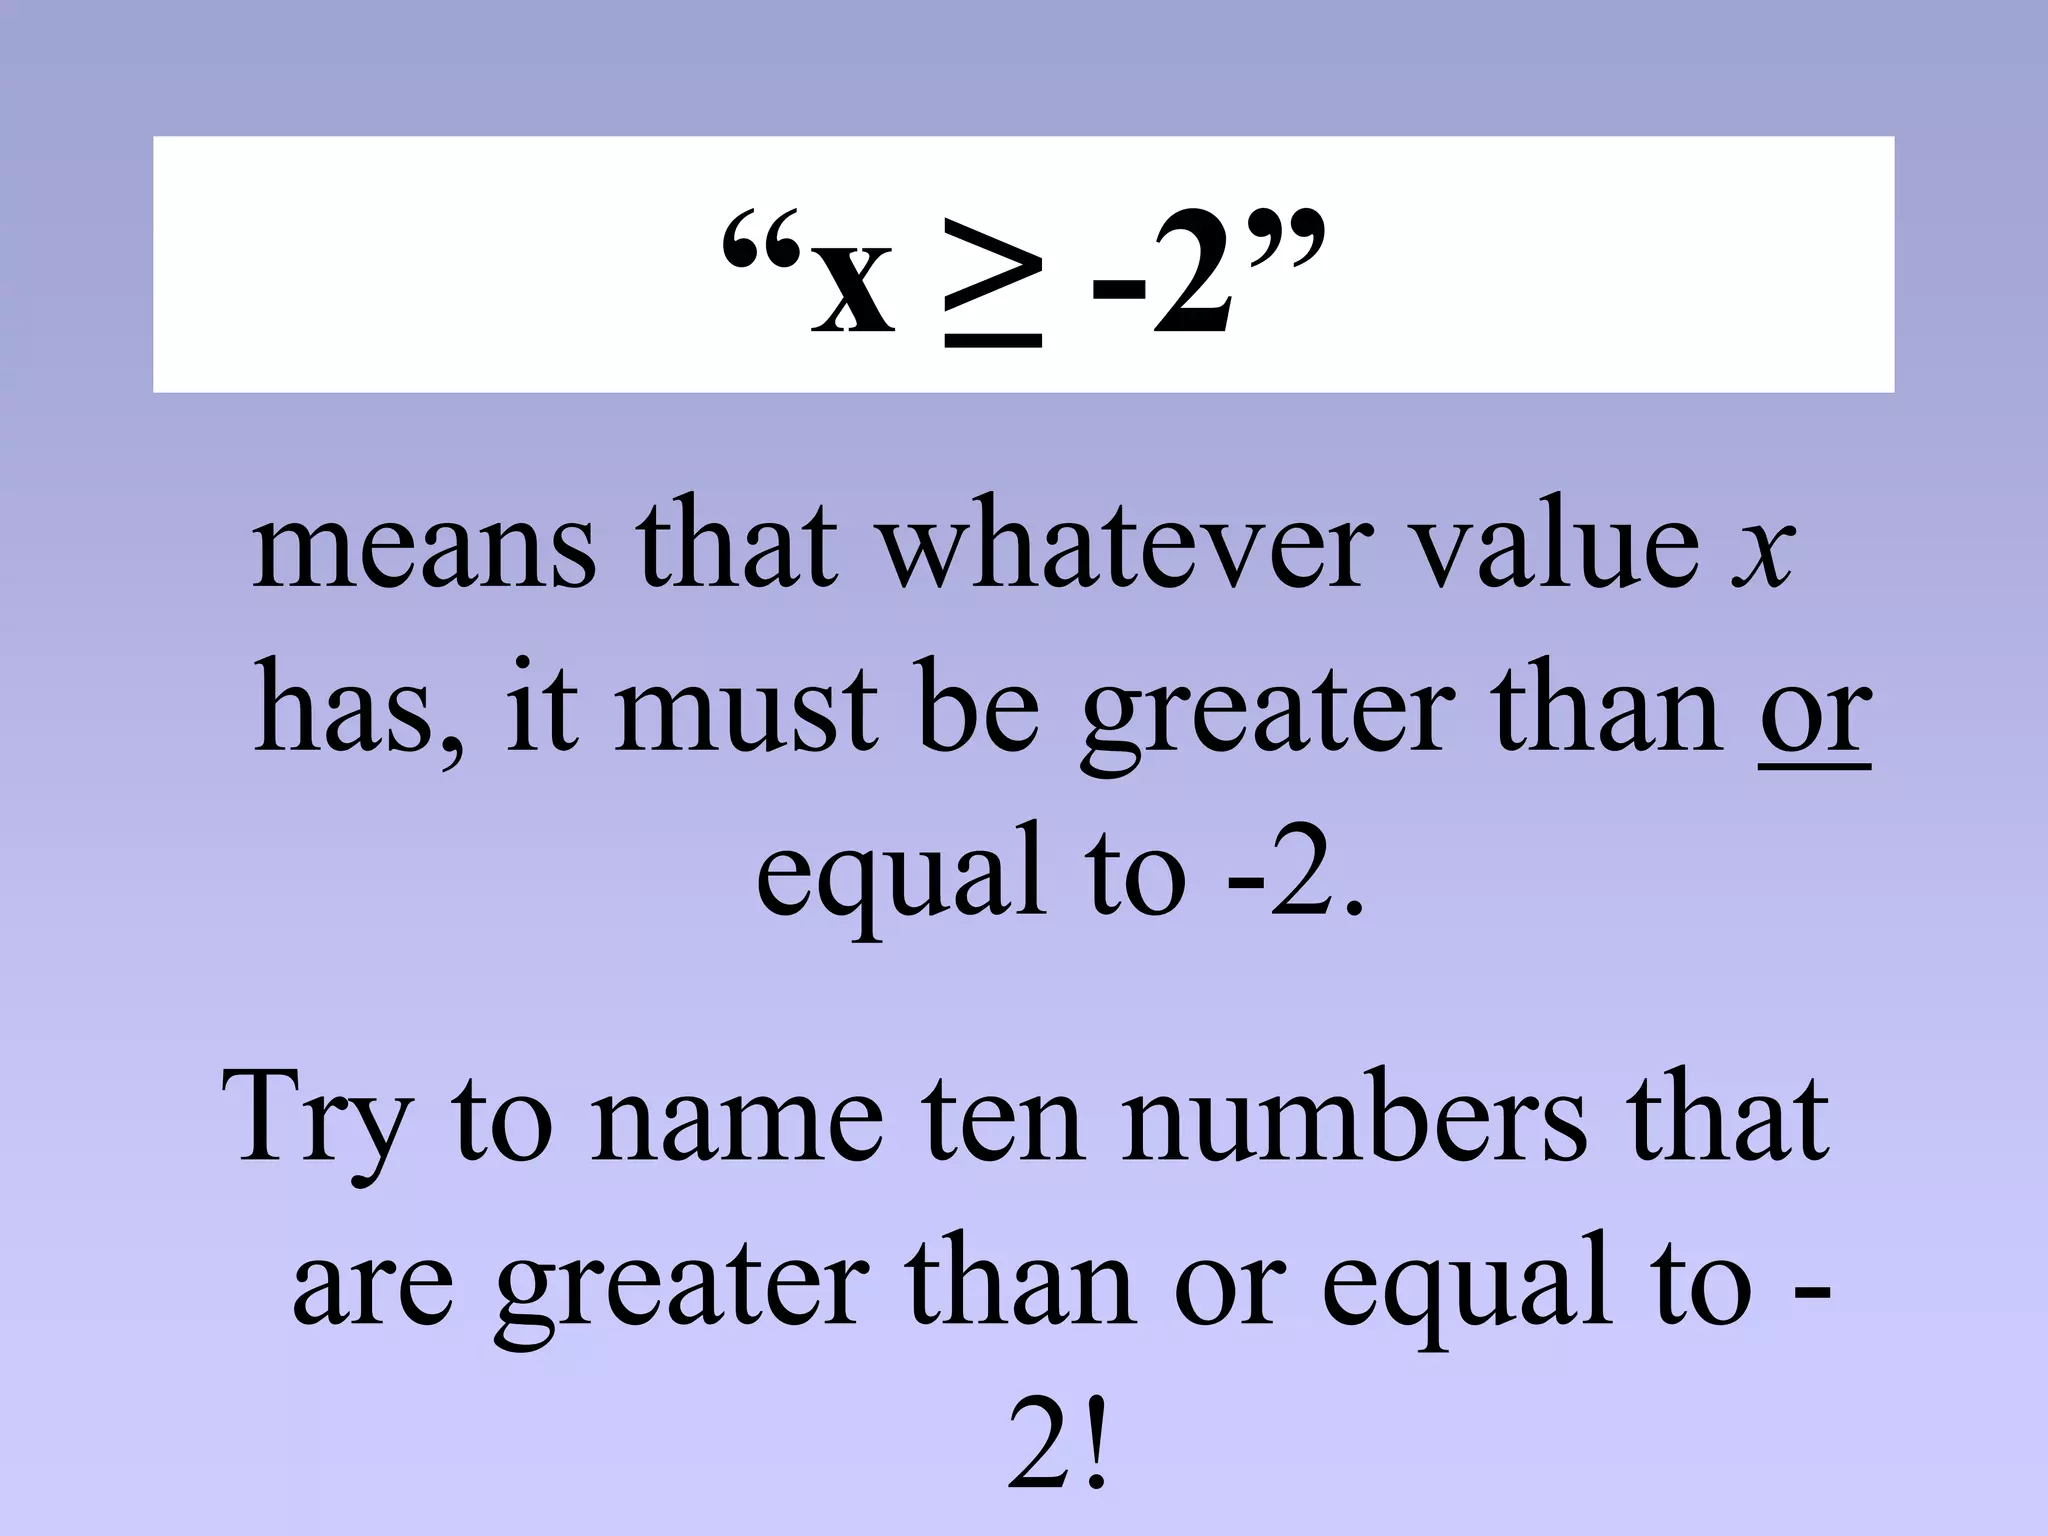
“x ≥ -2”
meansthat whatever value x
has, it must be greater than or
equal to -2.
Try to name ten numbers that
are greater than or equal to -
2!
6.
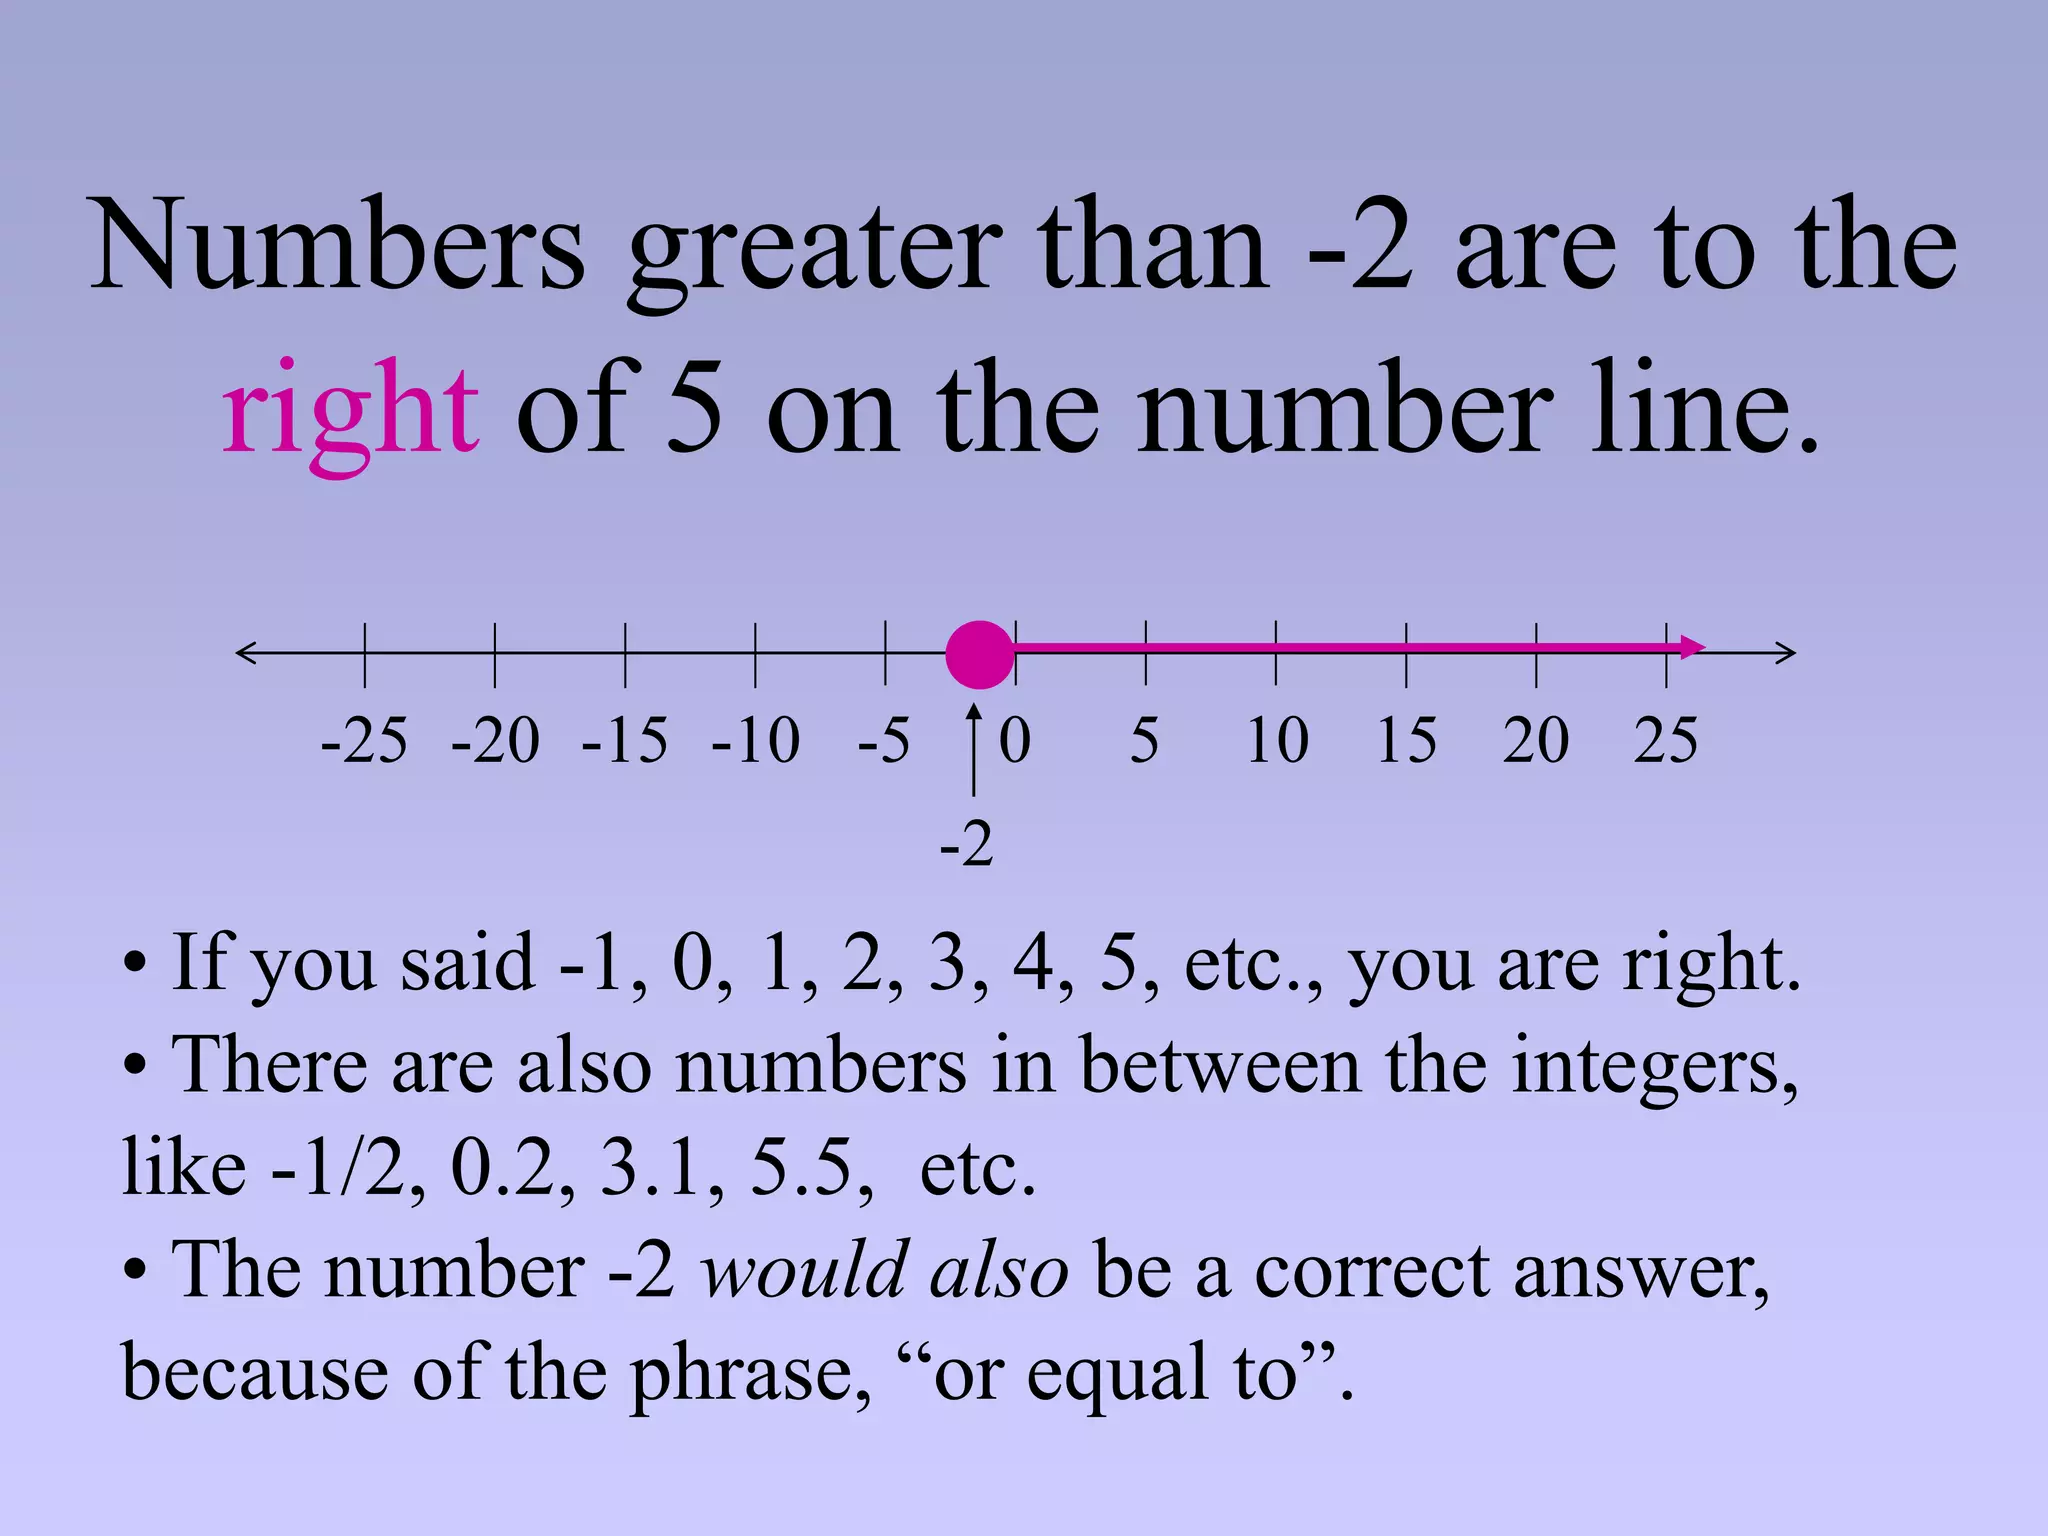
Numbers greater than-2 are to the
right of 5 on the number line.
0 5 10 15
-20 -15 -10 -5
-25 20 25
• If you said -1, 0, 1, 2, 3, 4, 5, etc., you are right.
• There are also numbers in between the integers,
like -1/2, 0.2, 3.1, 5.5, etc.
• The number -2 would also be a correct answer,
because of the phrase, “or equal to”.
-2
7.
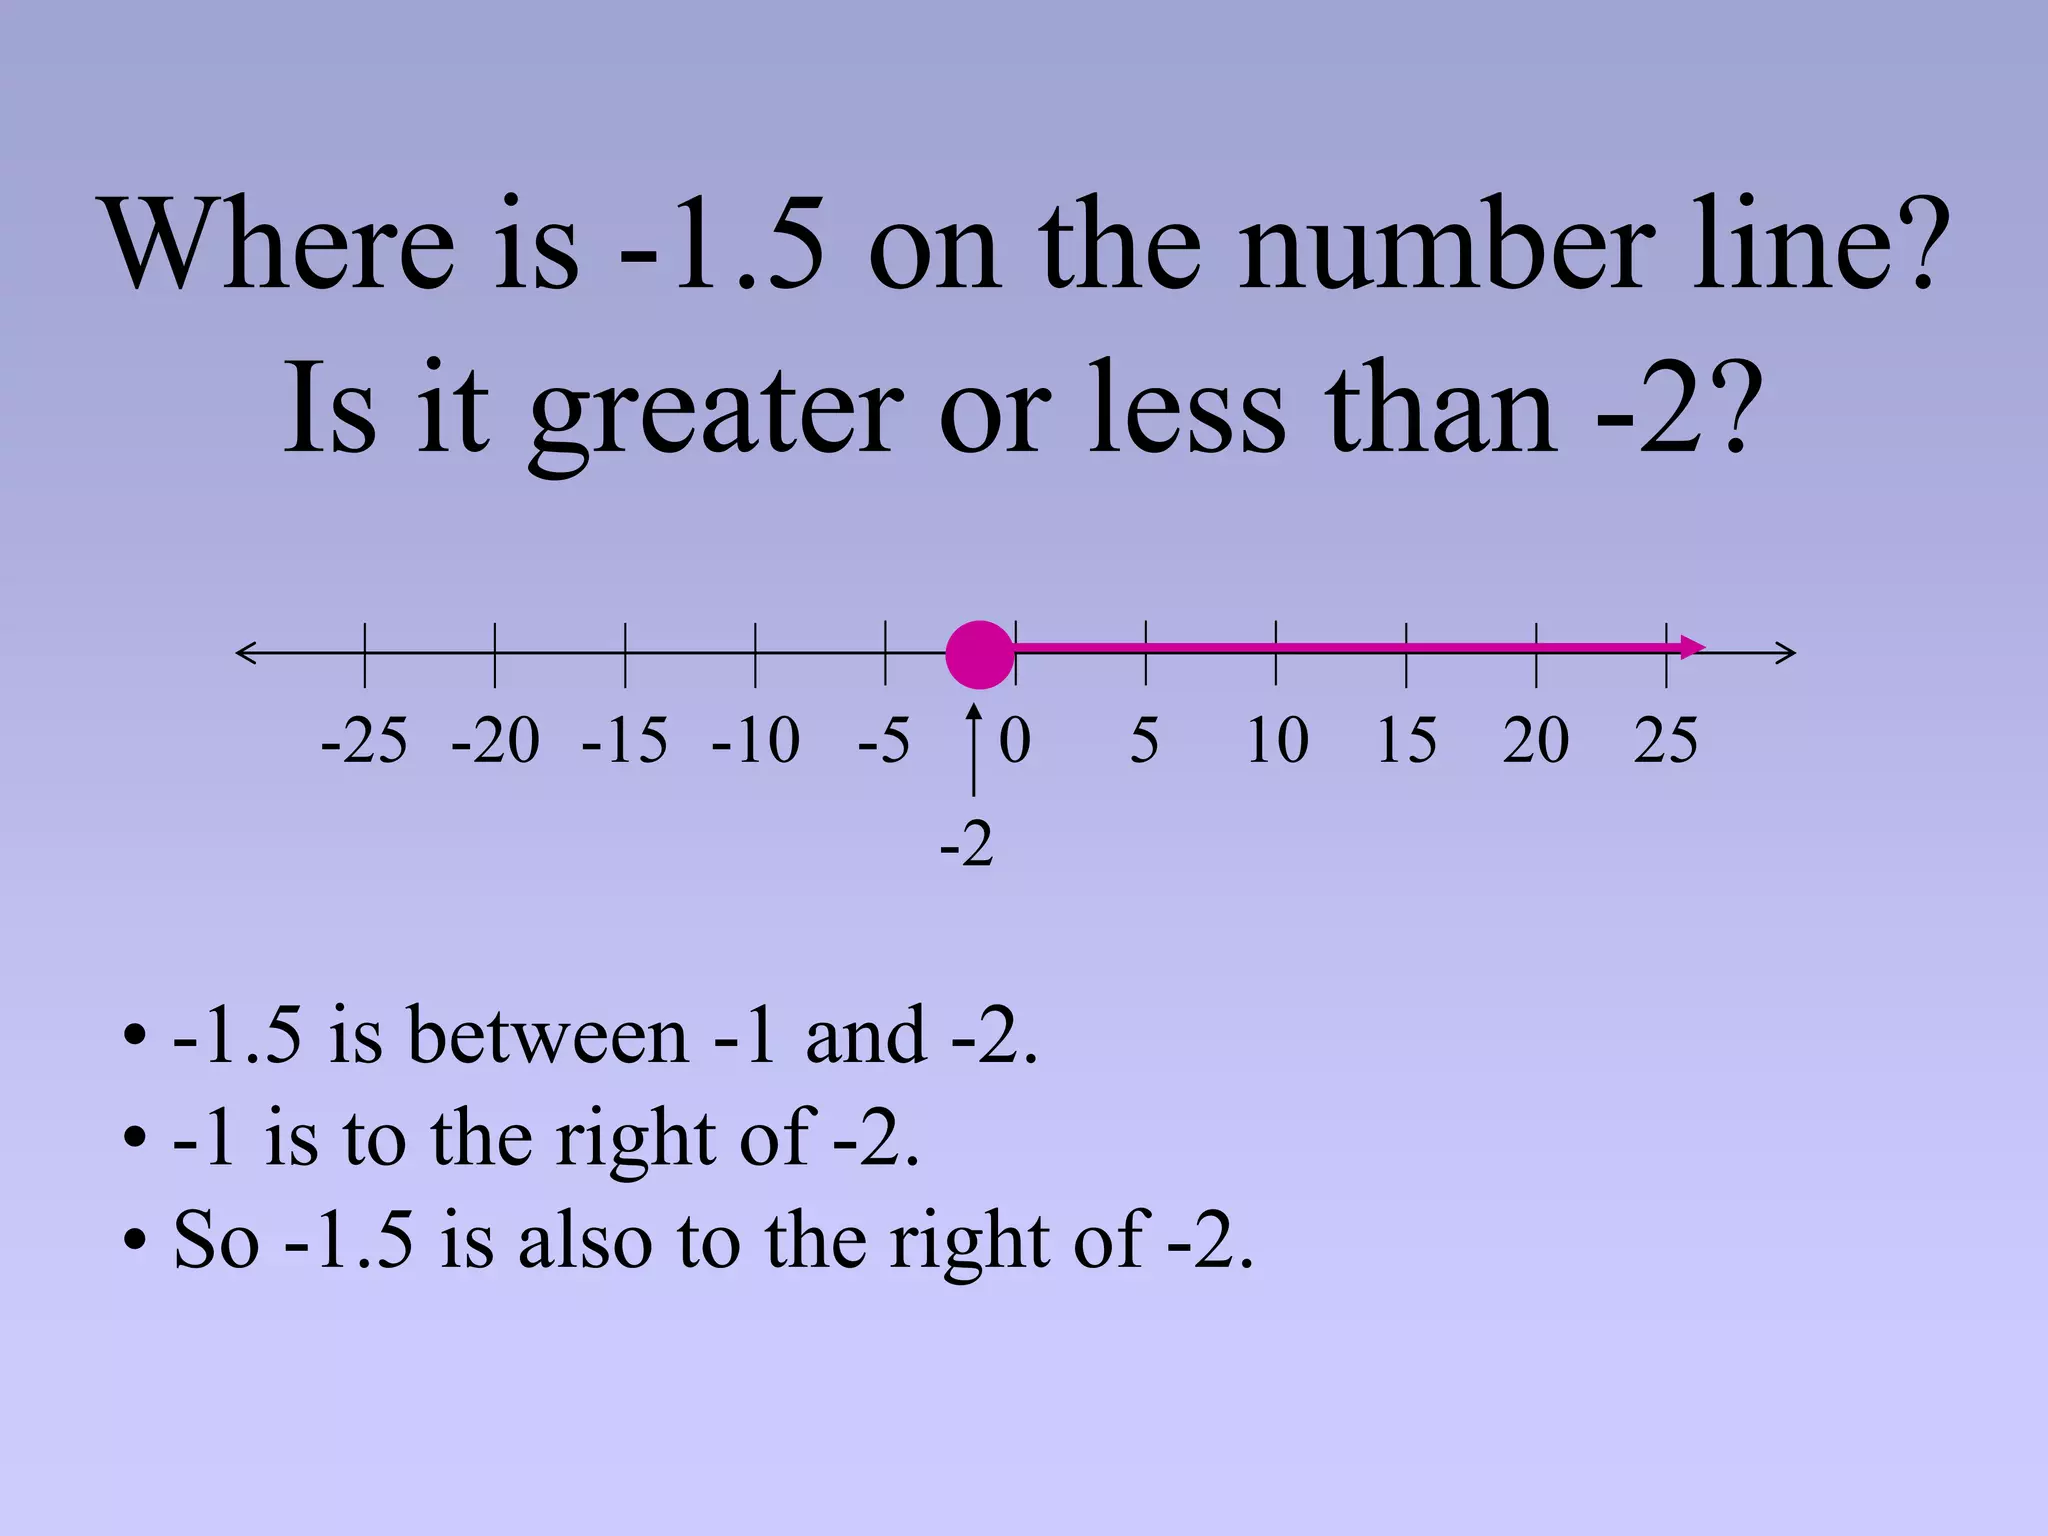
Where is -1.5on the number line?
Is it greater or less than -2?
0 5 10 15
-20 -15 -10 -5
-25 20 25
• -1.5 is between -1 and -2.
• -1 is to the right of -2.
• So -1.5 is also to the right of -2.
-2
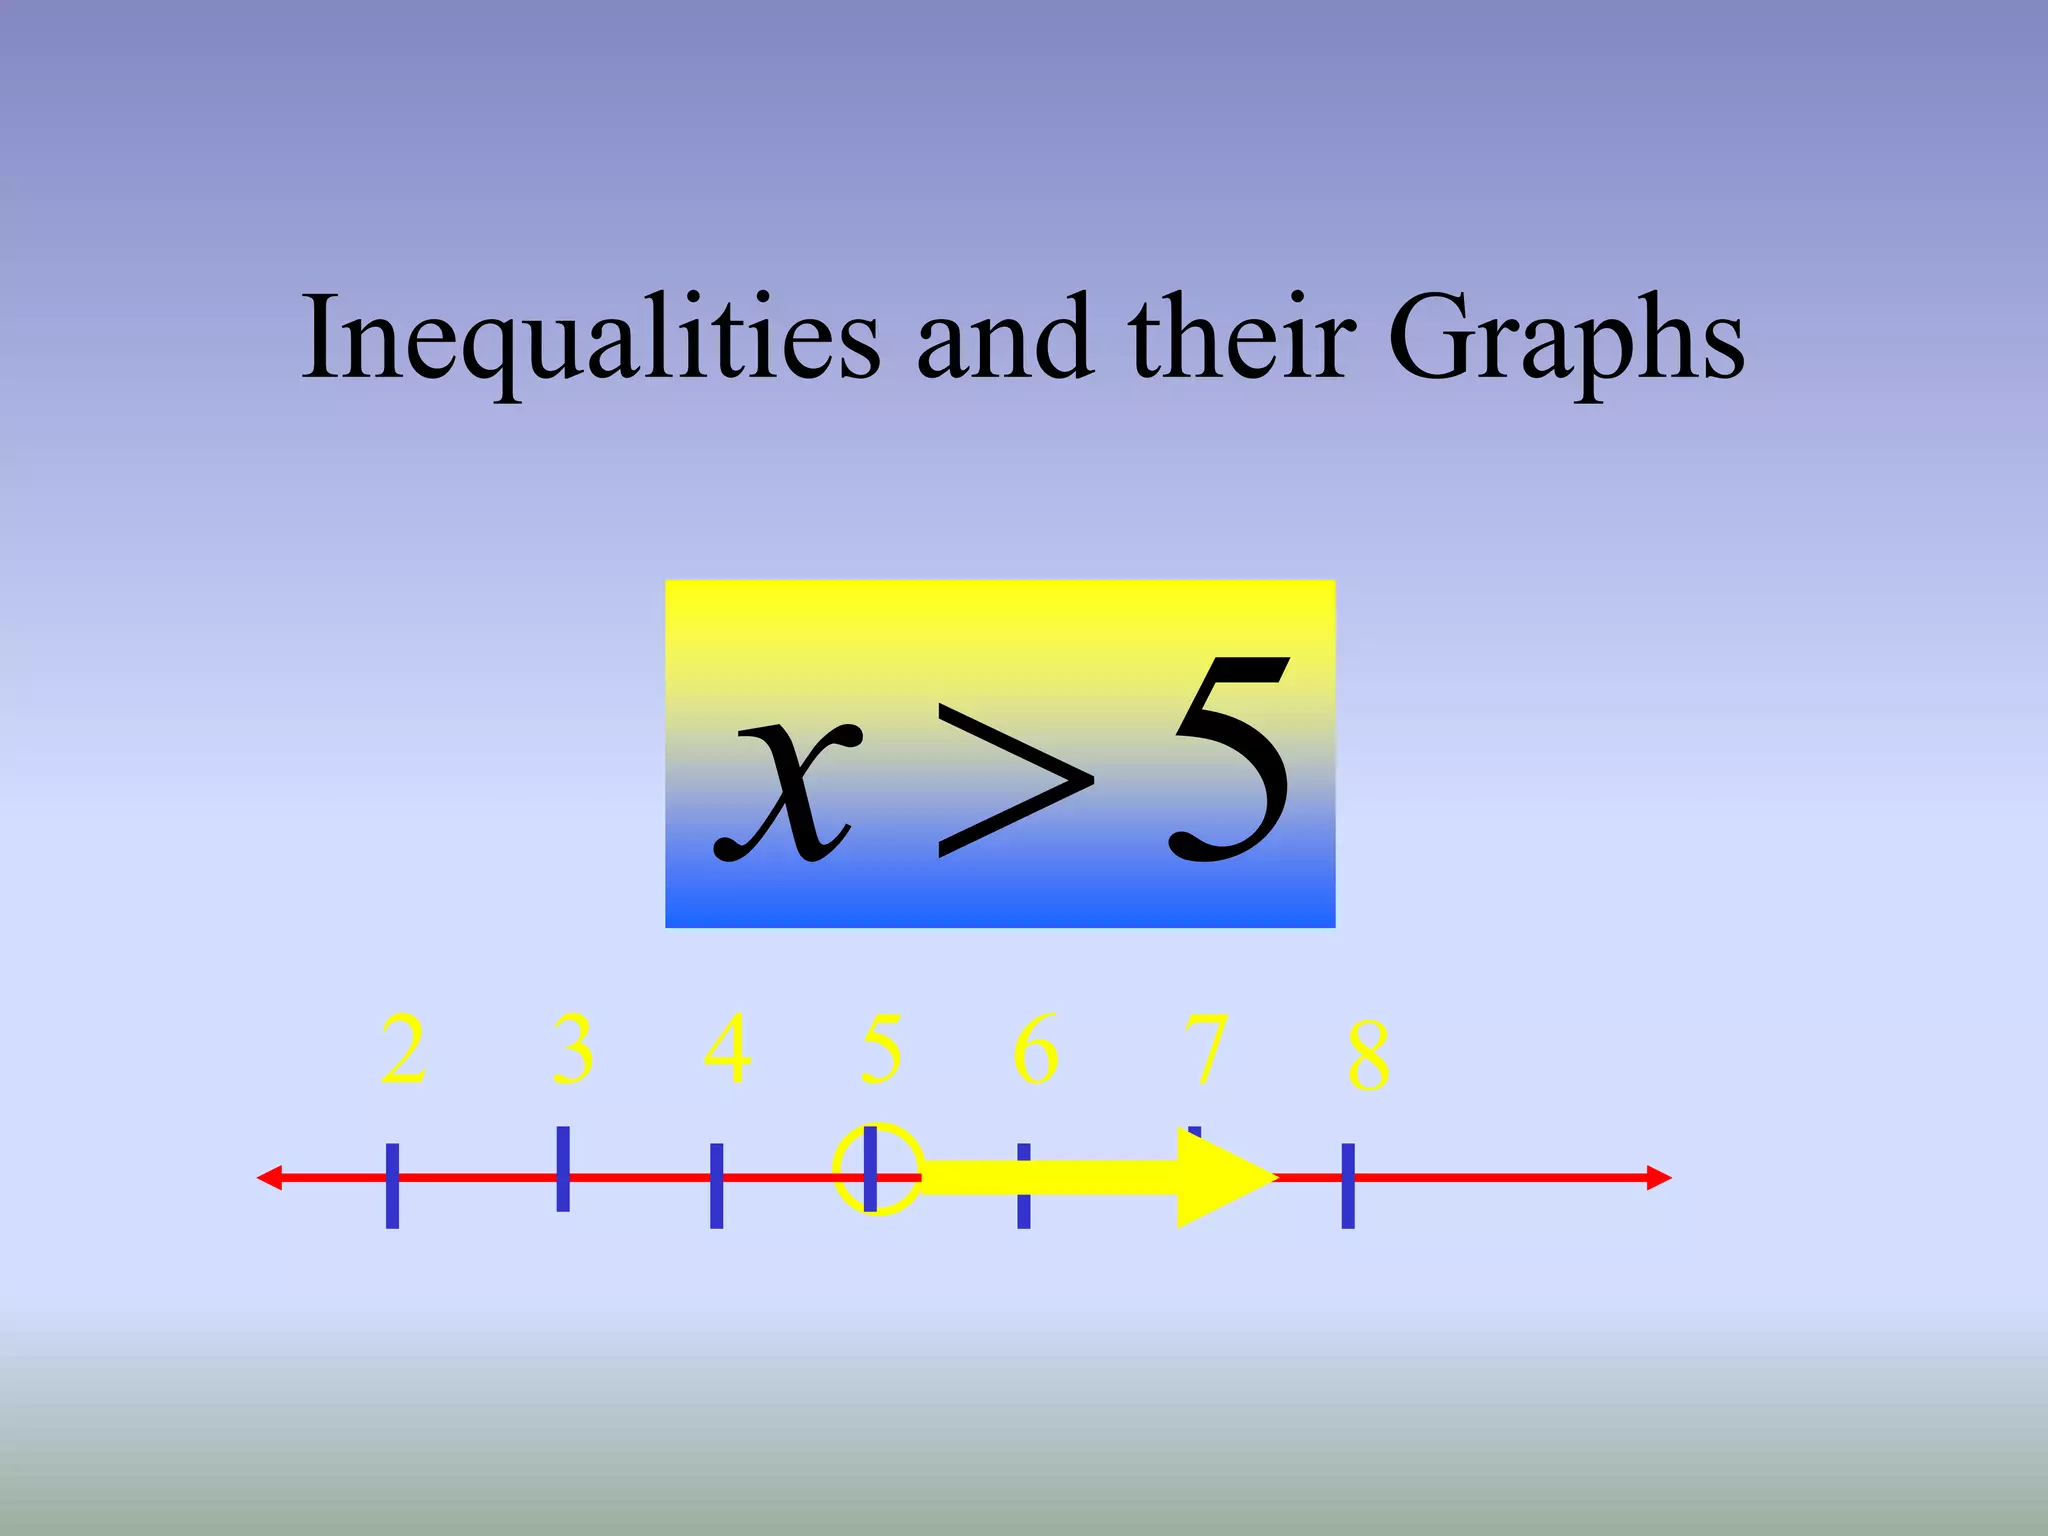
Inequalities and theirGraphs
Objective: To write and graph simple
inequalities with one variable
10.
Inequalities and theirGraphs
7
6
3 5
4
2 8
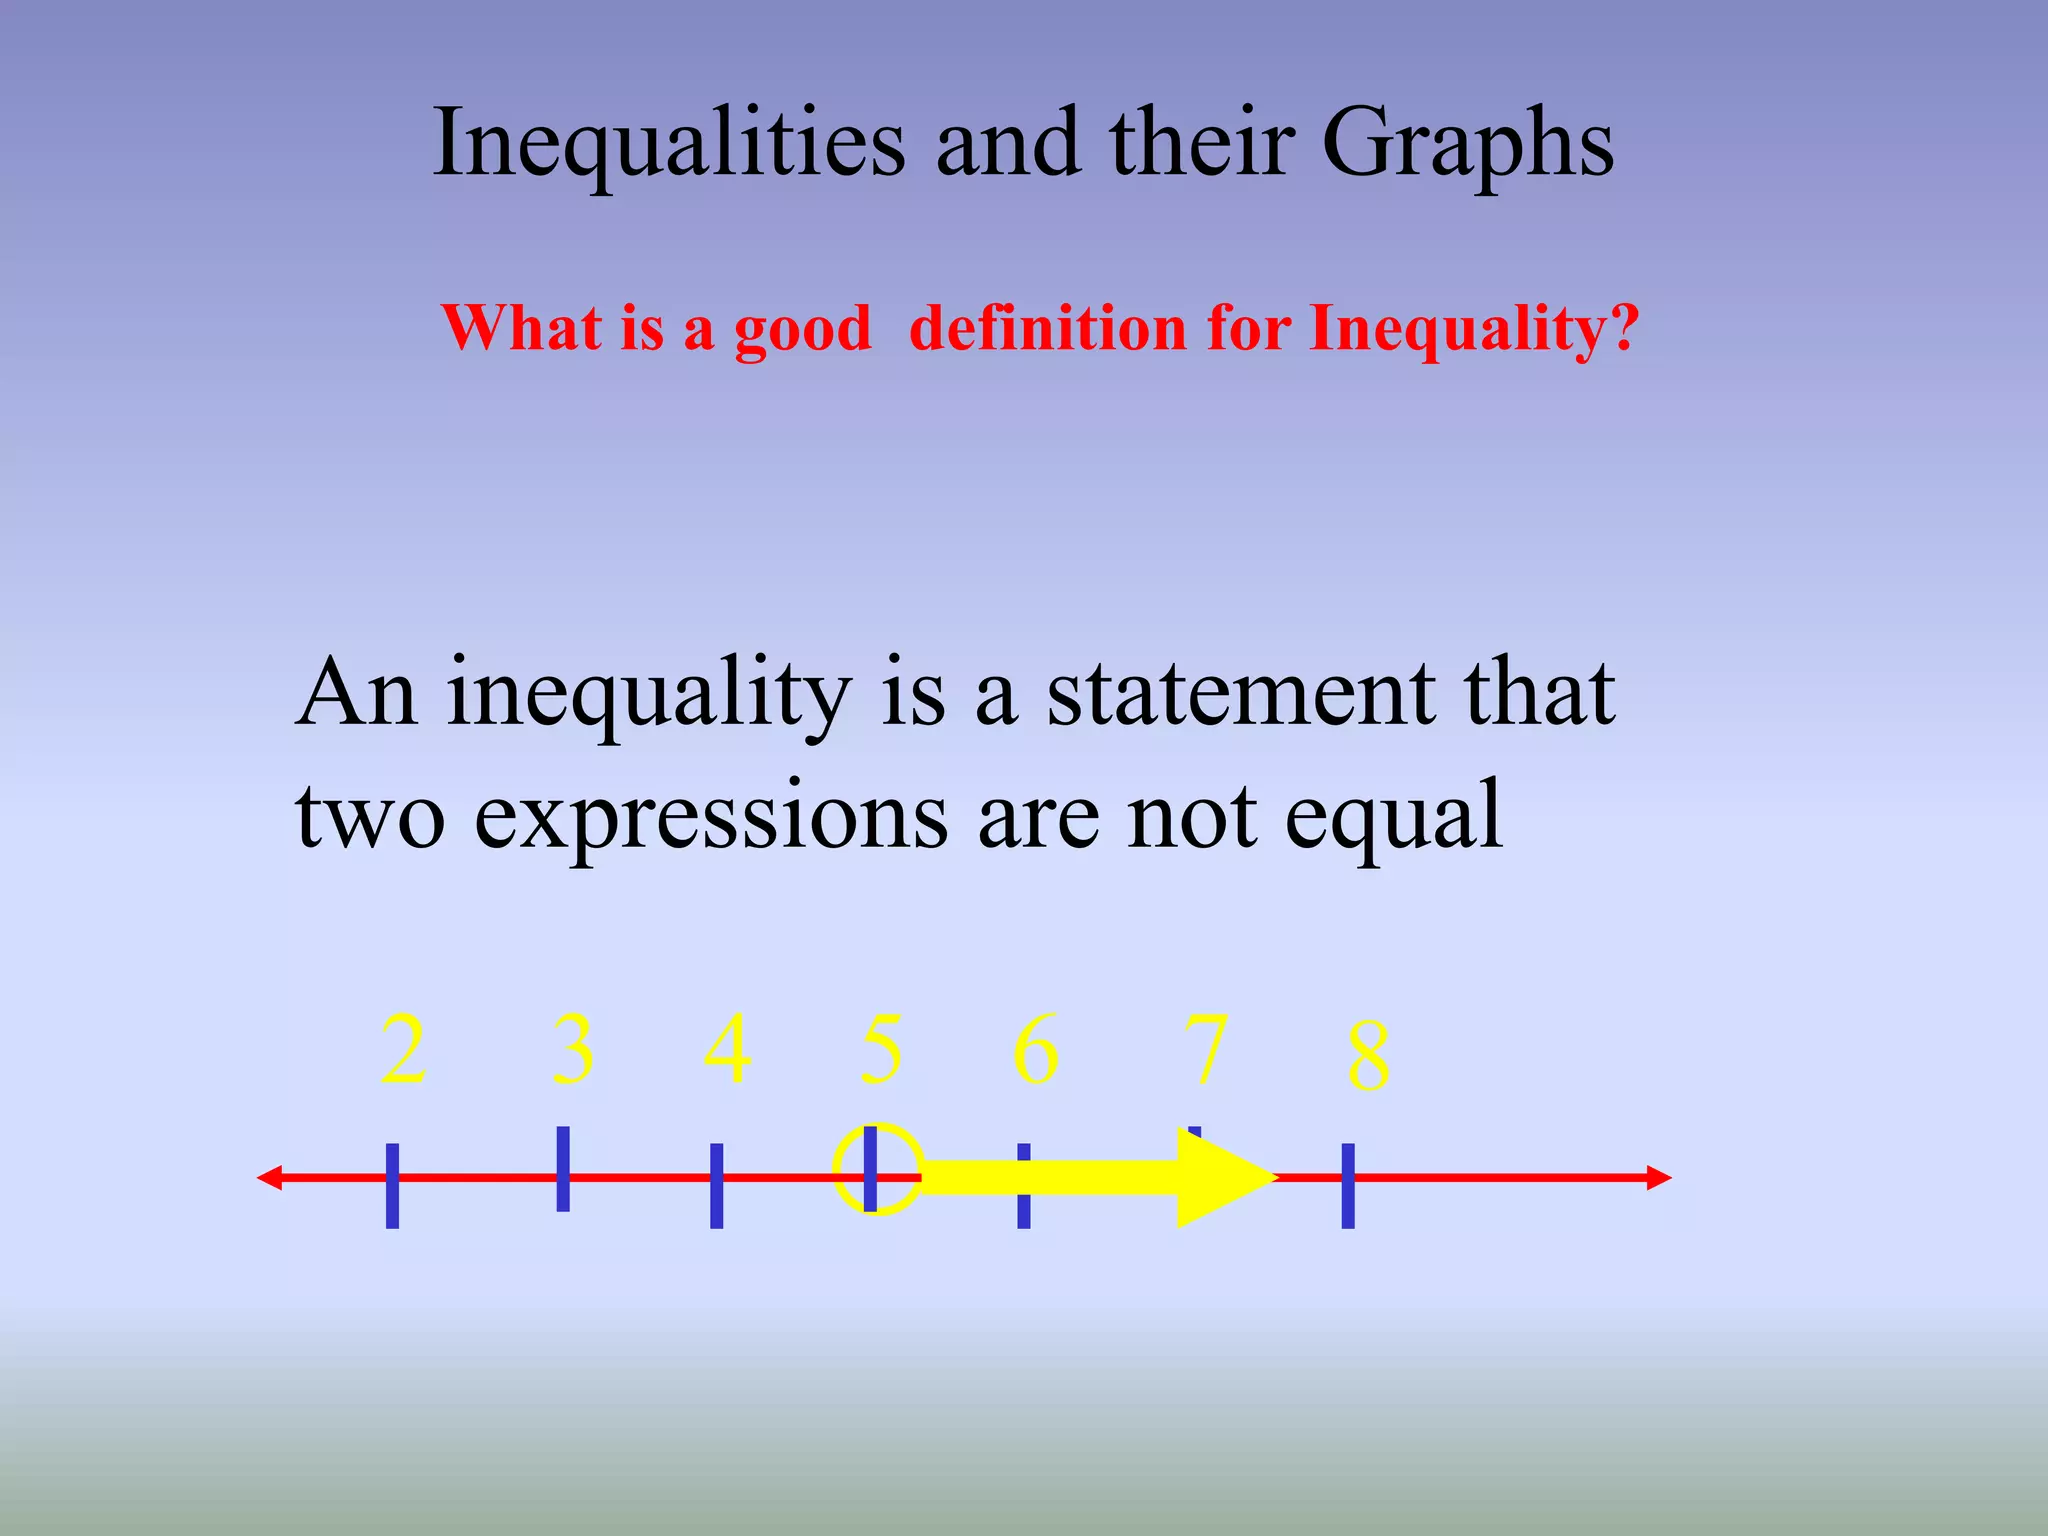
What is a good definition for Inequality?
An inequality is a statement that
two expressions are not equal
11.
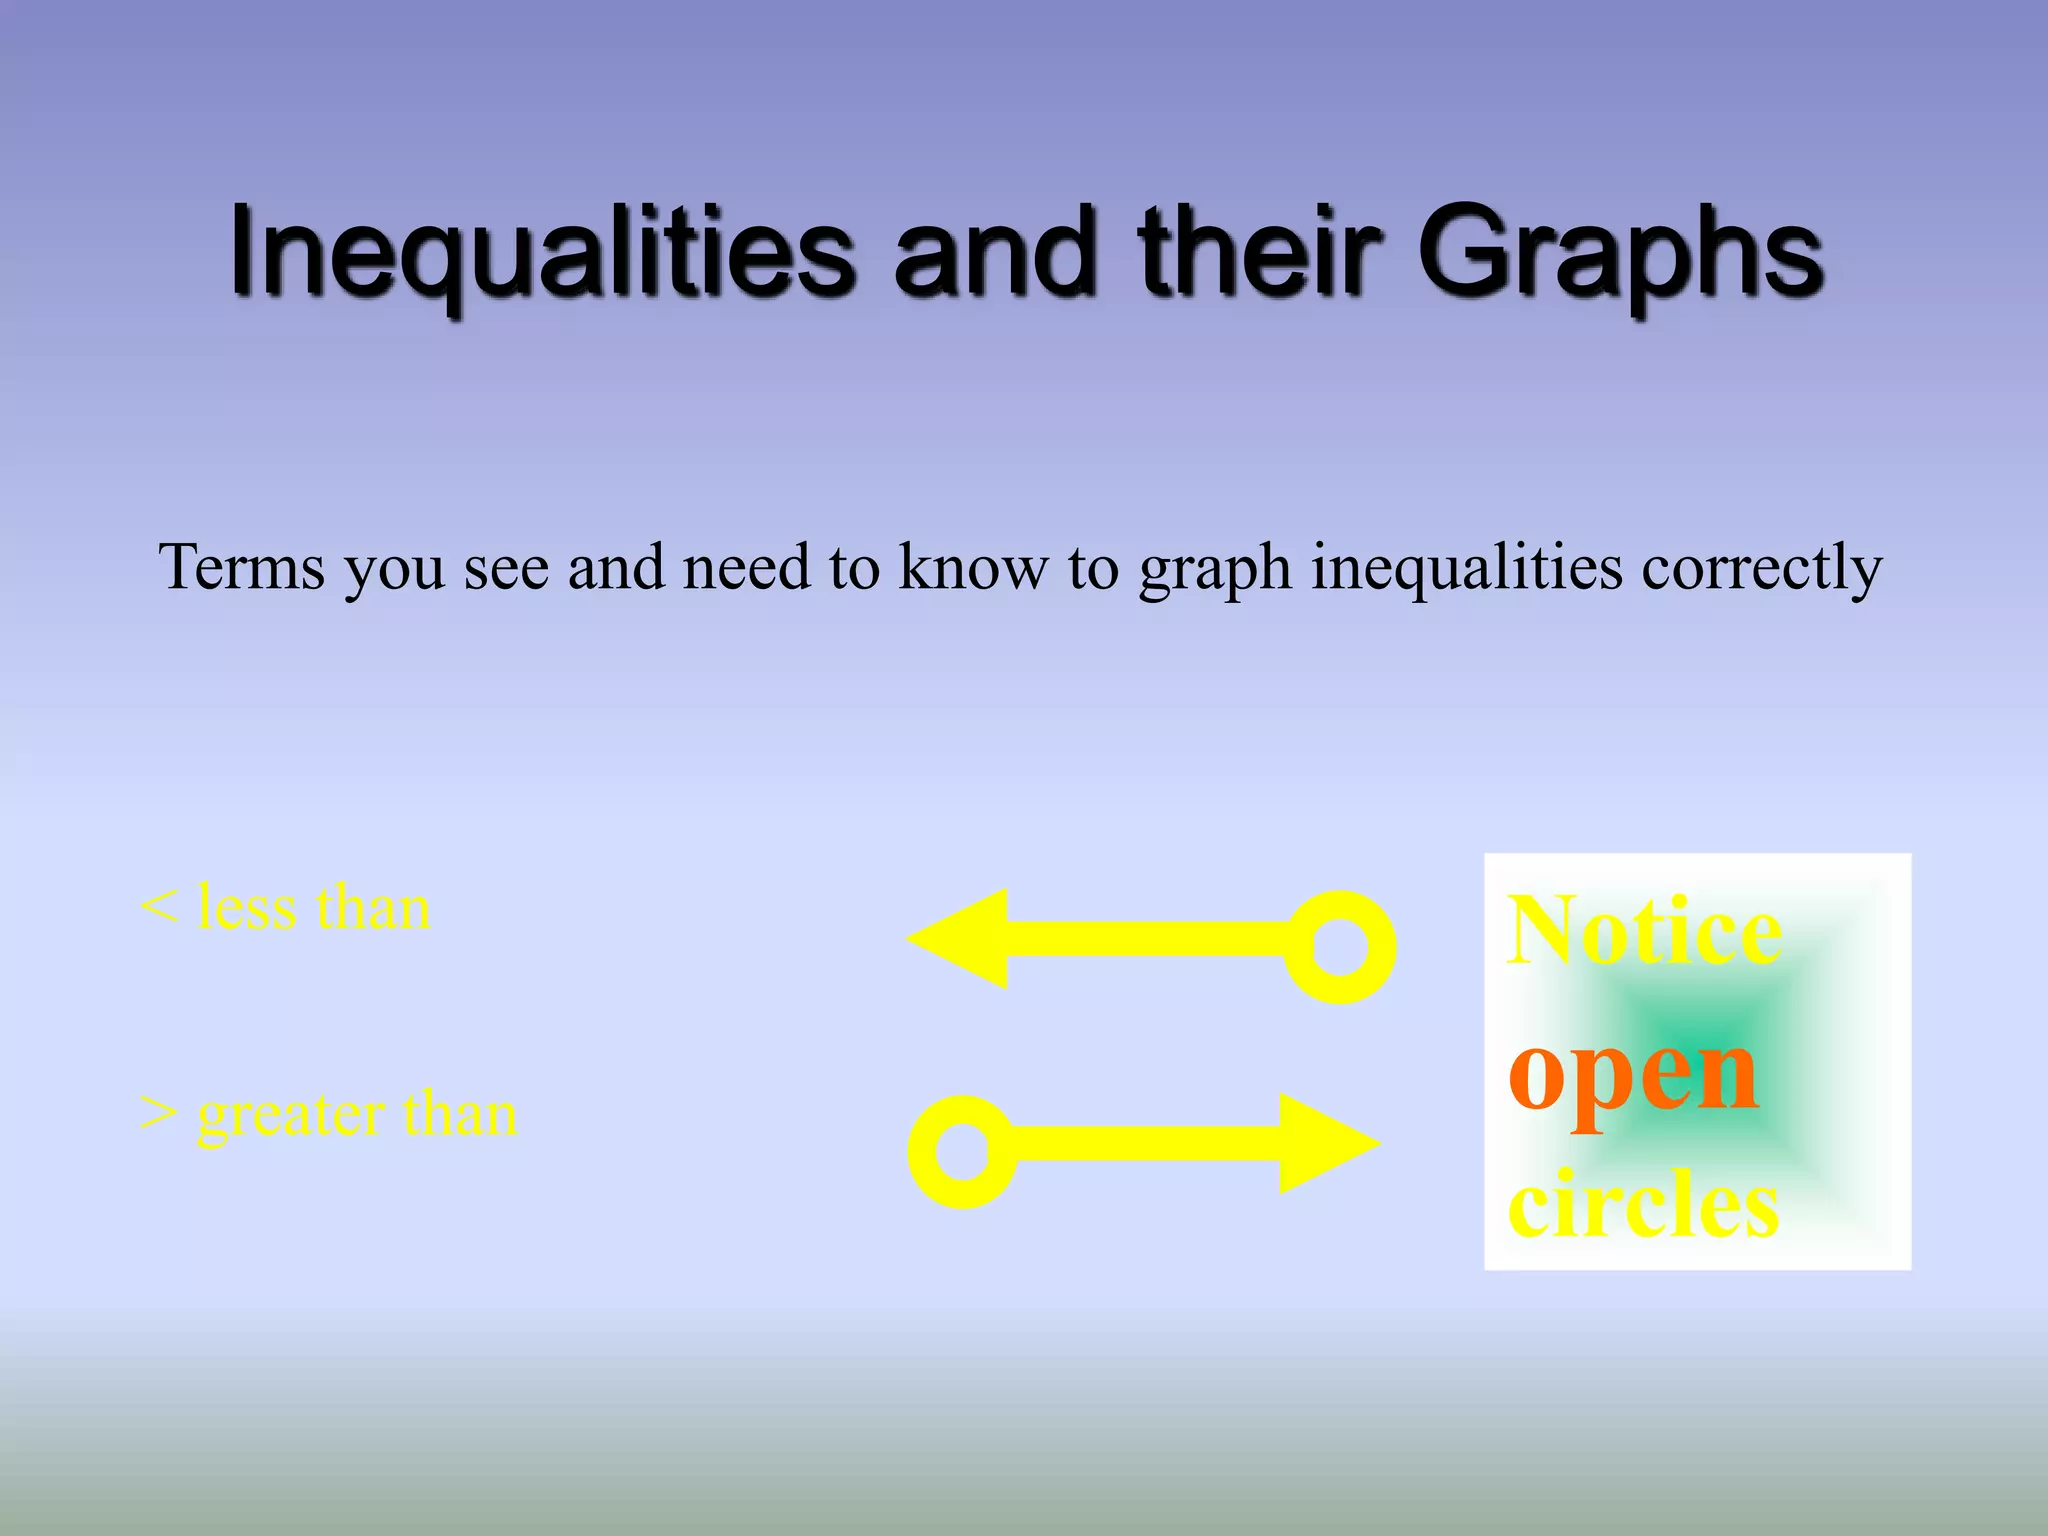
Inequalities and theirGraphs
Terms you see and need to know to graph inequalities correctly
Notice
open
circles
< less than
> greater than
12.
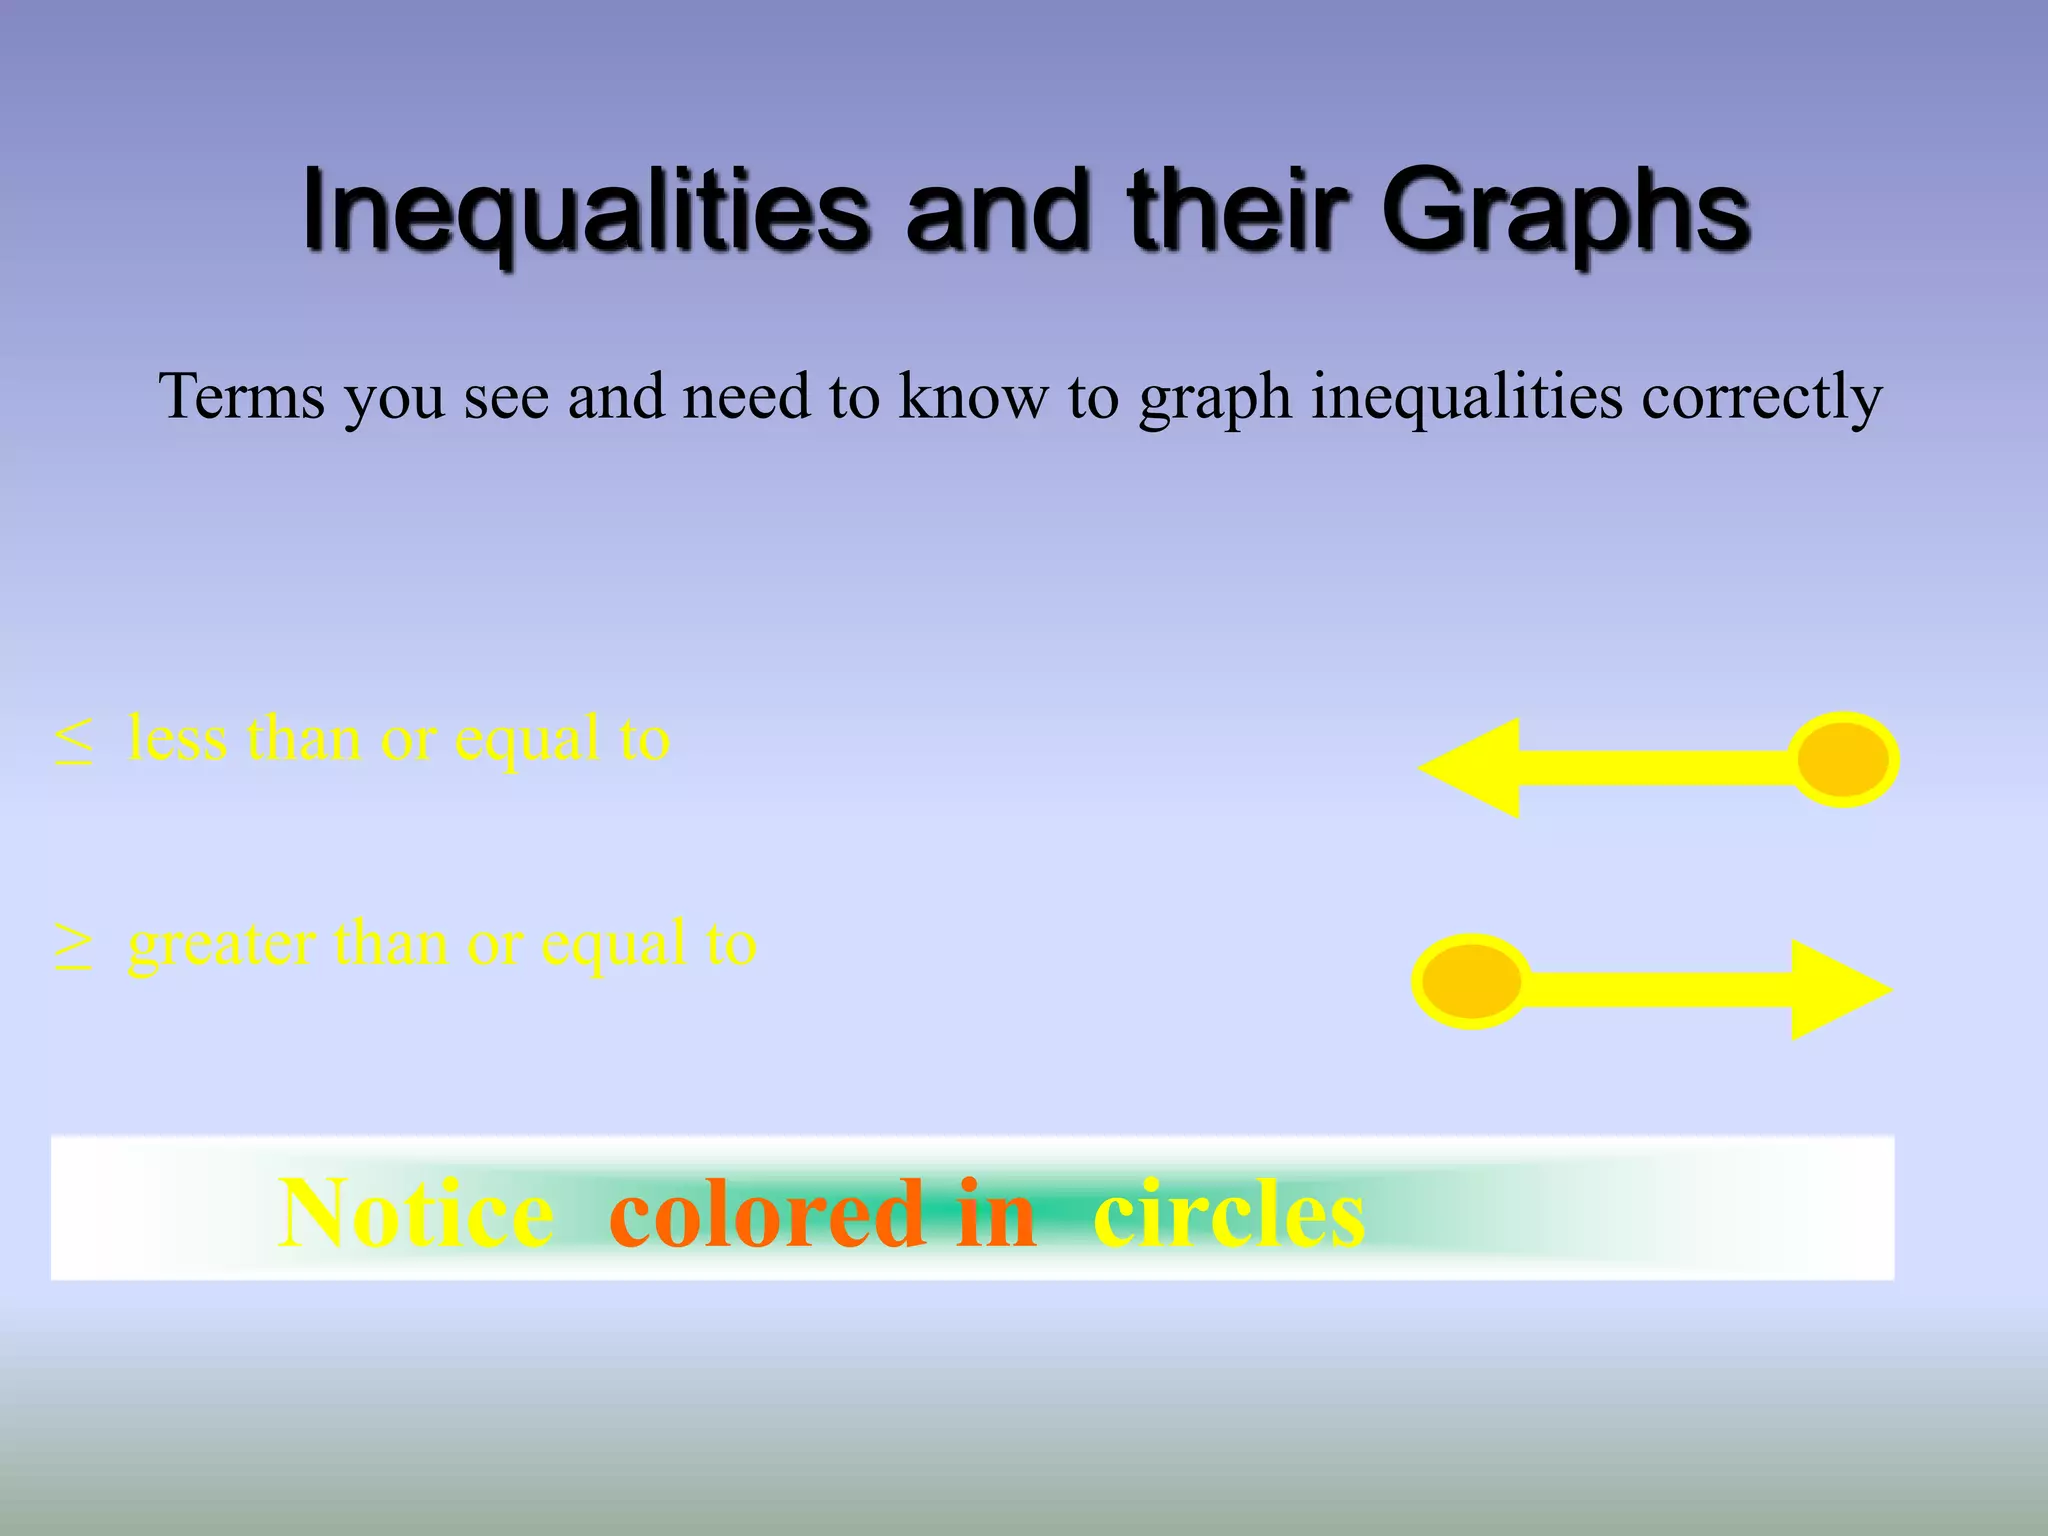
Inequalities and theirGraphs
Terms you see and need to know to graph inequalities correctly
Notice colored in circles
≤ less than or equal to
≥ greater than or equal to
13.
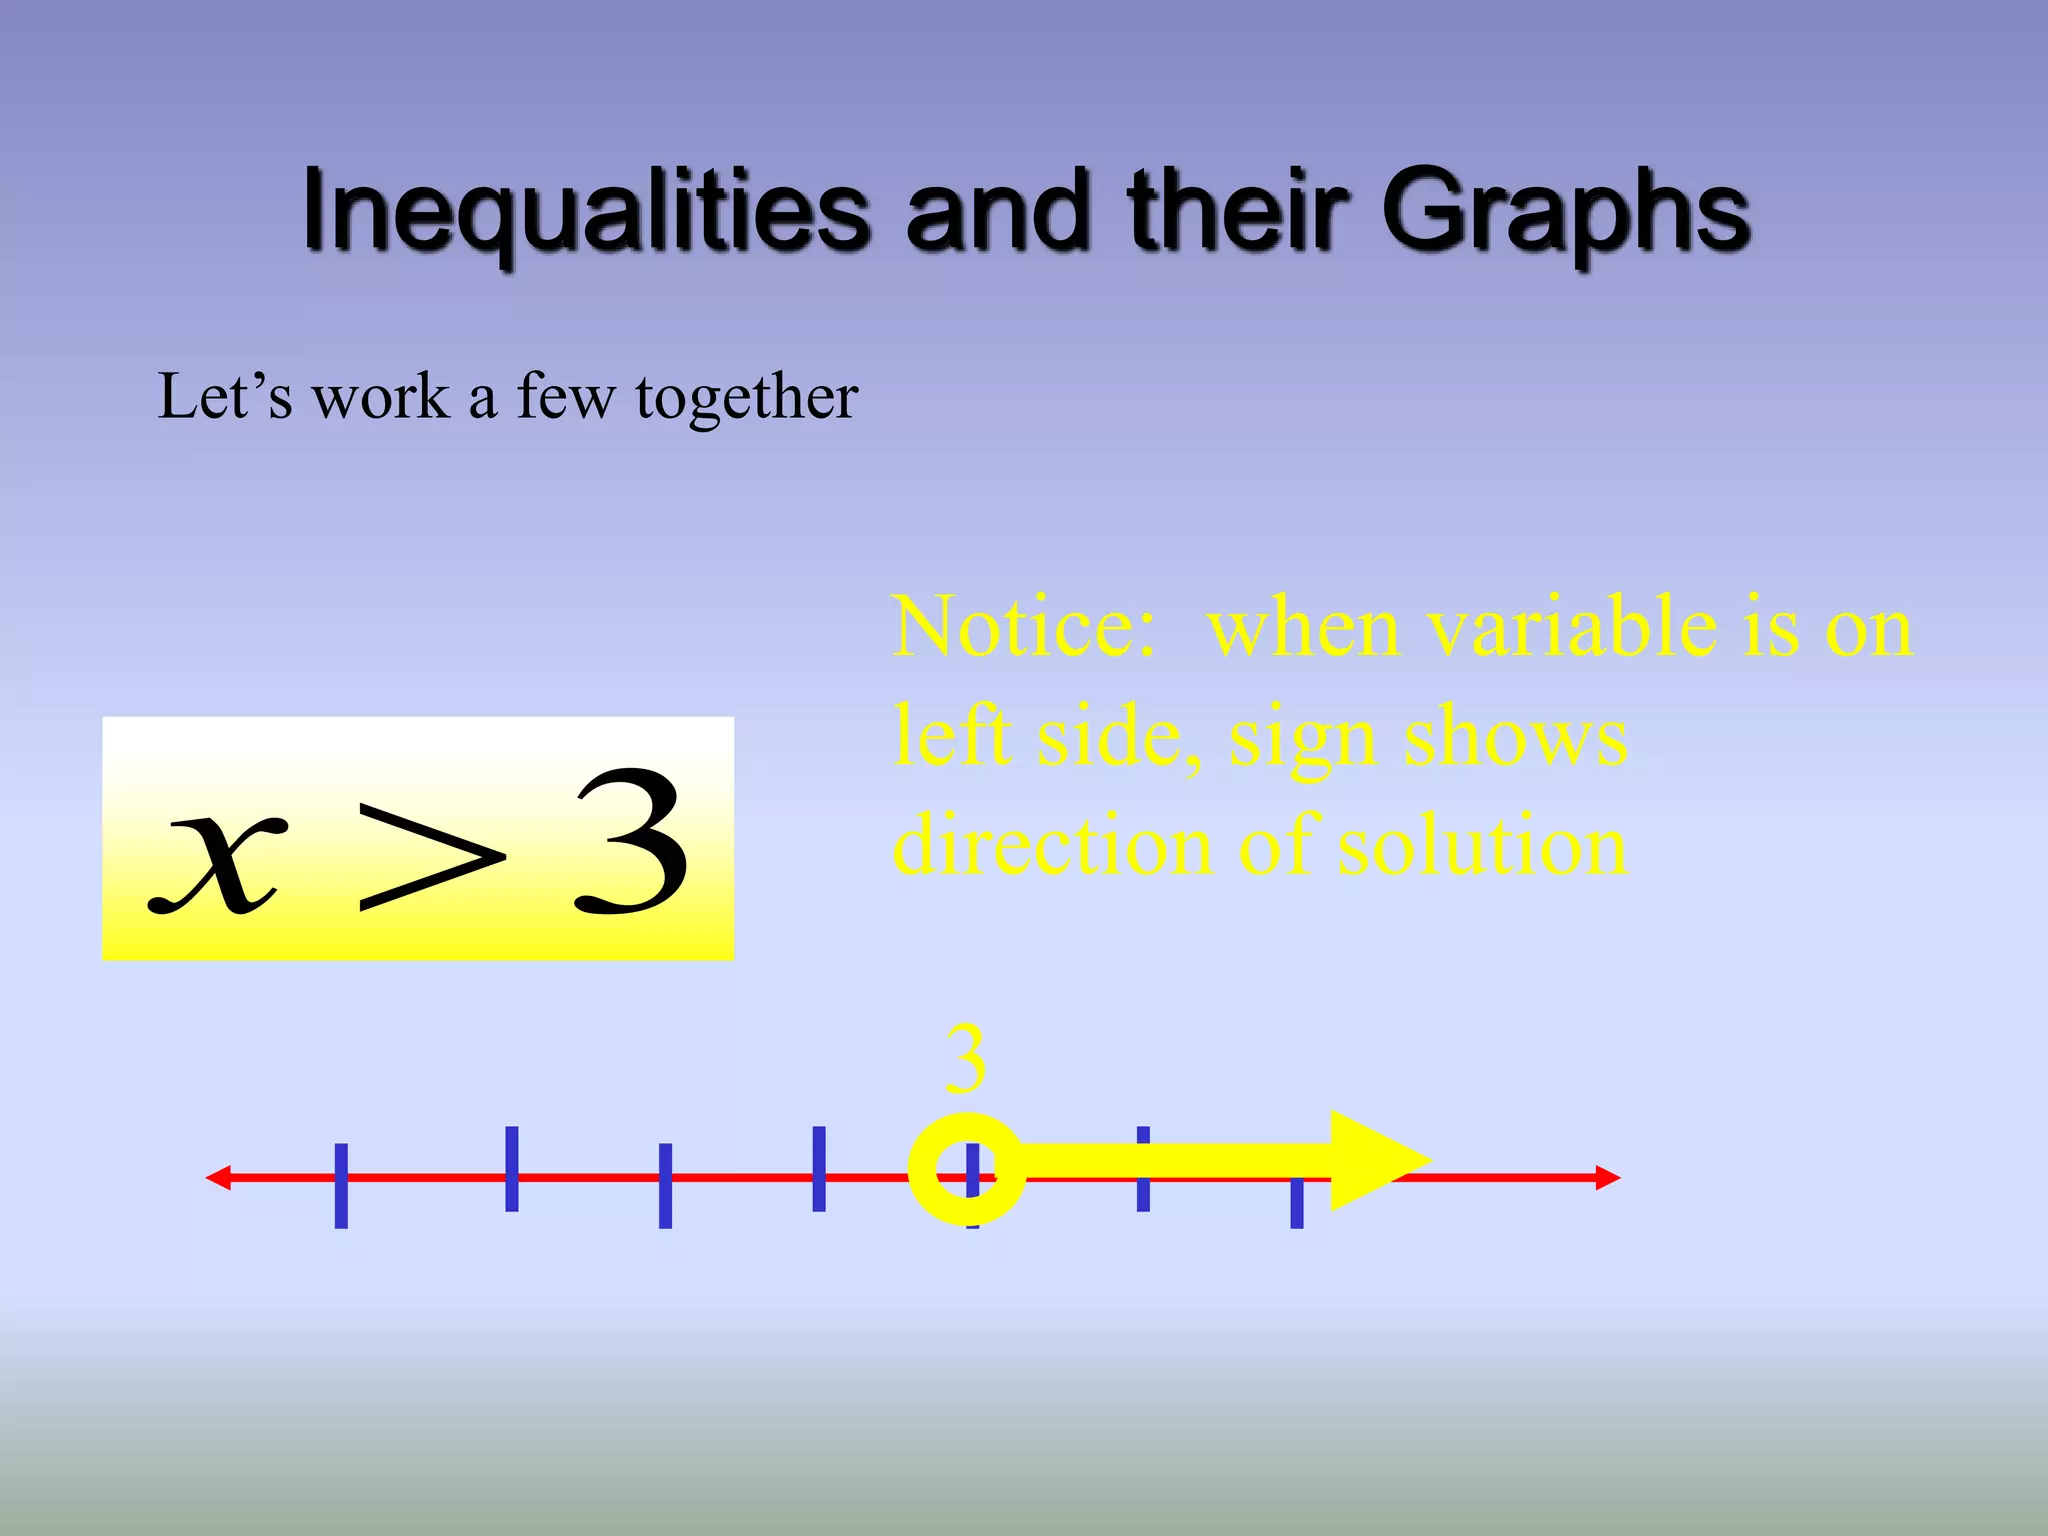
Inequalities and theirGraphs
Let’s work a few together
3
x
3
Notice: when variable is on
left side, sign shows
direction of solution
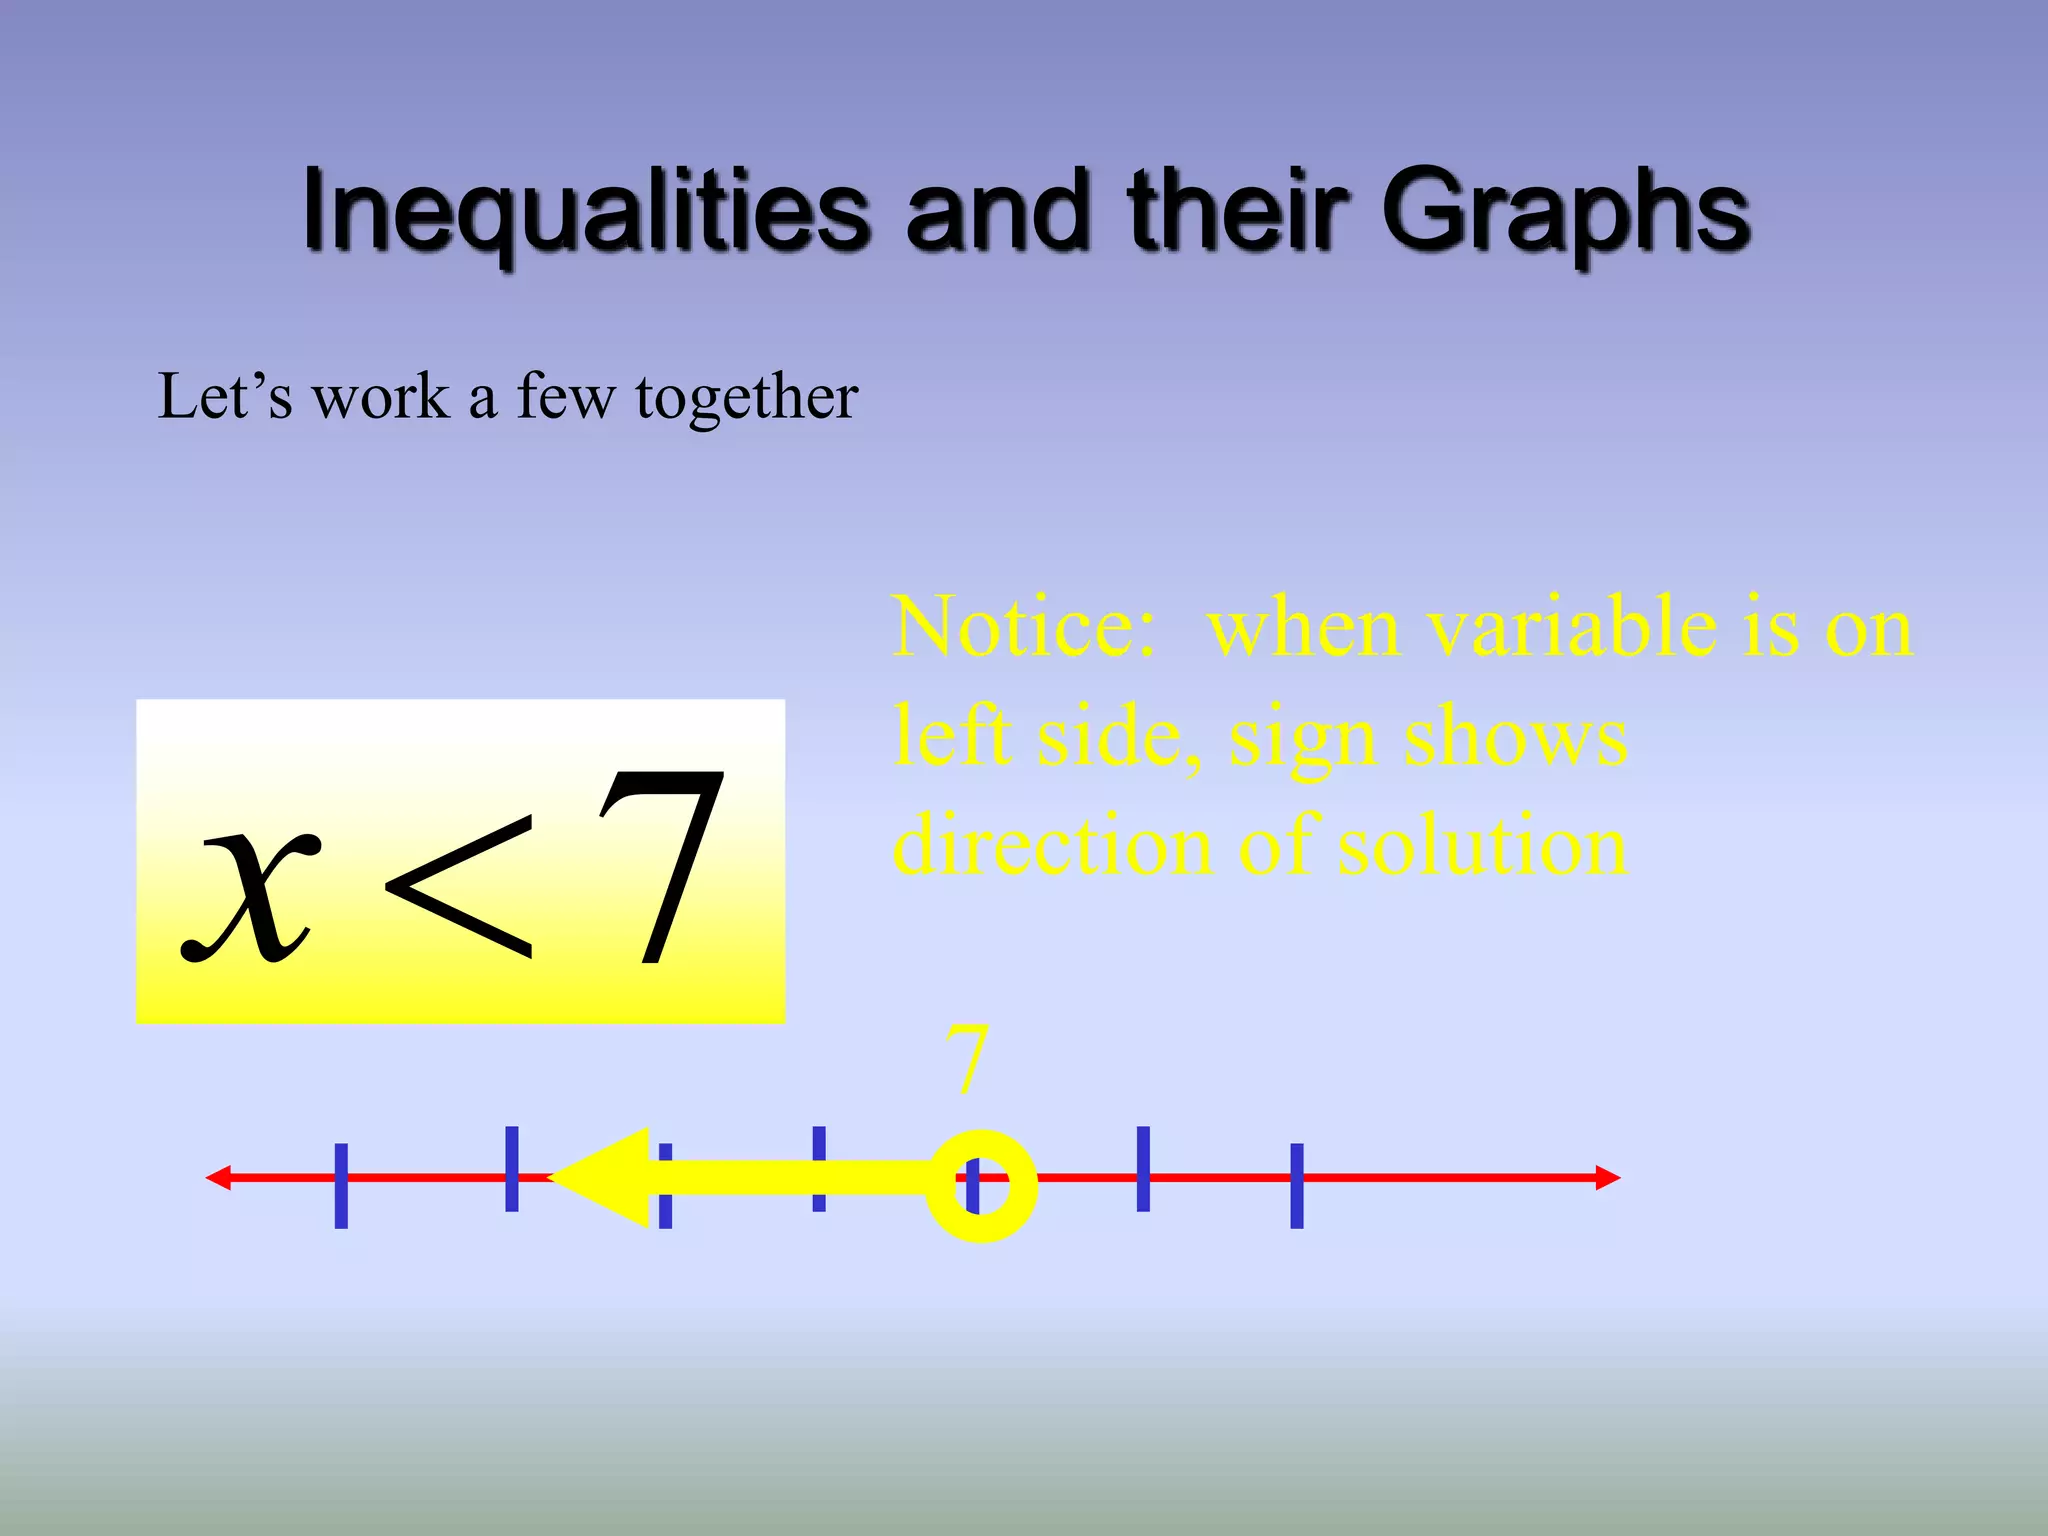
14.
Inequalities and theirGraphs
Let’s work a few together
7
Notice: when variable is on
left side, sign shows
direction of solution
7
x
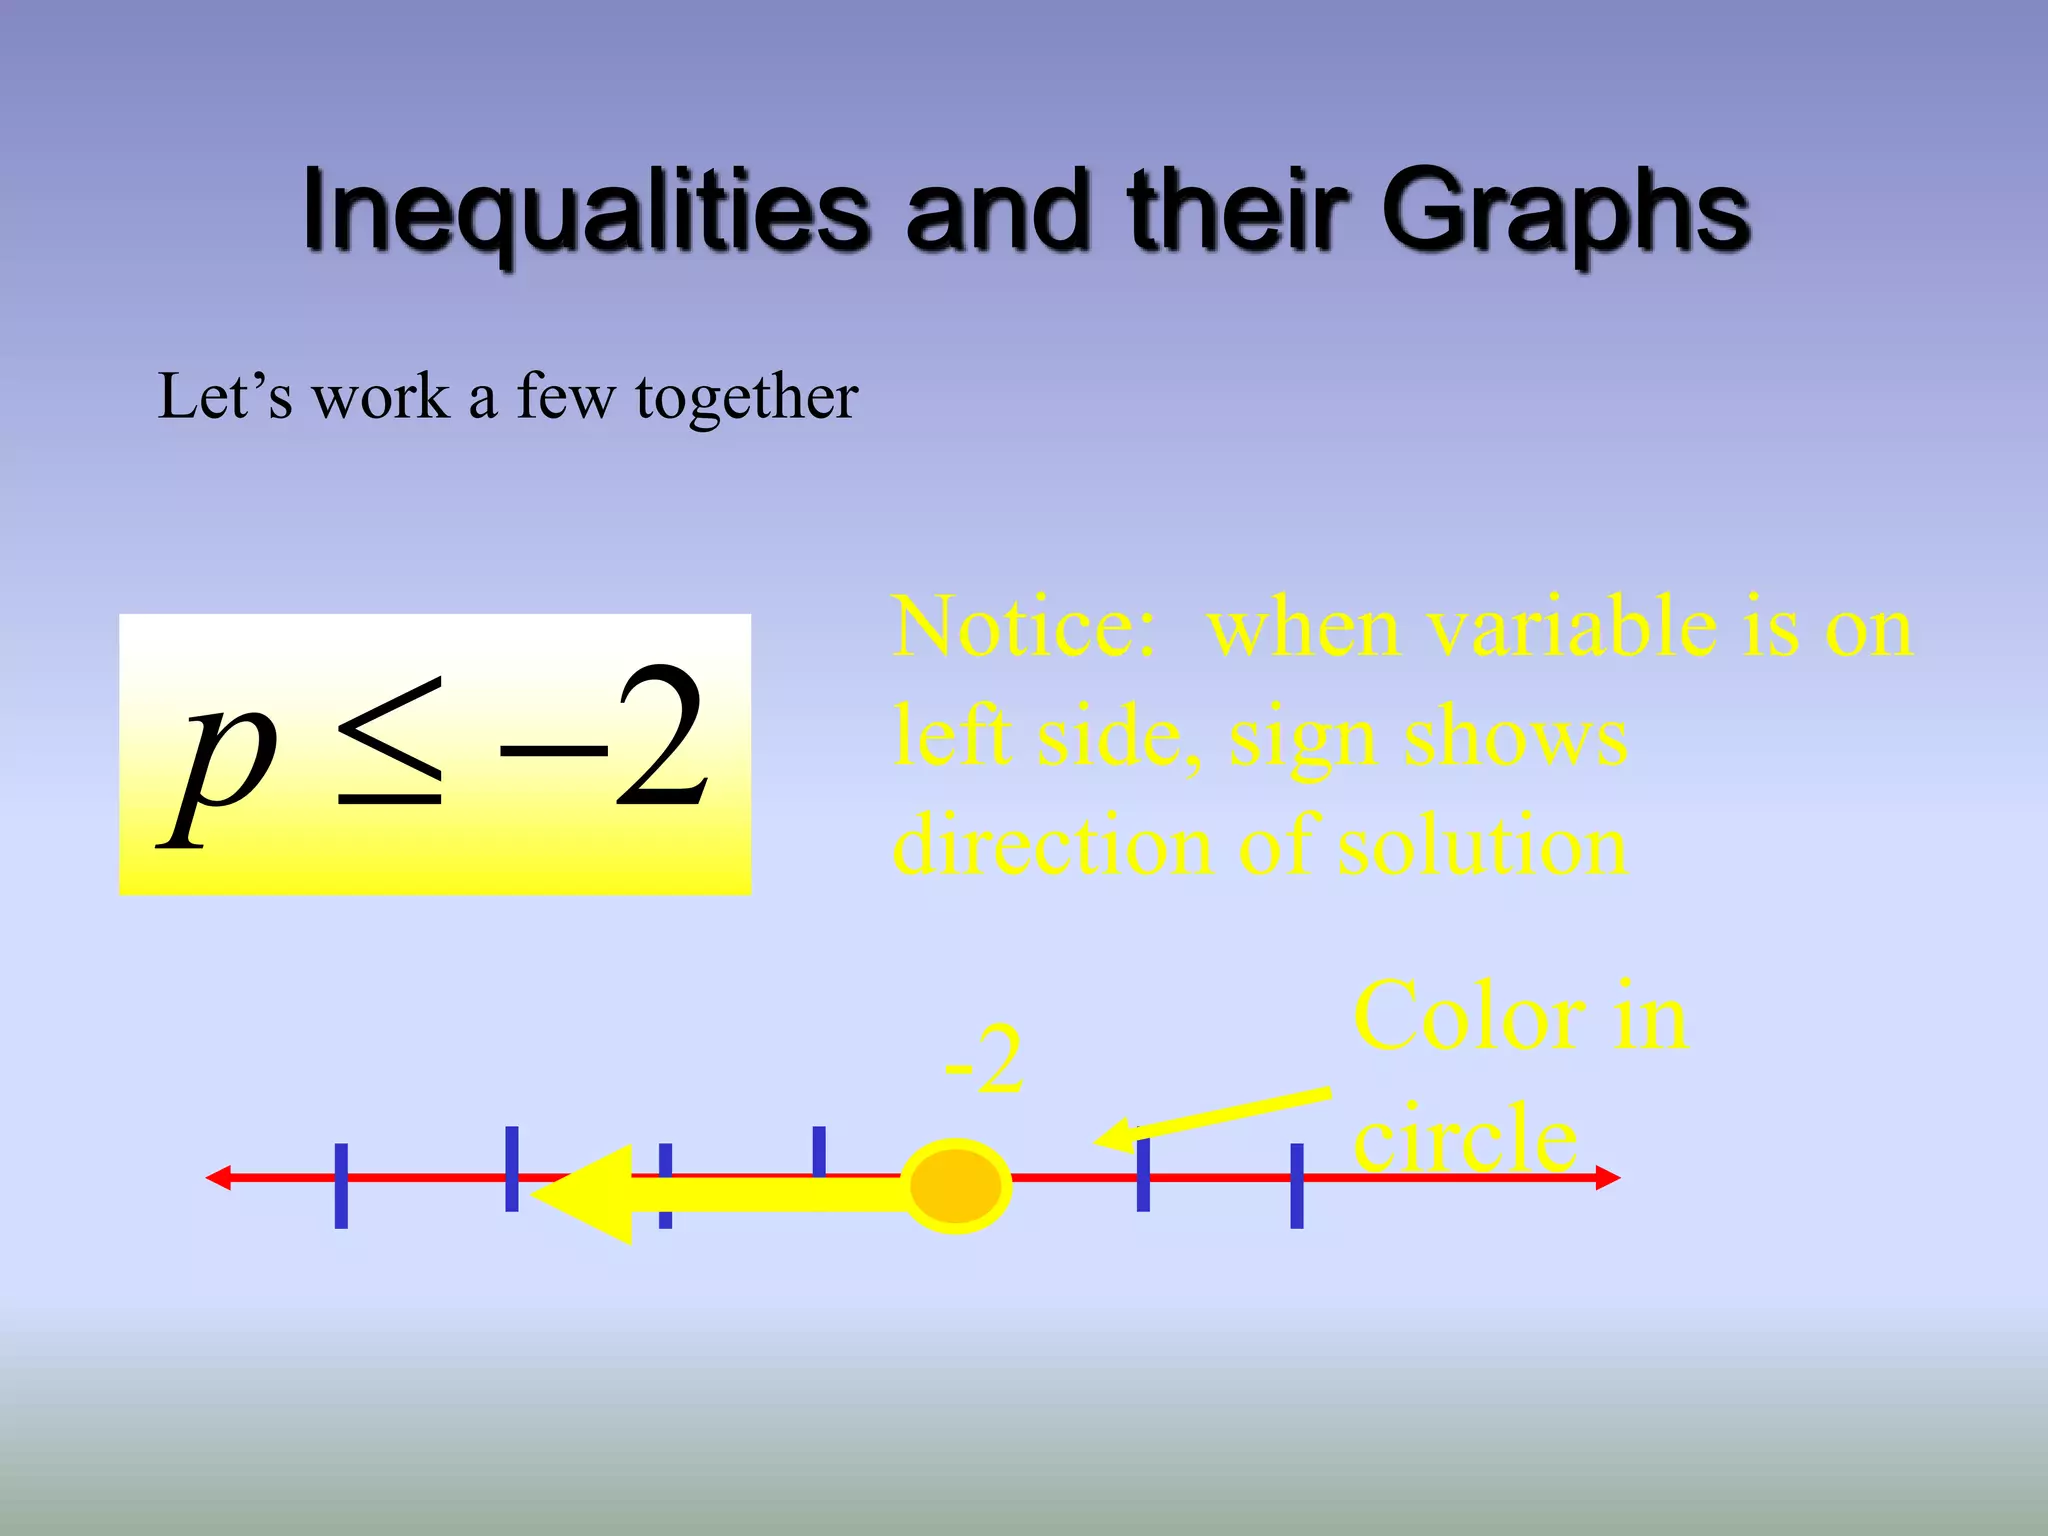
15.
Inequalities and theirGraphs
Let’s work a few together
-2
Notice: when variable is on
left side, sign shows
direction of solution
2
p
Color in
circle
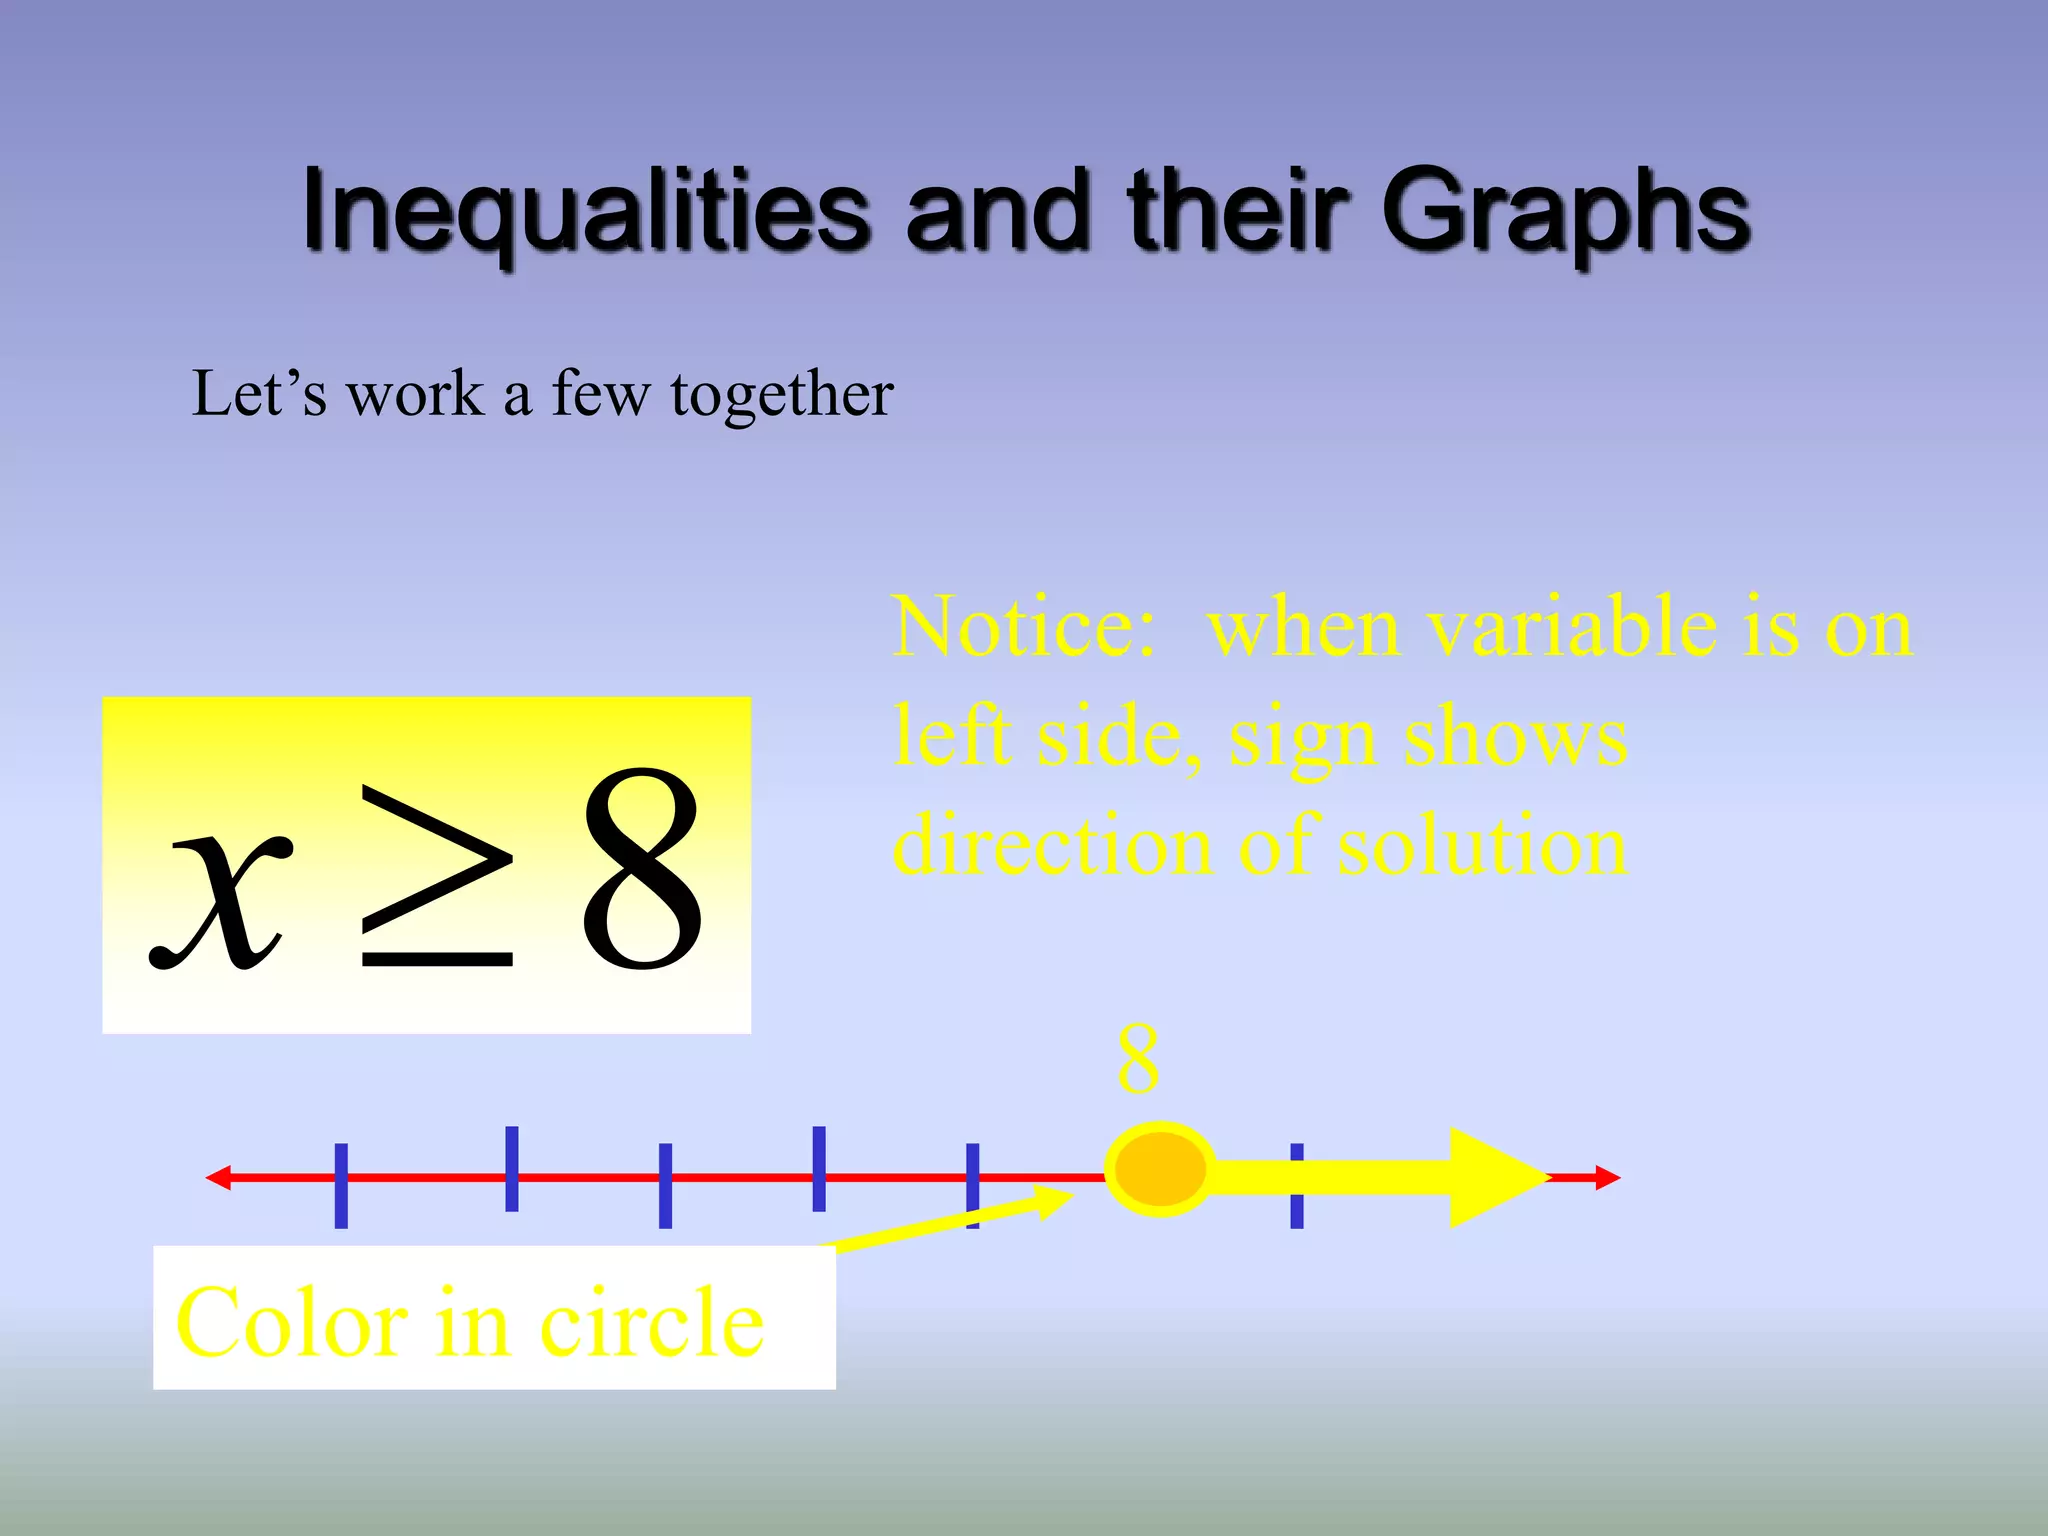
16.
Inequalities and theirGraphs
Let’s work a few together
8
Notice: when variable is on
left side, sign shows
direction of solution
Color in circle
8
x
17.
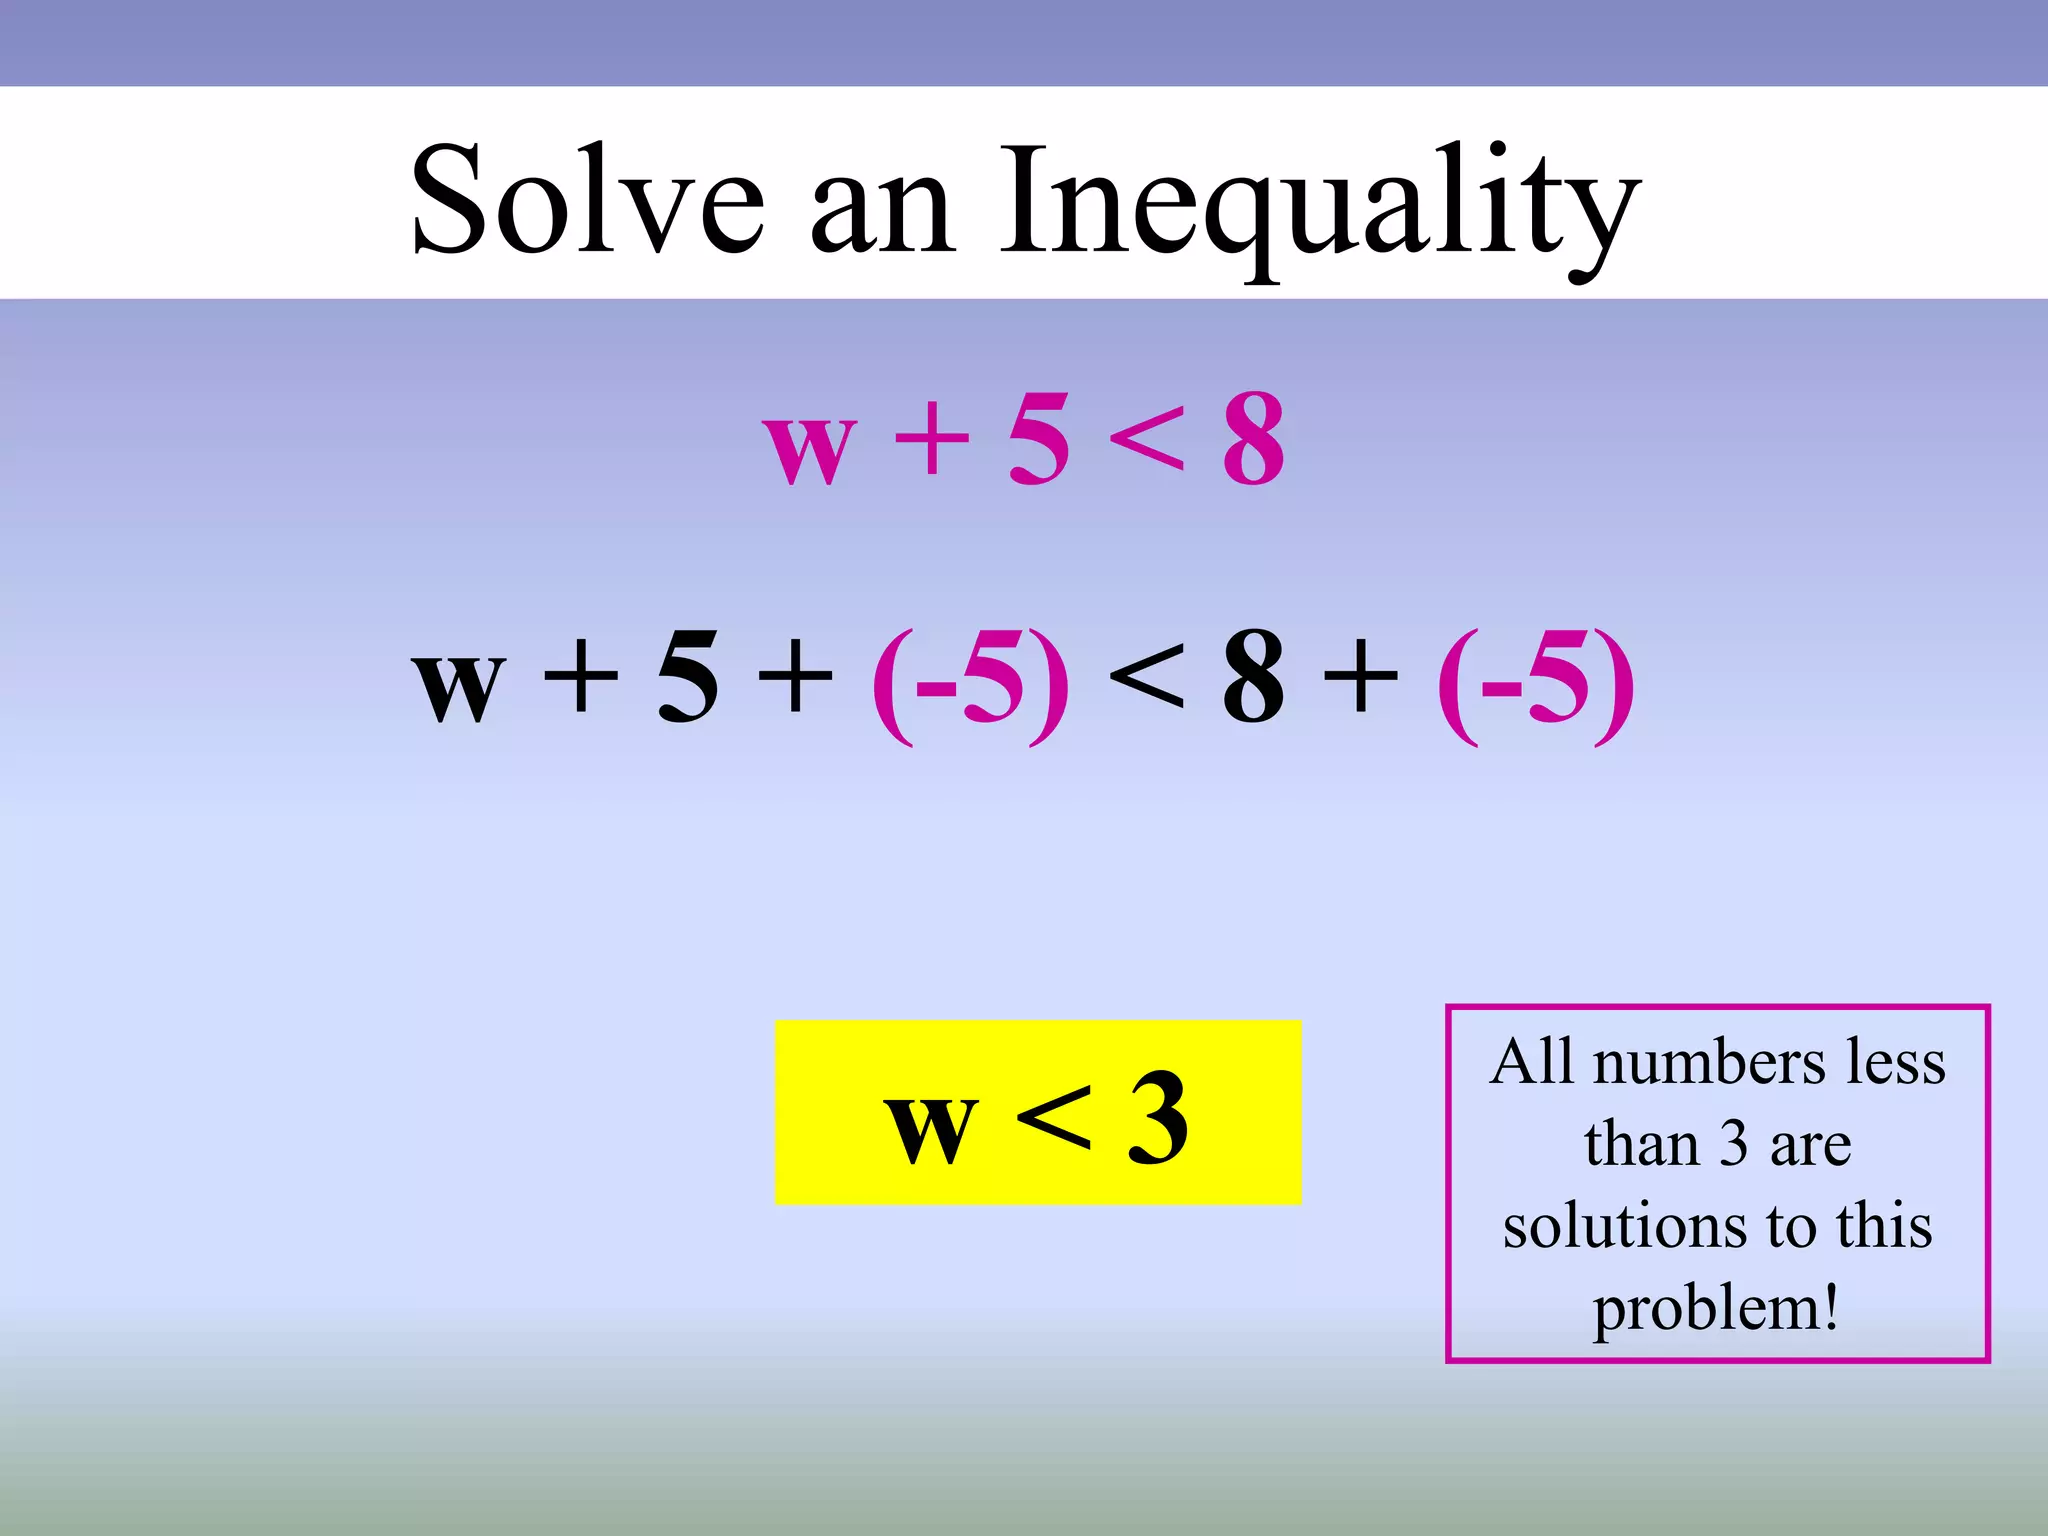
Solve an Inequality
w+ 5 < 8
w + 5 + (-5) < 8 + (-5)
w < 3
All numbers less
than 3 are
solutions to this
problem!
18.
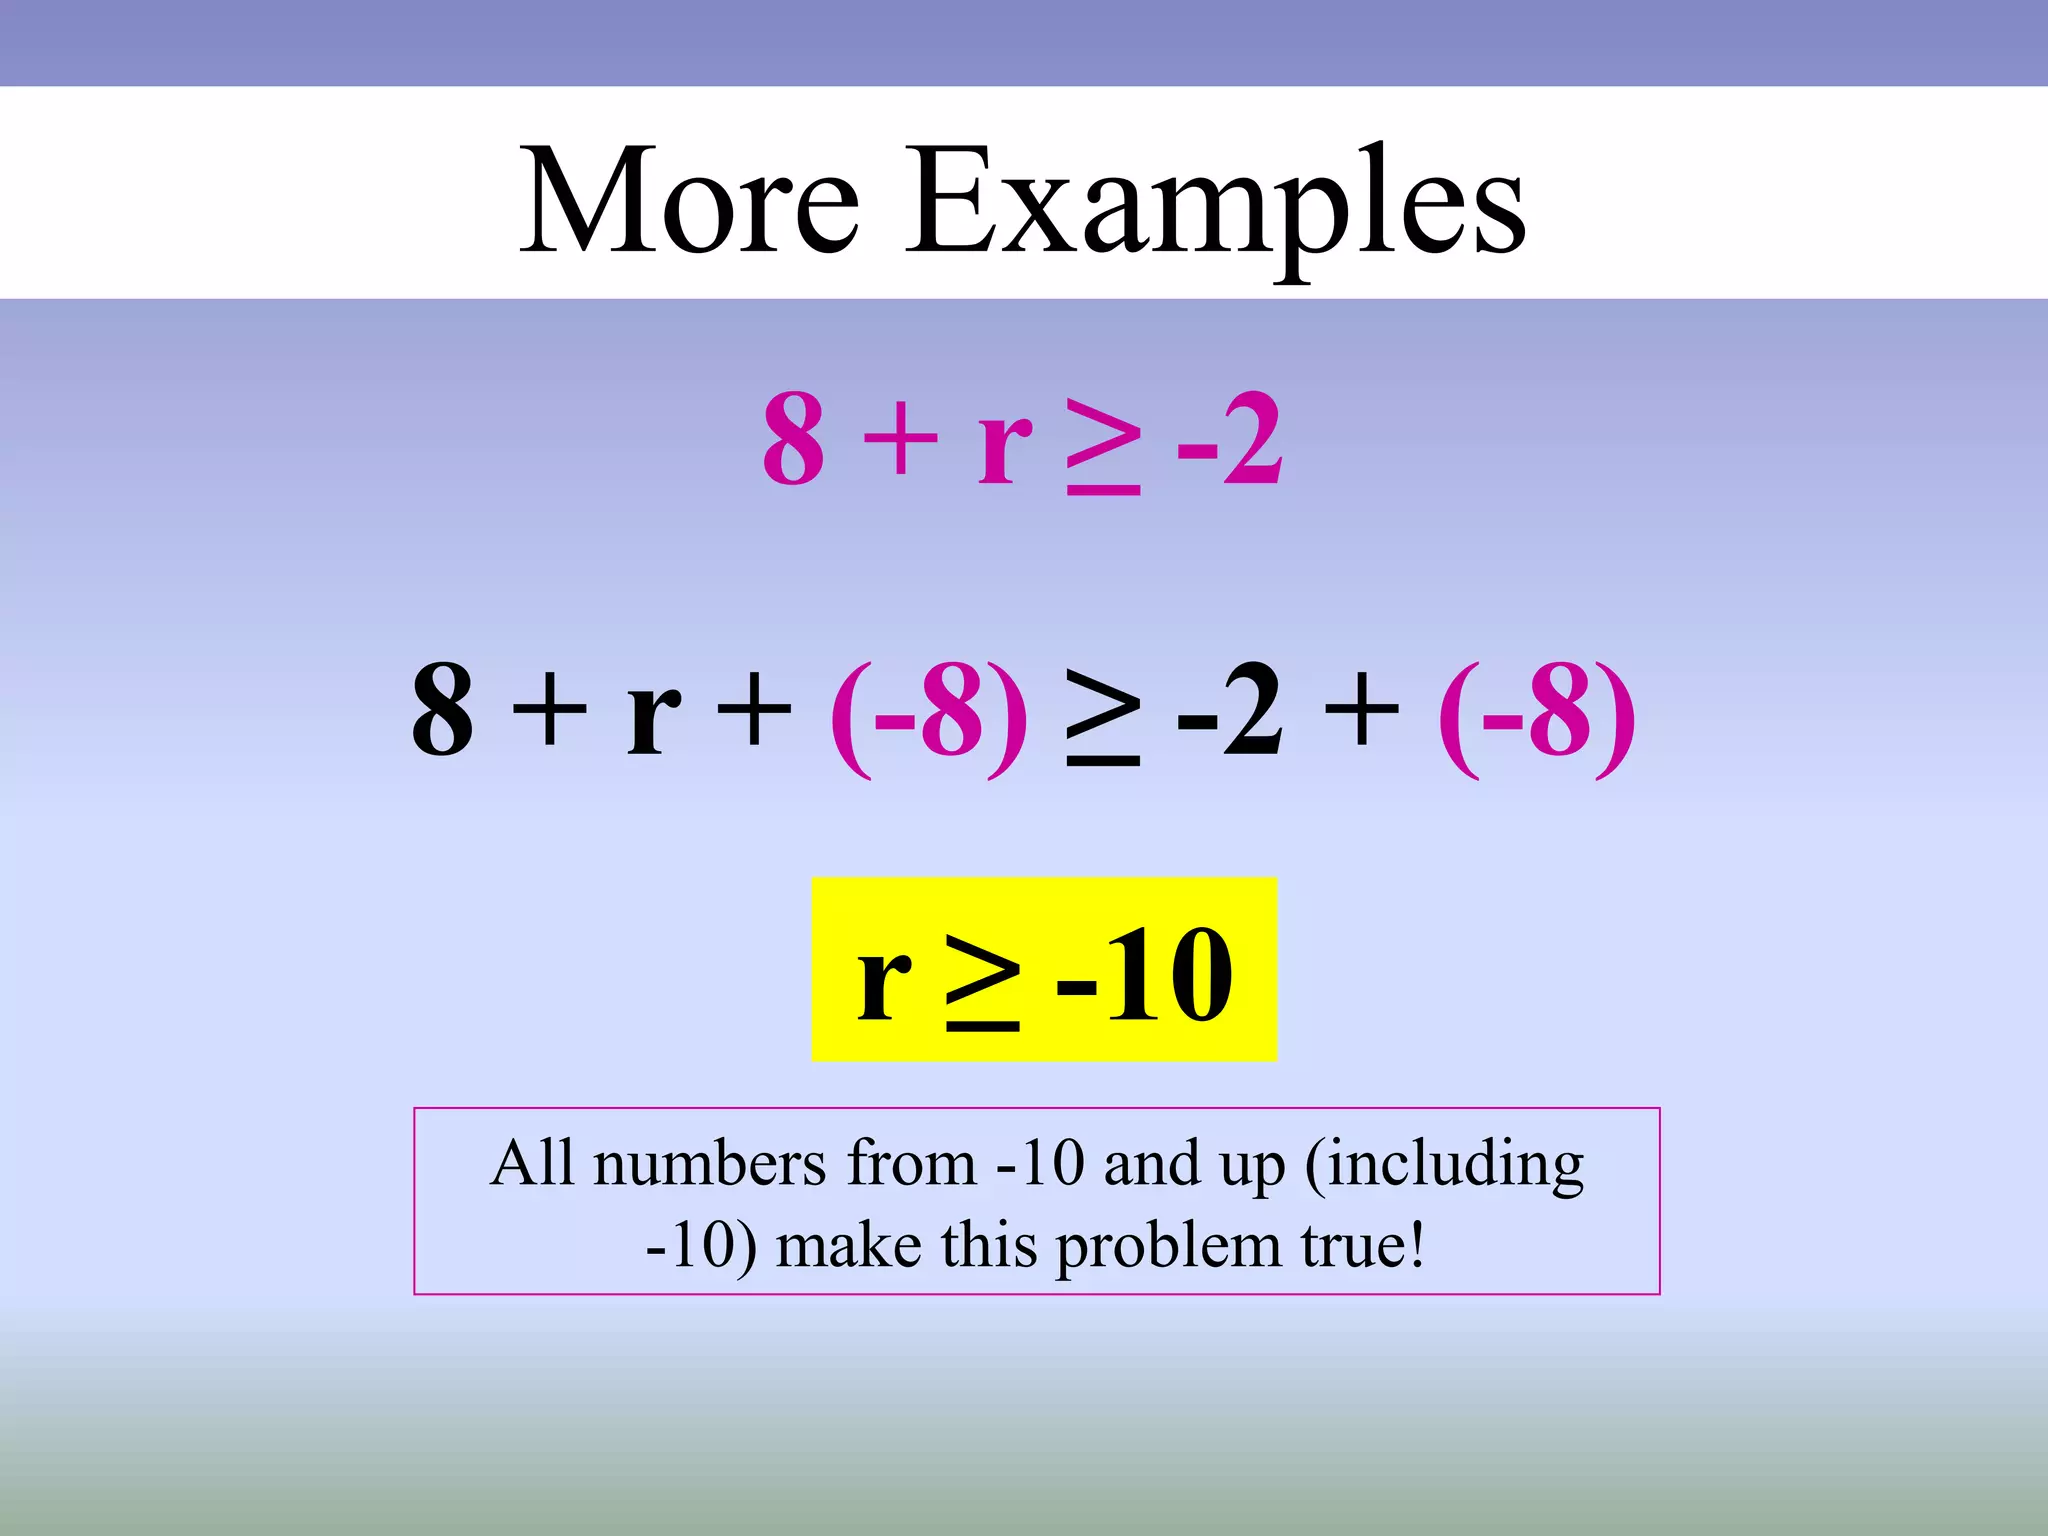
More Examples
8 +r ≥ -2
8 + r + (-8) ≥ -2 + (-8)
r ≥ -10
All numbers from -10 and up (including
-10) make this problem true!
19.
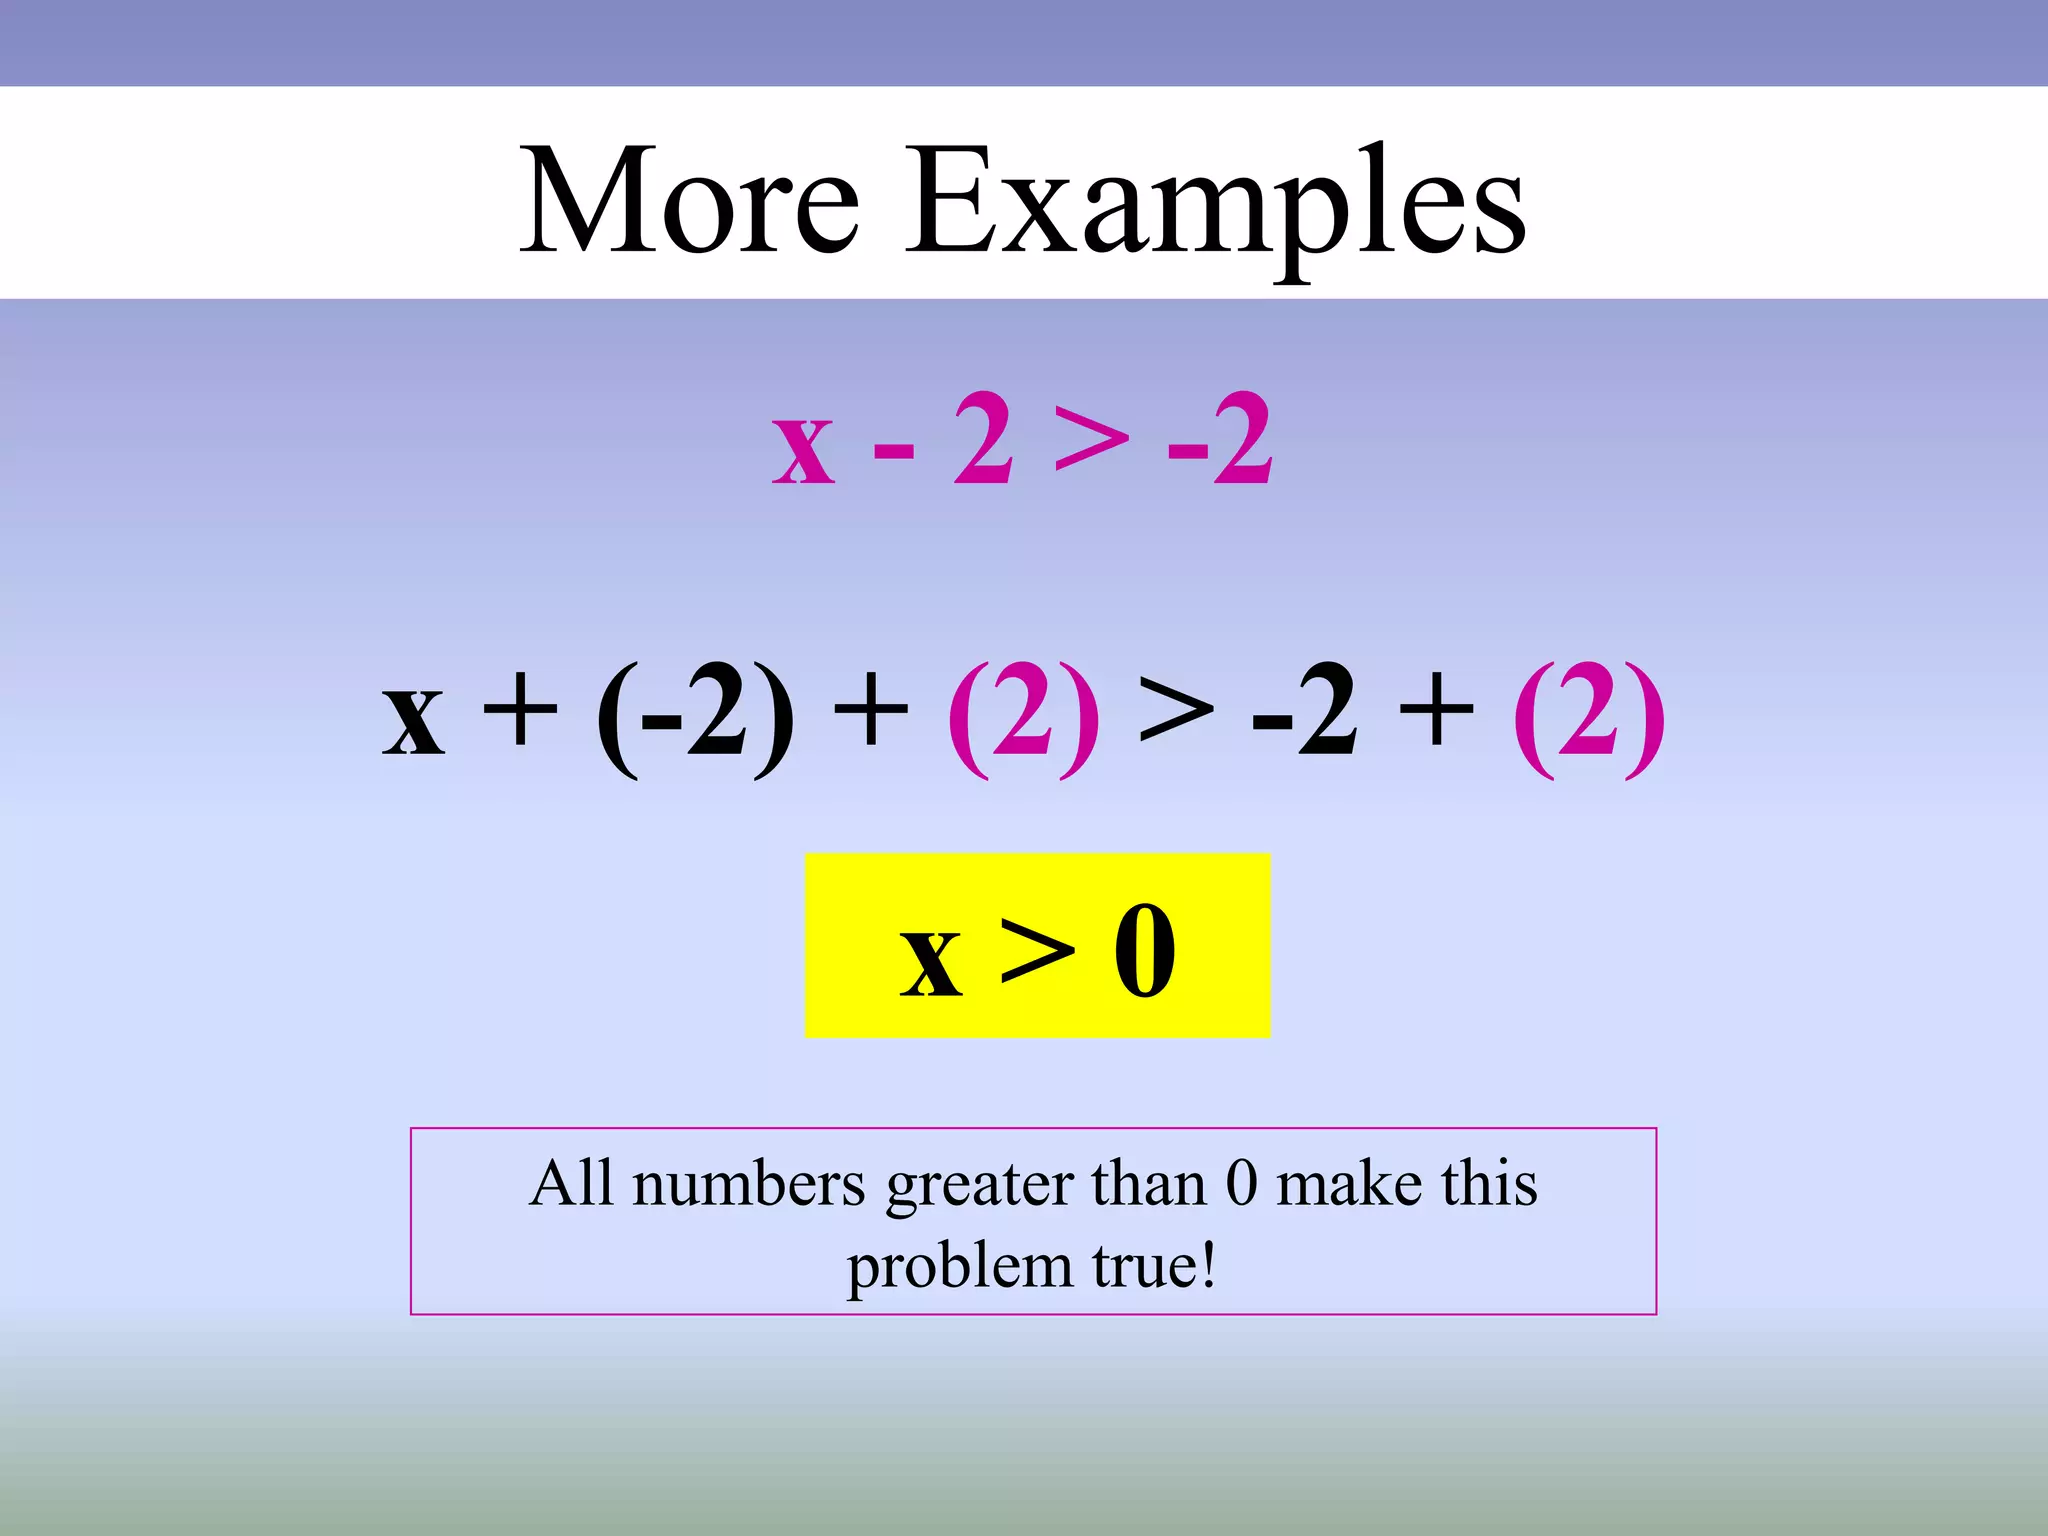
More Examples
x -2 > -2
x + (-2) + (2) > -2 + (2)
x > 0
All numbers greater than 0 make this
problem true!
20.
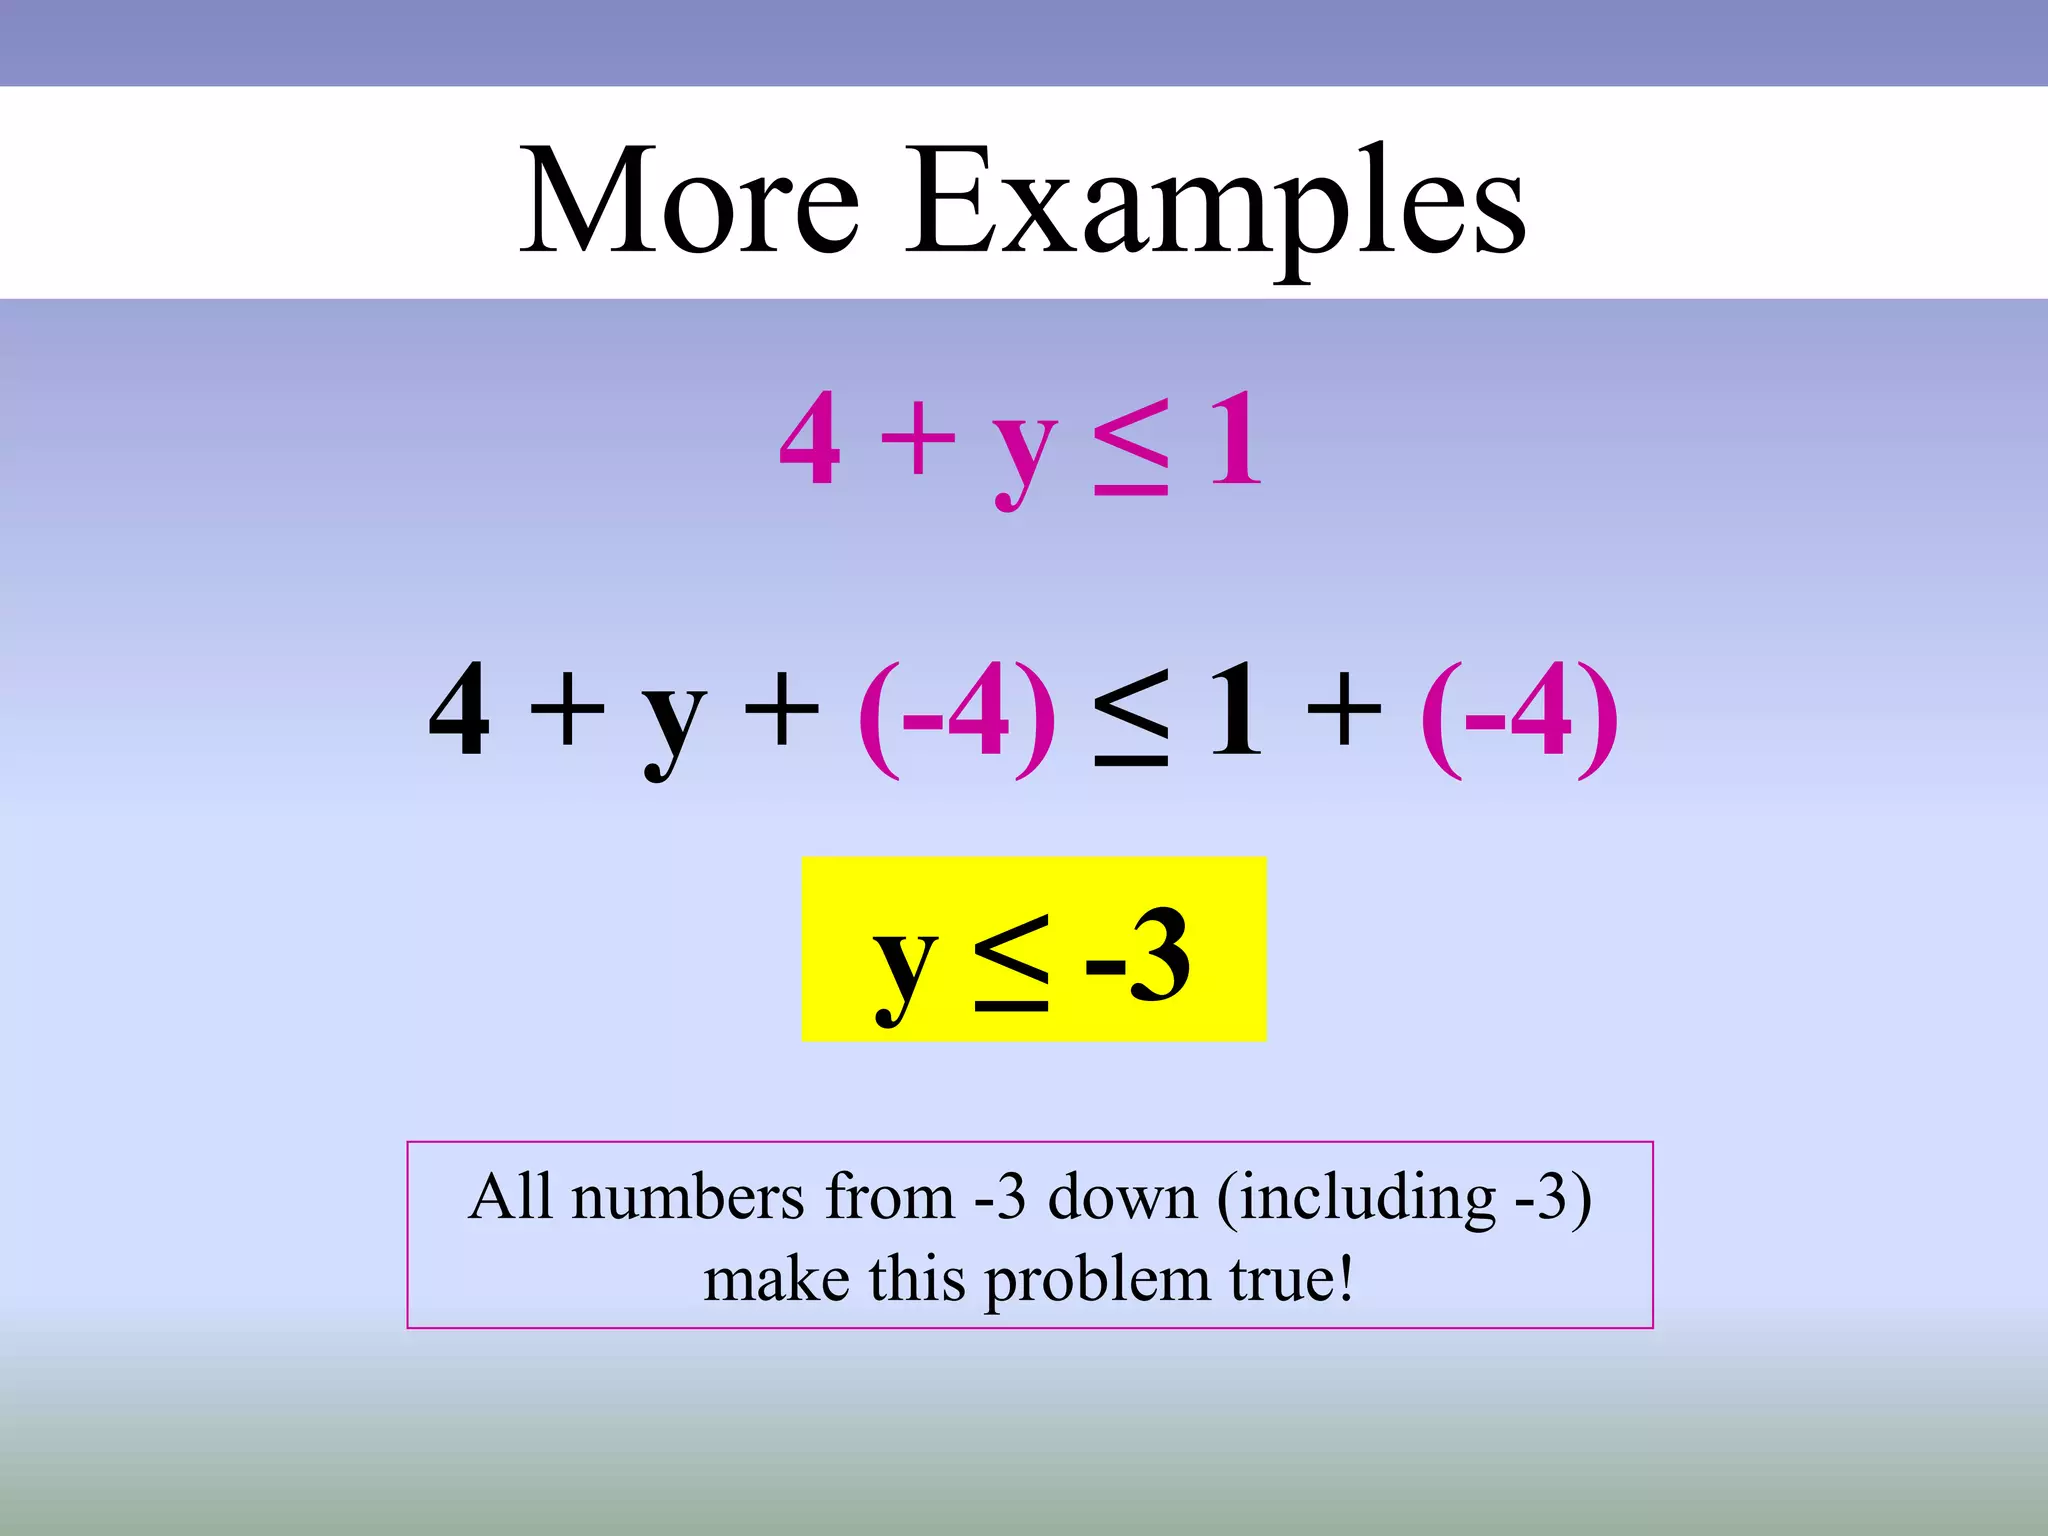
More Examples
4 +y ≤ 1
4 + y + (-4) ≤ 1 + (-4)
y ≤ -3
All numbers from -3 down (including -3)
make this problem true!
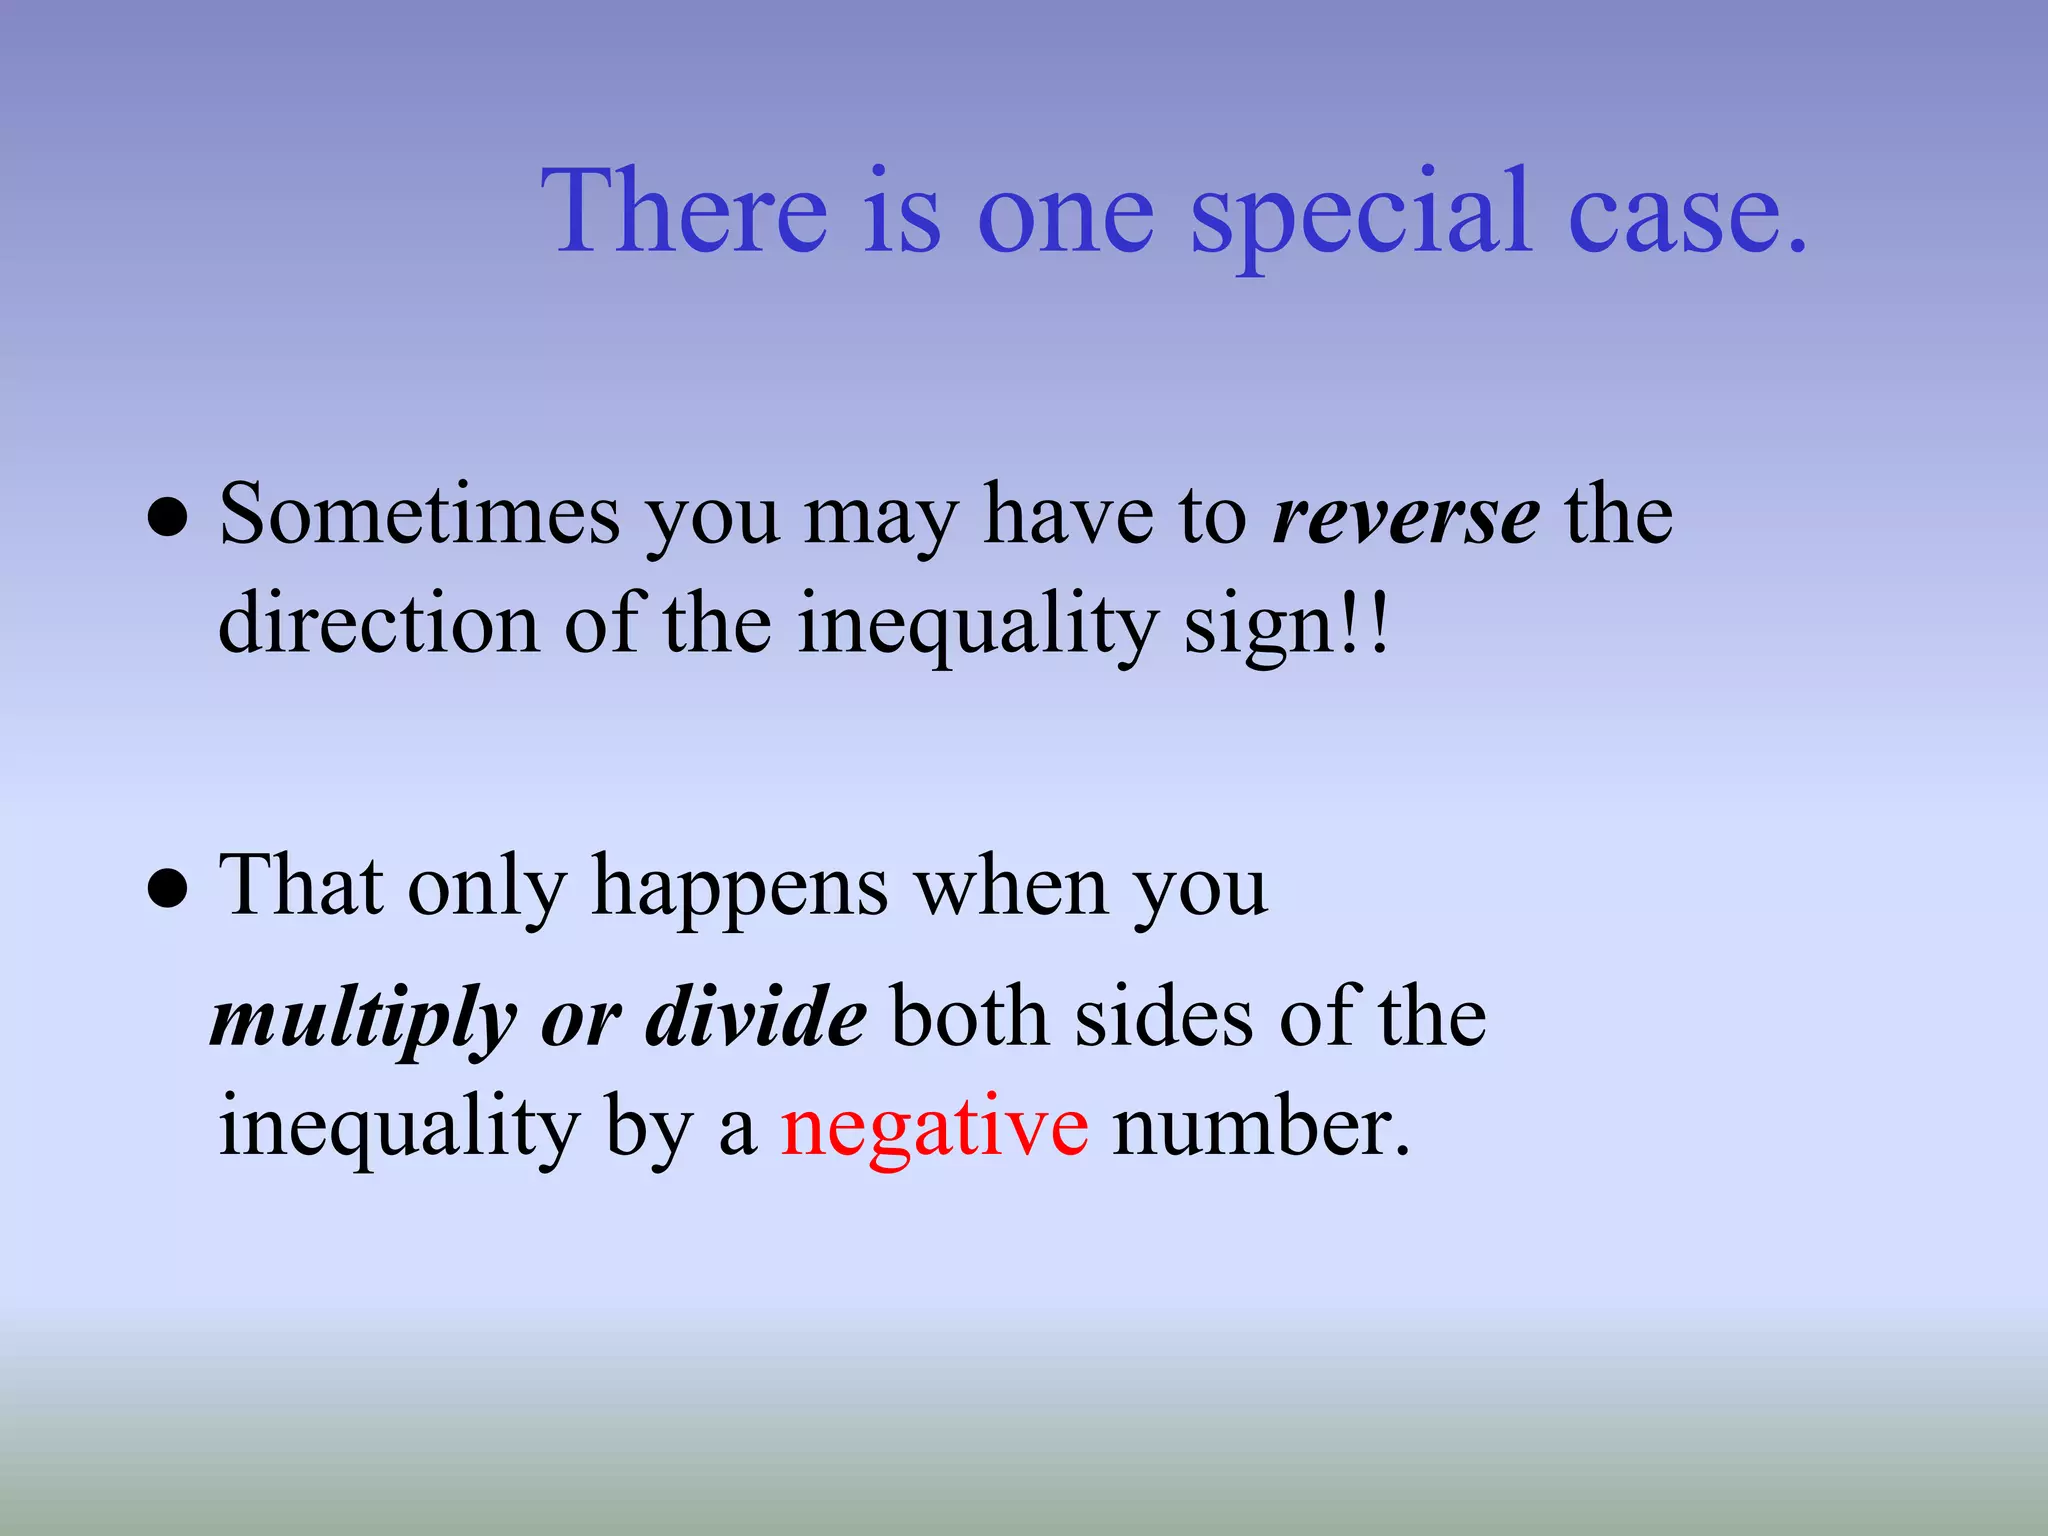
21.
There is onespecial case.
● Sometimes you may have to reverse the
direction of the inequality sign!!
● That only happens when you
multiply or divide both sides of the
inequality by a negative number.
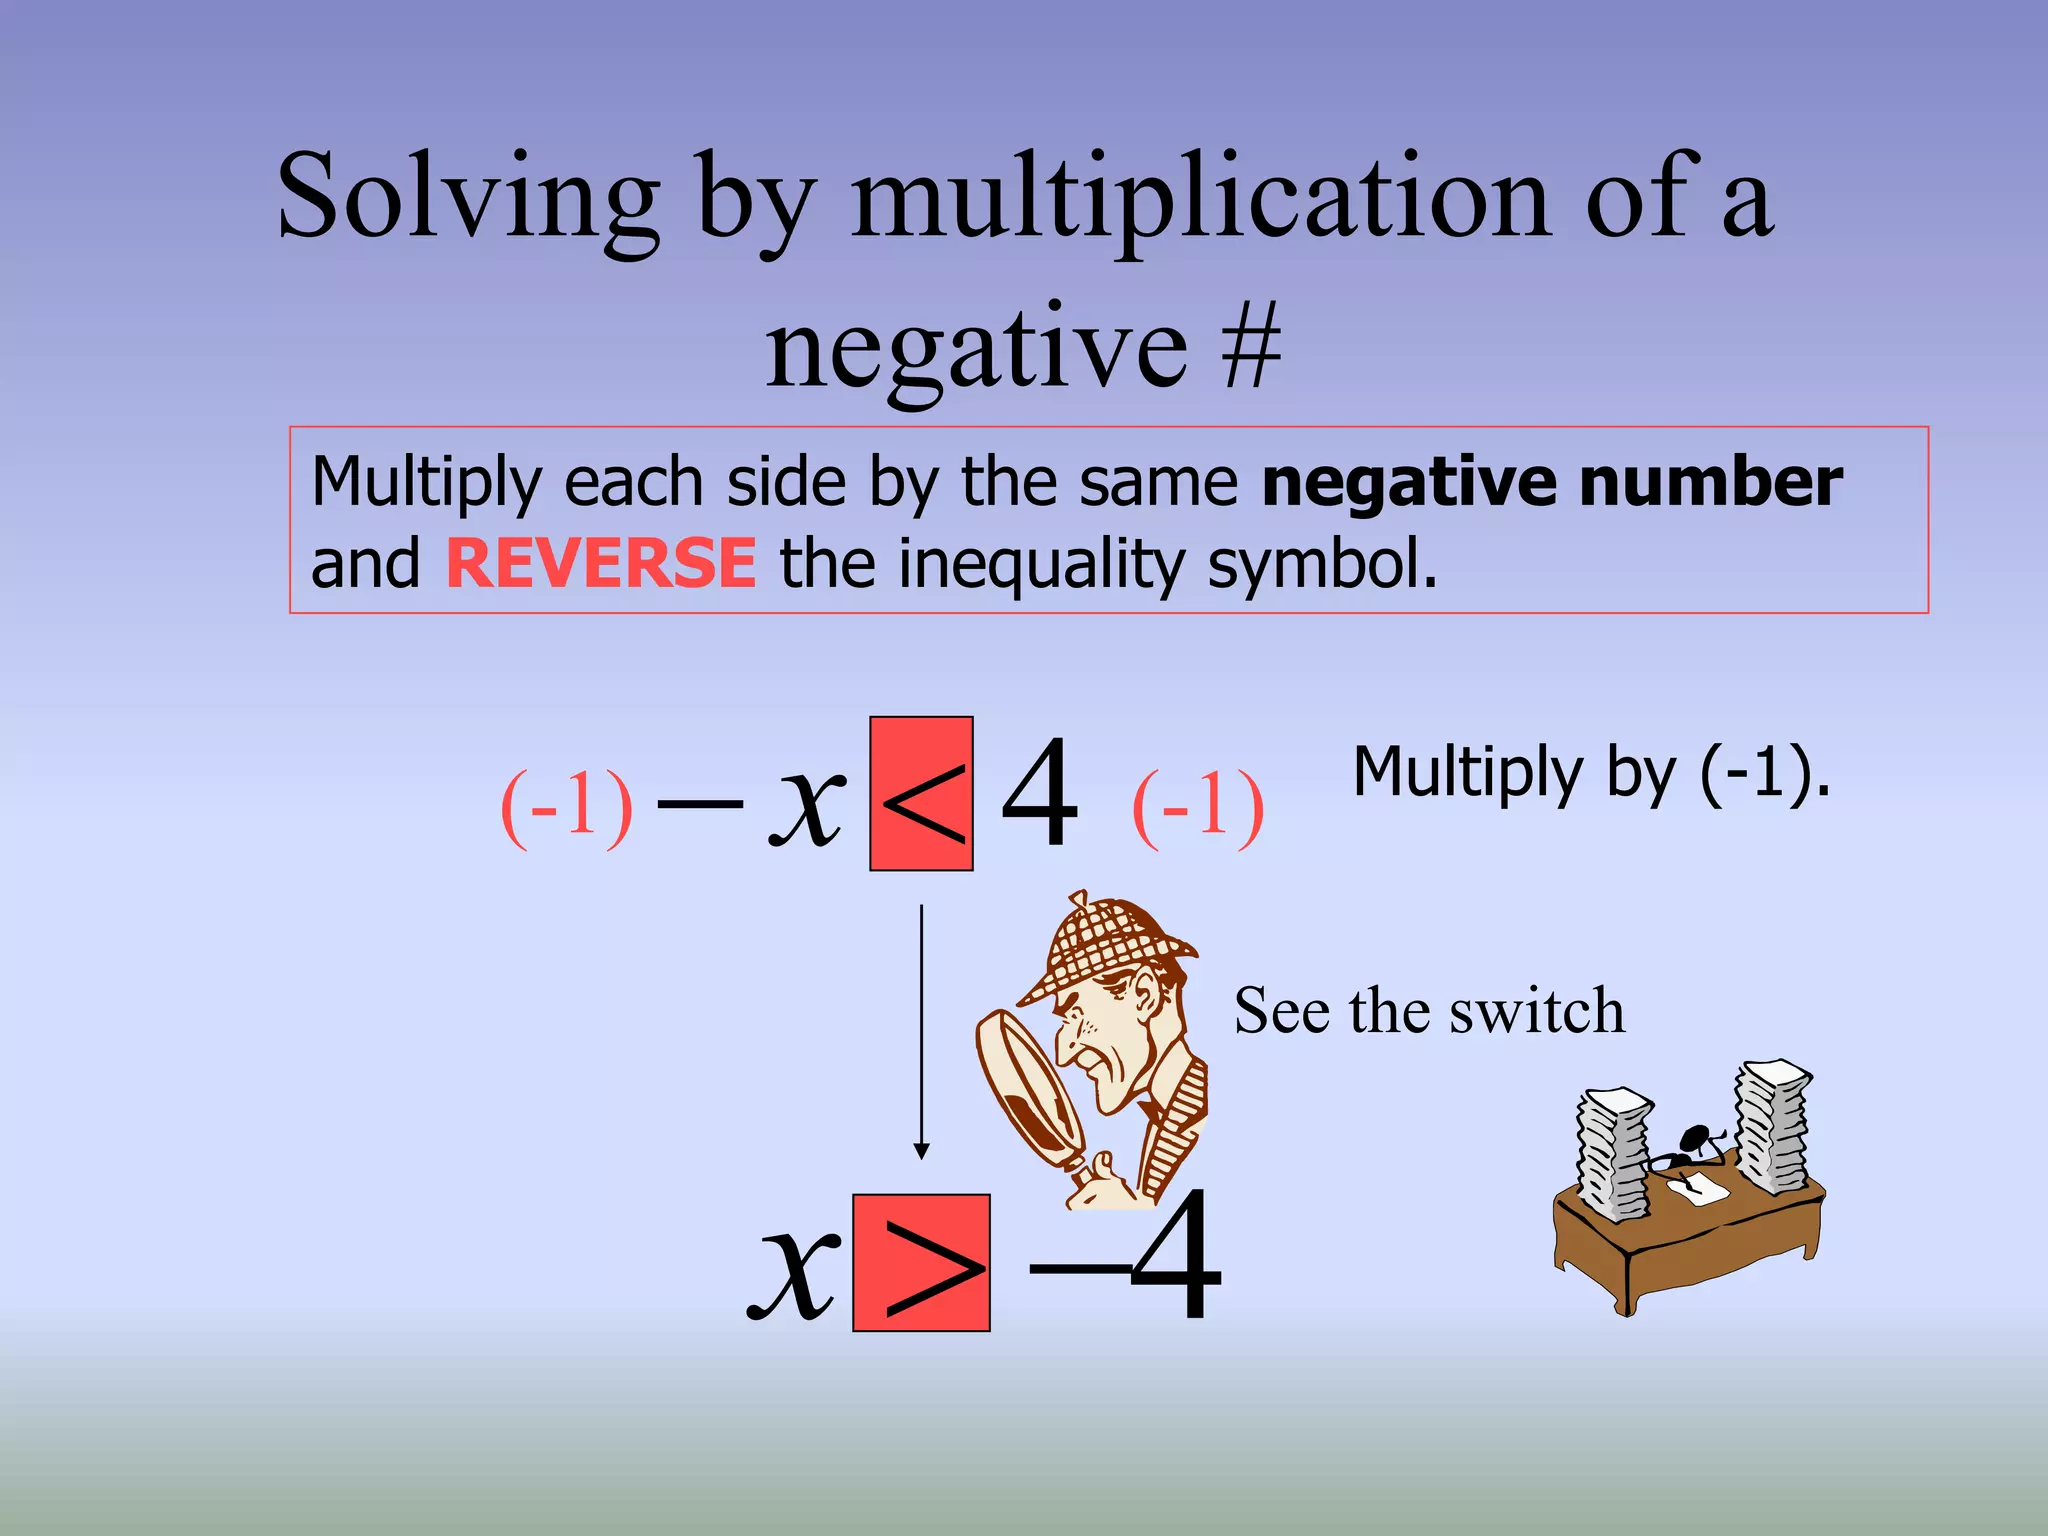
22.
Solving by multiplicationof a
negative #
Multiply each side by the same negative number
and REVERSE the inequality symbol.
4
x Multiply by (-1).
4
x
(-1) (-1)
See the switch
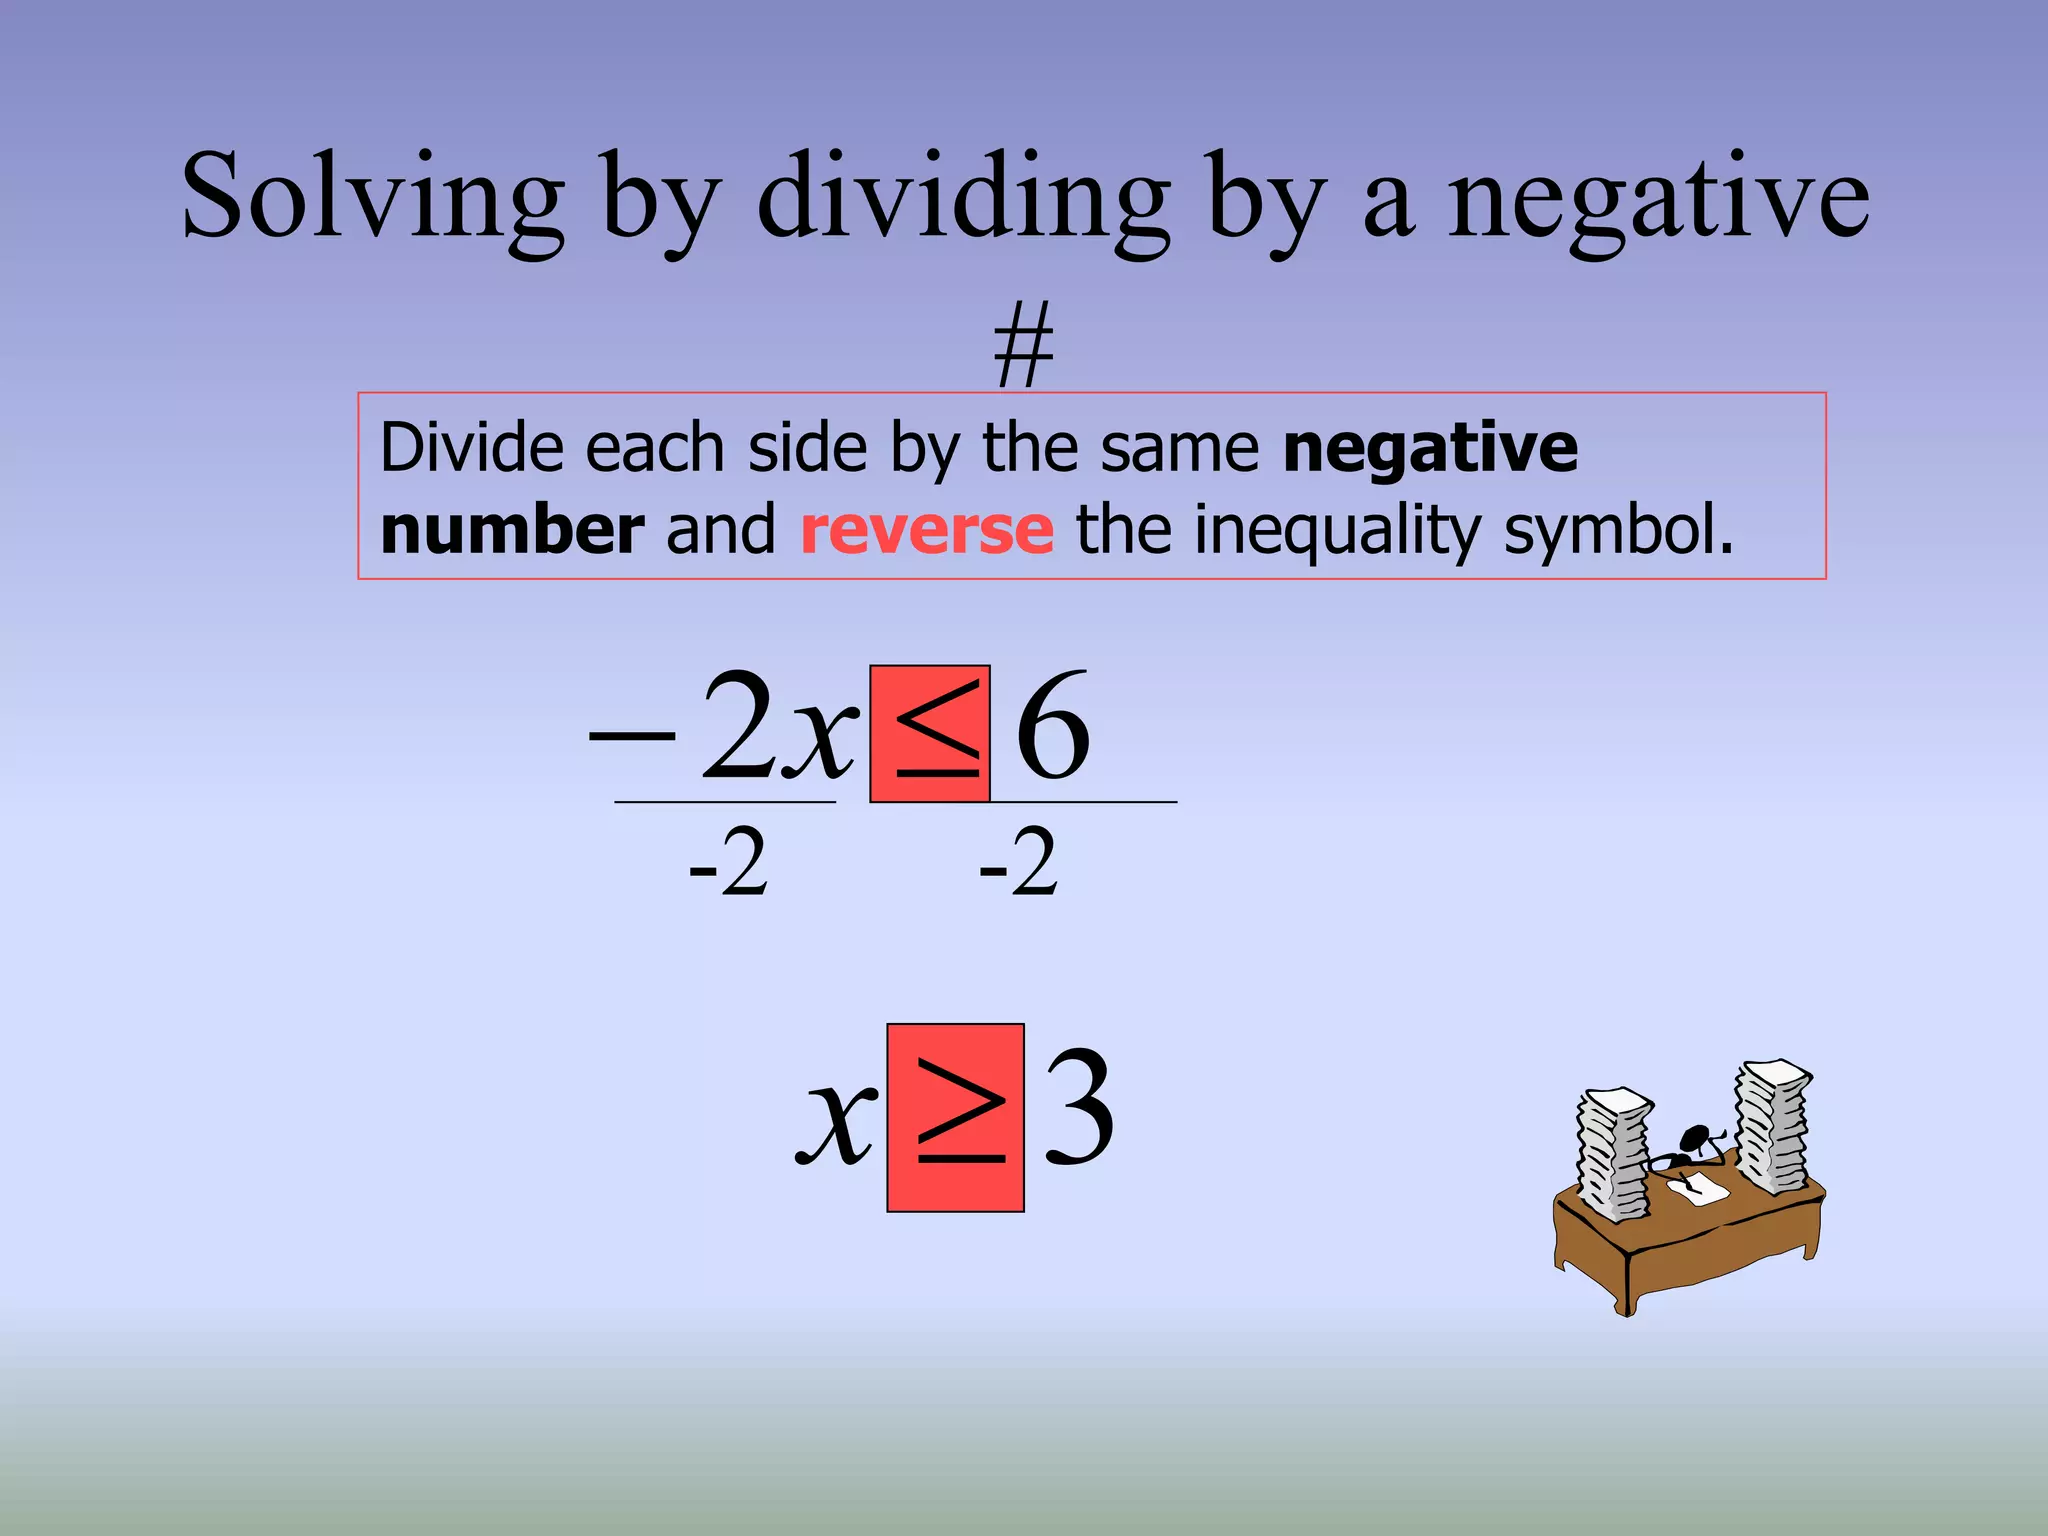
23.
Solving by dividingby a negative
#
Divide each side by the same negative
number and reverse the inequality symbol.
6
2
x
3
x
-2 -2
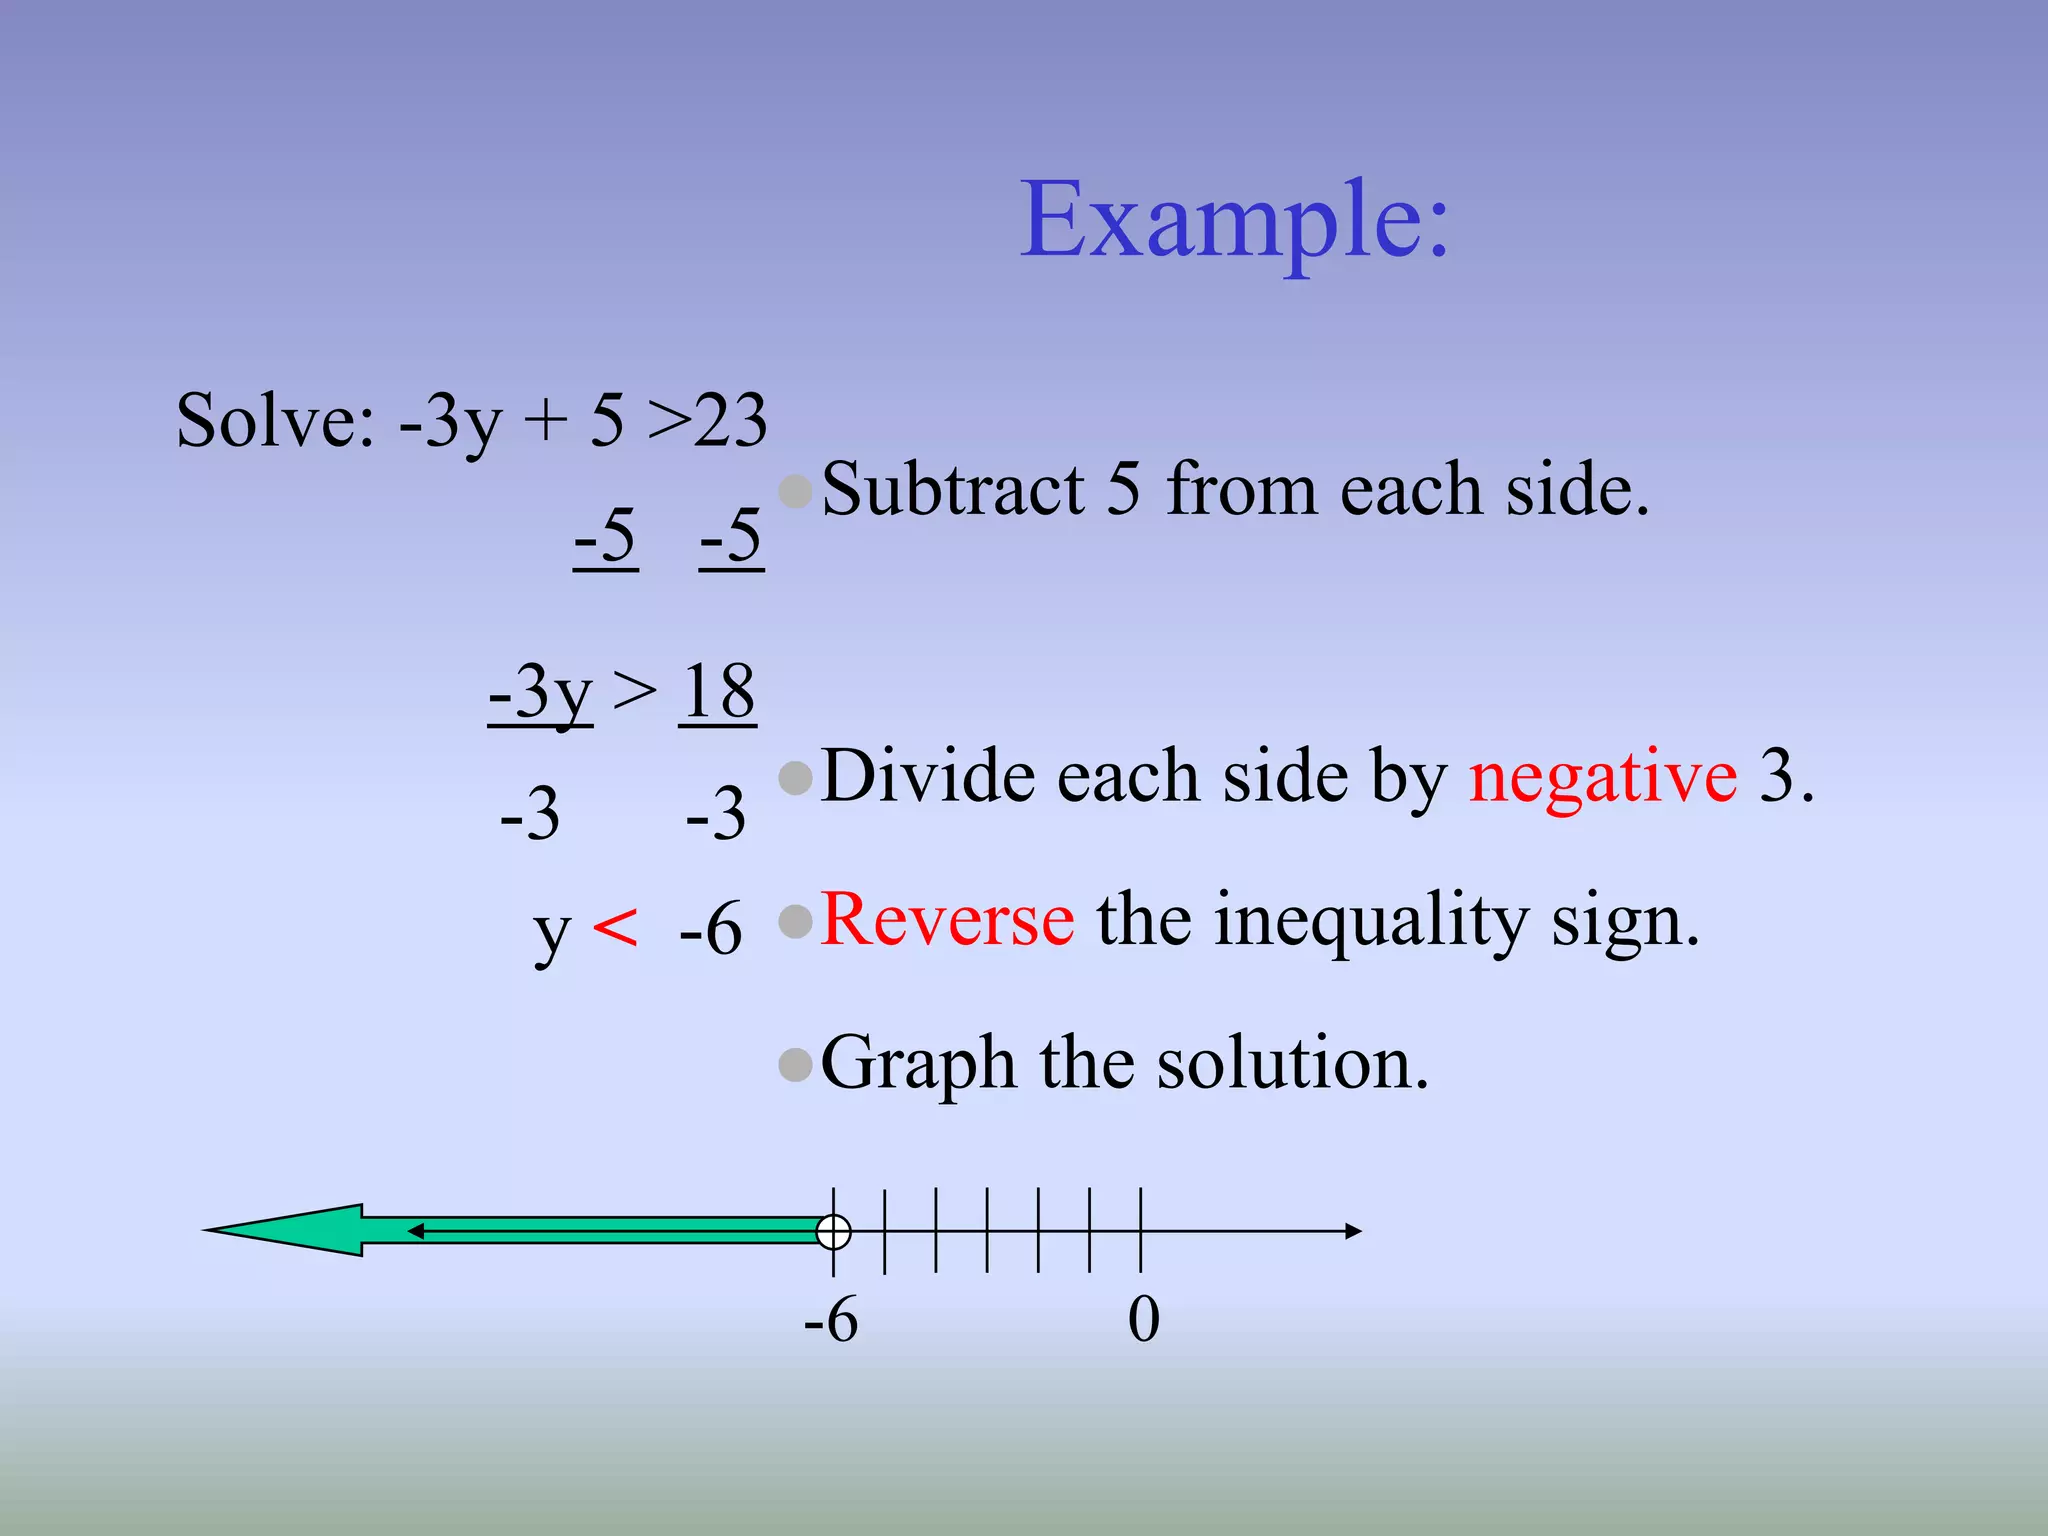
24.
Example:
Solve: -3y +5 >23
-5 -5
-3y > 18
-3 -3
y < -6
●Subtract 5 from each side.
●Divide each side by negative 3.
●Reverse the inequality sign.
●Graph the solution.
0
-6
25.
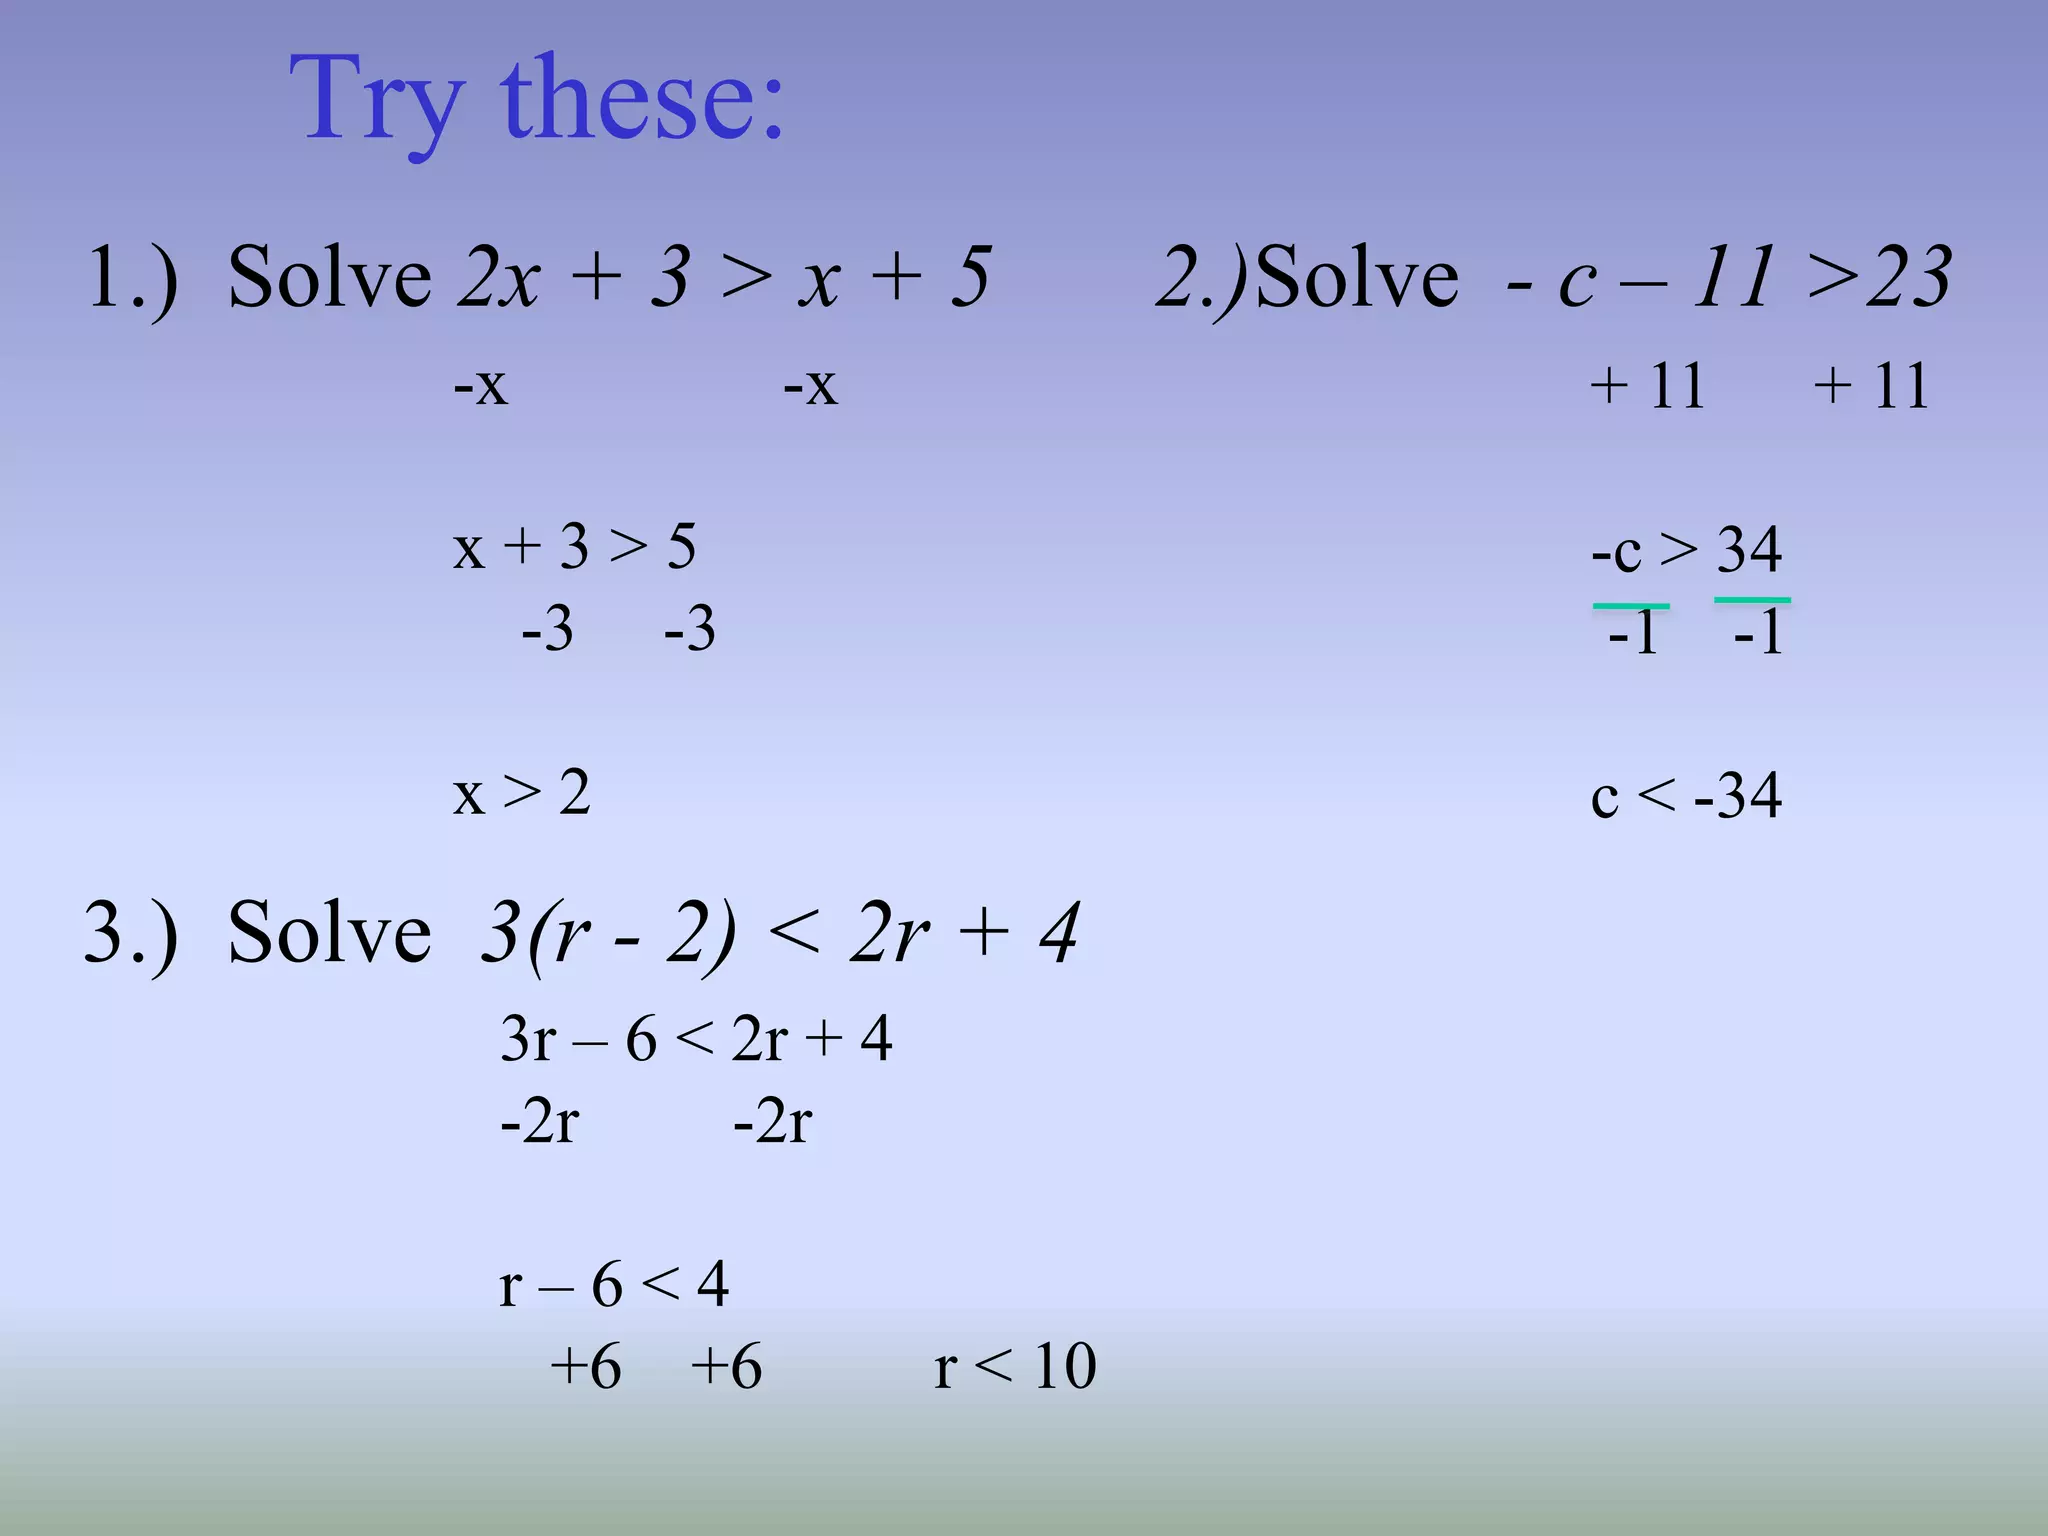
Try these:
1.) Solve2x + 3 > x + 5 2.)Solve - c – 11 >23
3.) Solve 3(r - 2) < 2r + 4
-x -x
x + 3 > 5
-3 -3
x > 2
+ 11 + 11
-c > 34
-1 -1
c < -34
3r – 6 < 2r + 4
-2r -2r
r – 6 < 4
+6 +6 r < 10
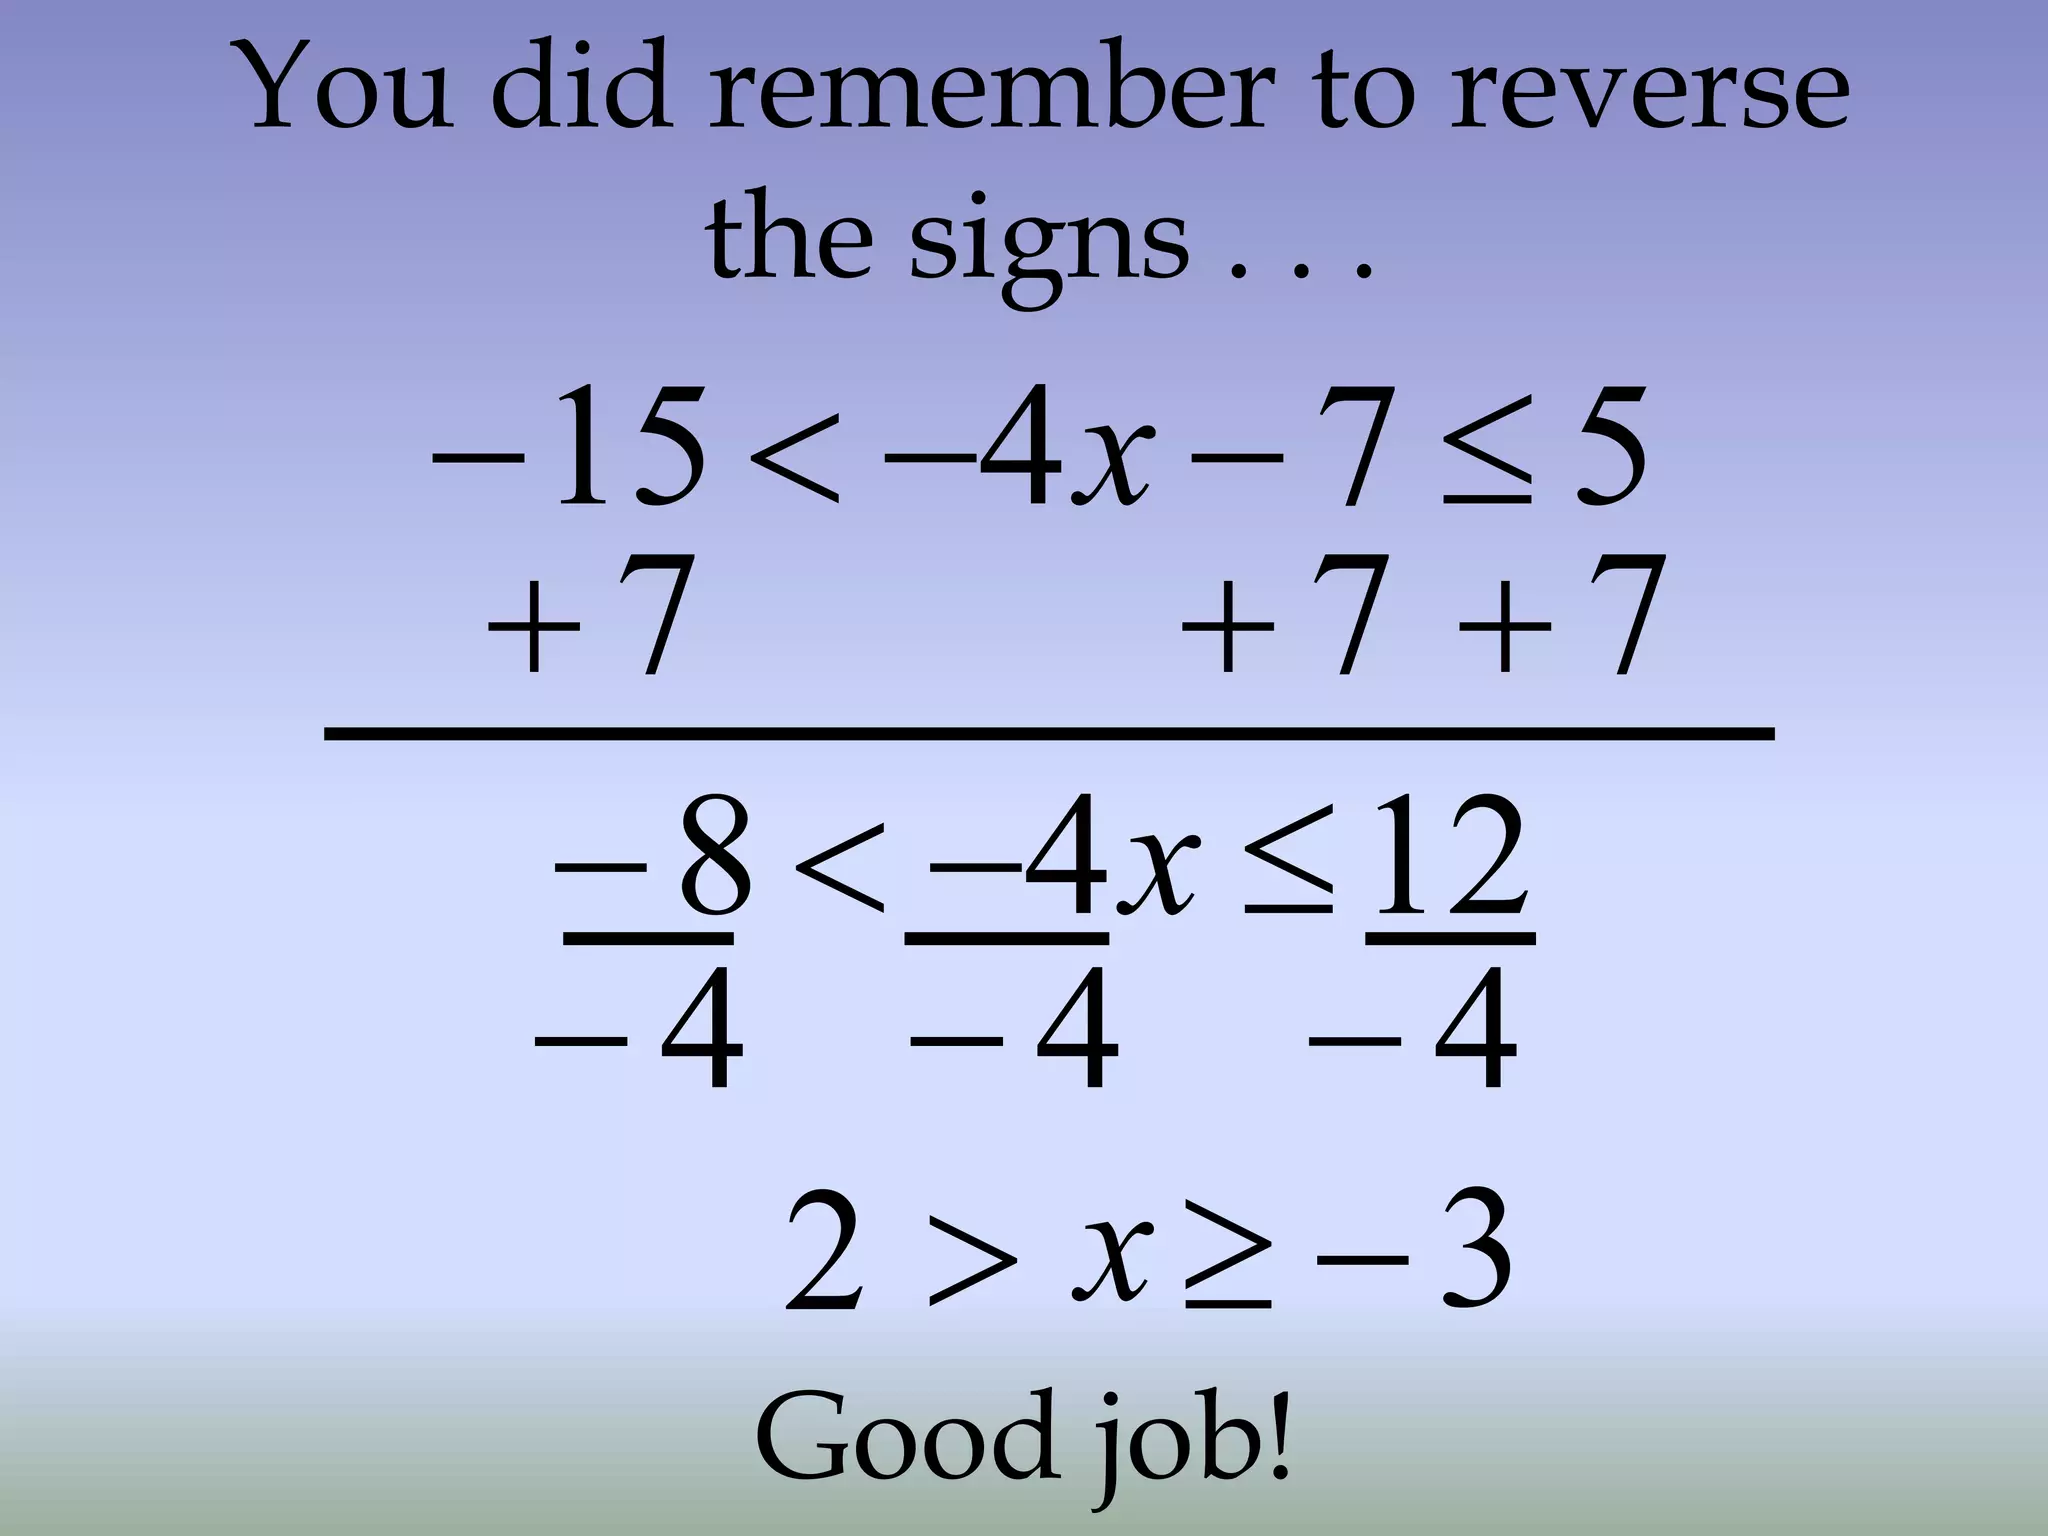
26.
You did rememberto reverse
the signs . . .
5
7
4
15
x
7
7
12
4
8
x
4
7
4
4
2 x 3
Good job!
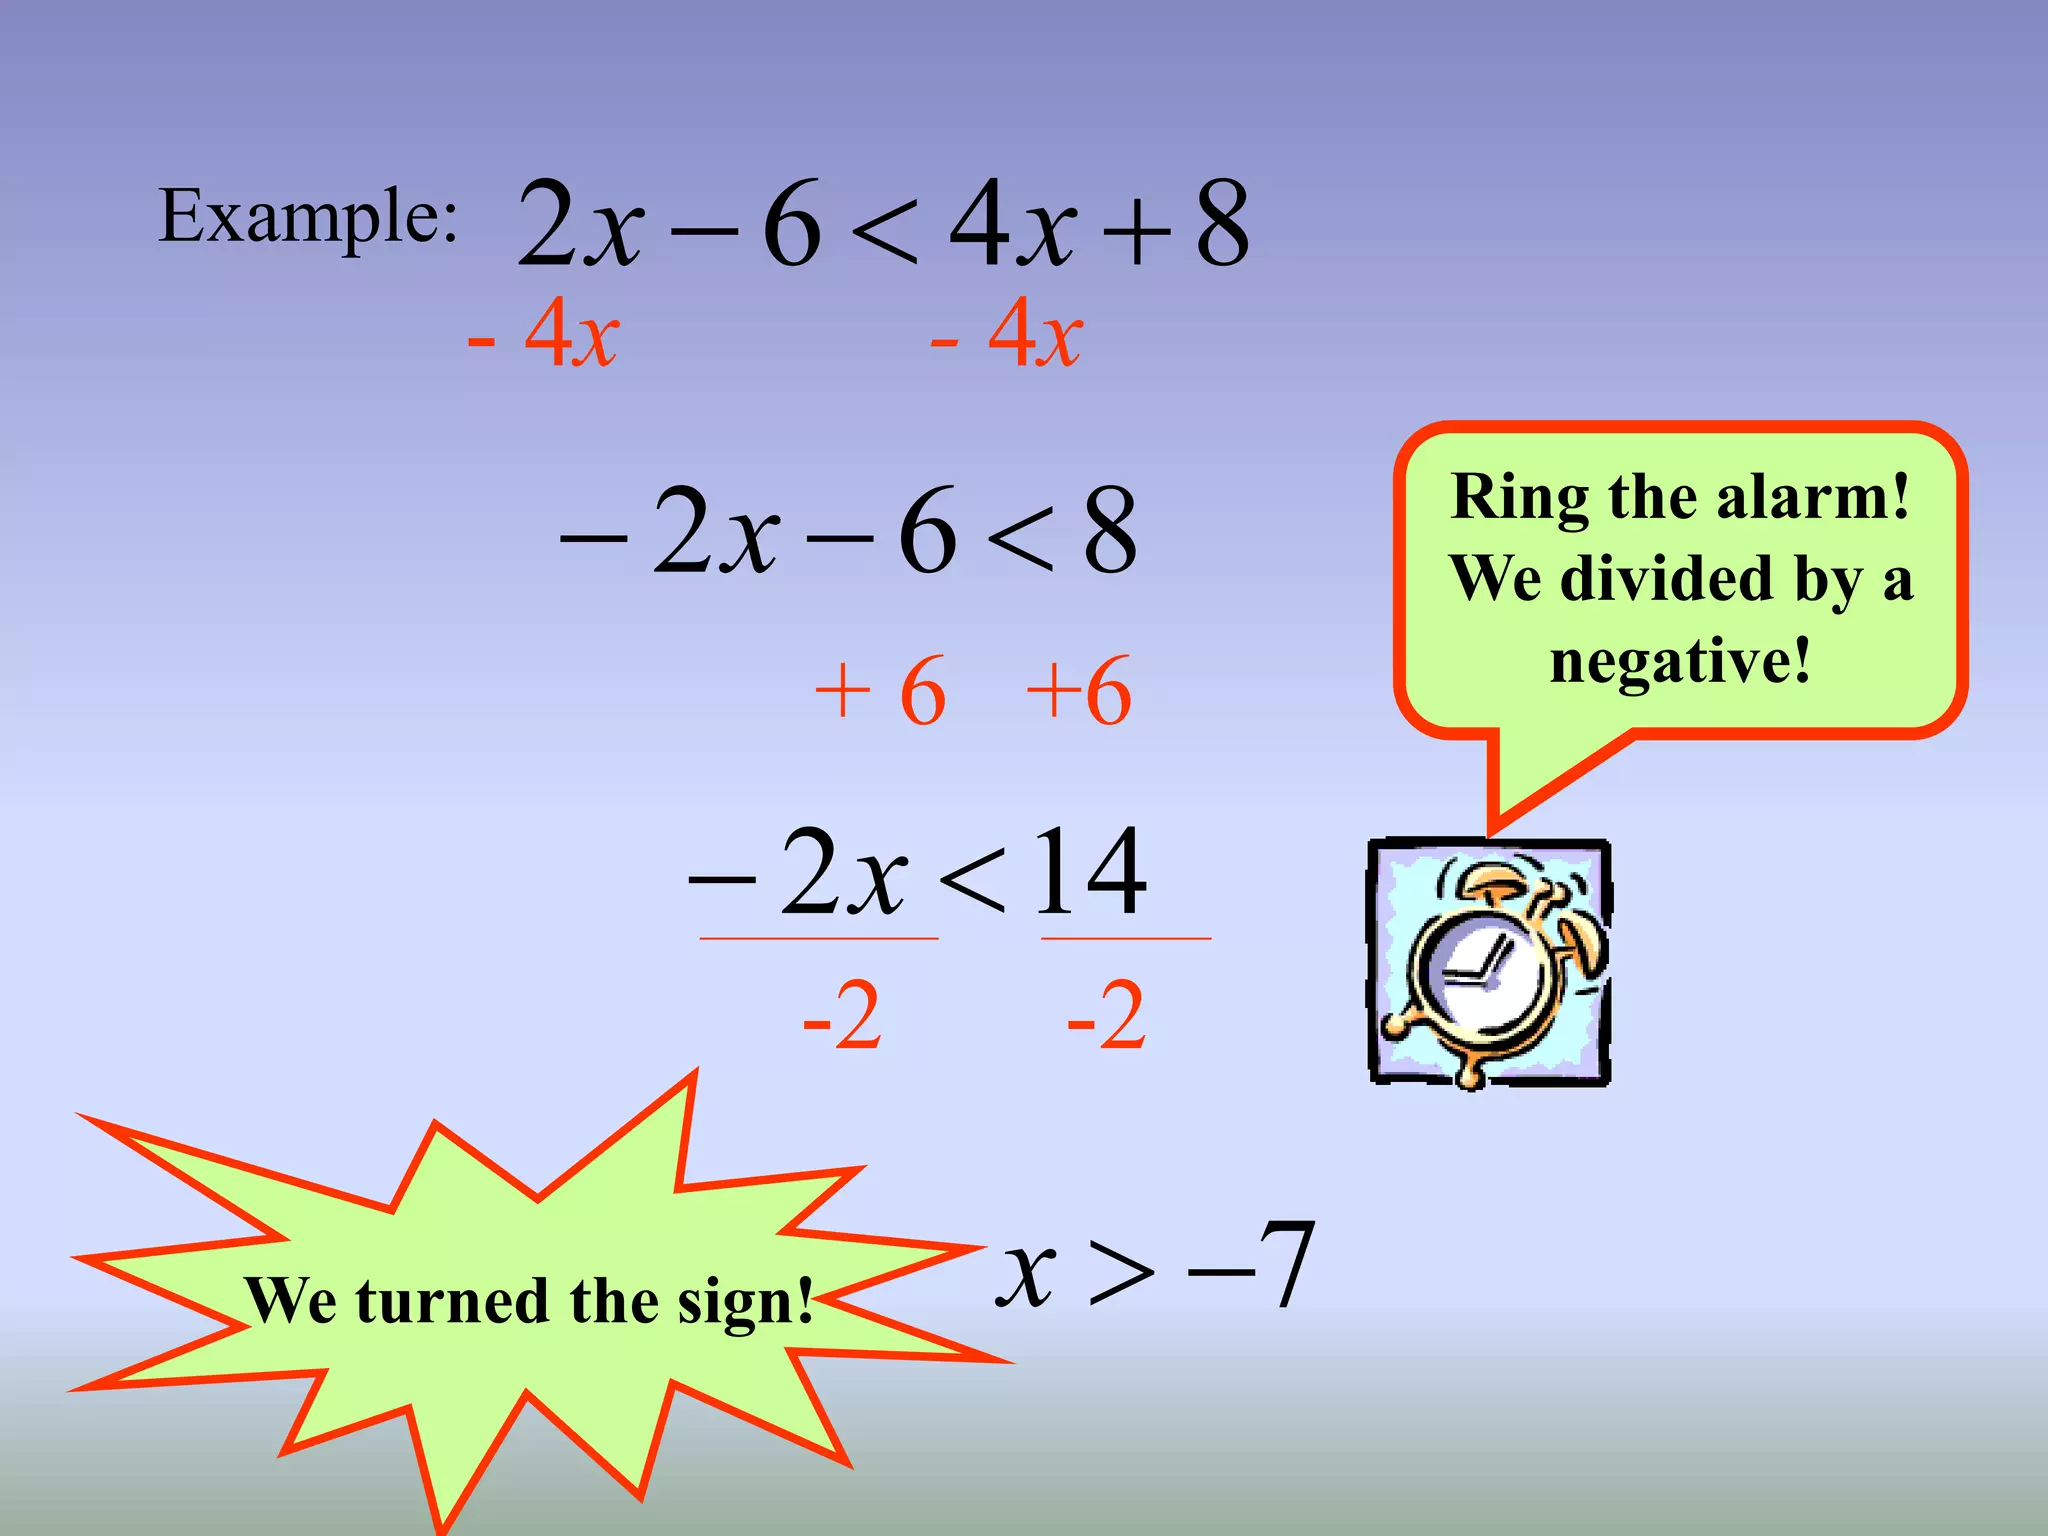
27.
Example: 8
4
6
2
x
x
- 4x - 4x
8
6
2
x
+ 6 +6
14
2
x
-2 -2
Ring the alarm!
We divided by a
negative!
7
x
We turned the sign!
28.
Solving and GraphingInequalities
Very Basics of Graphing Inequalities (on a number
line)
https://www.youtube.com/watch?v=nif2PKA9bXA
Graphing an inequality with the variable on the
right side and negative
https://www.youtube.com/watch?v=Em_Taf3_aRo
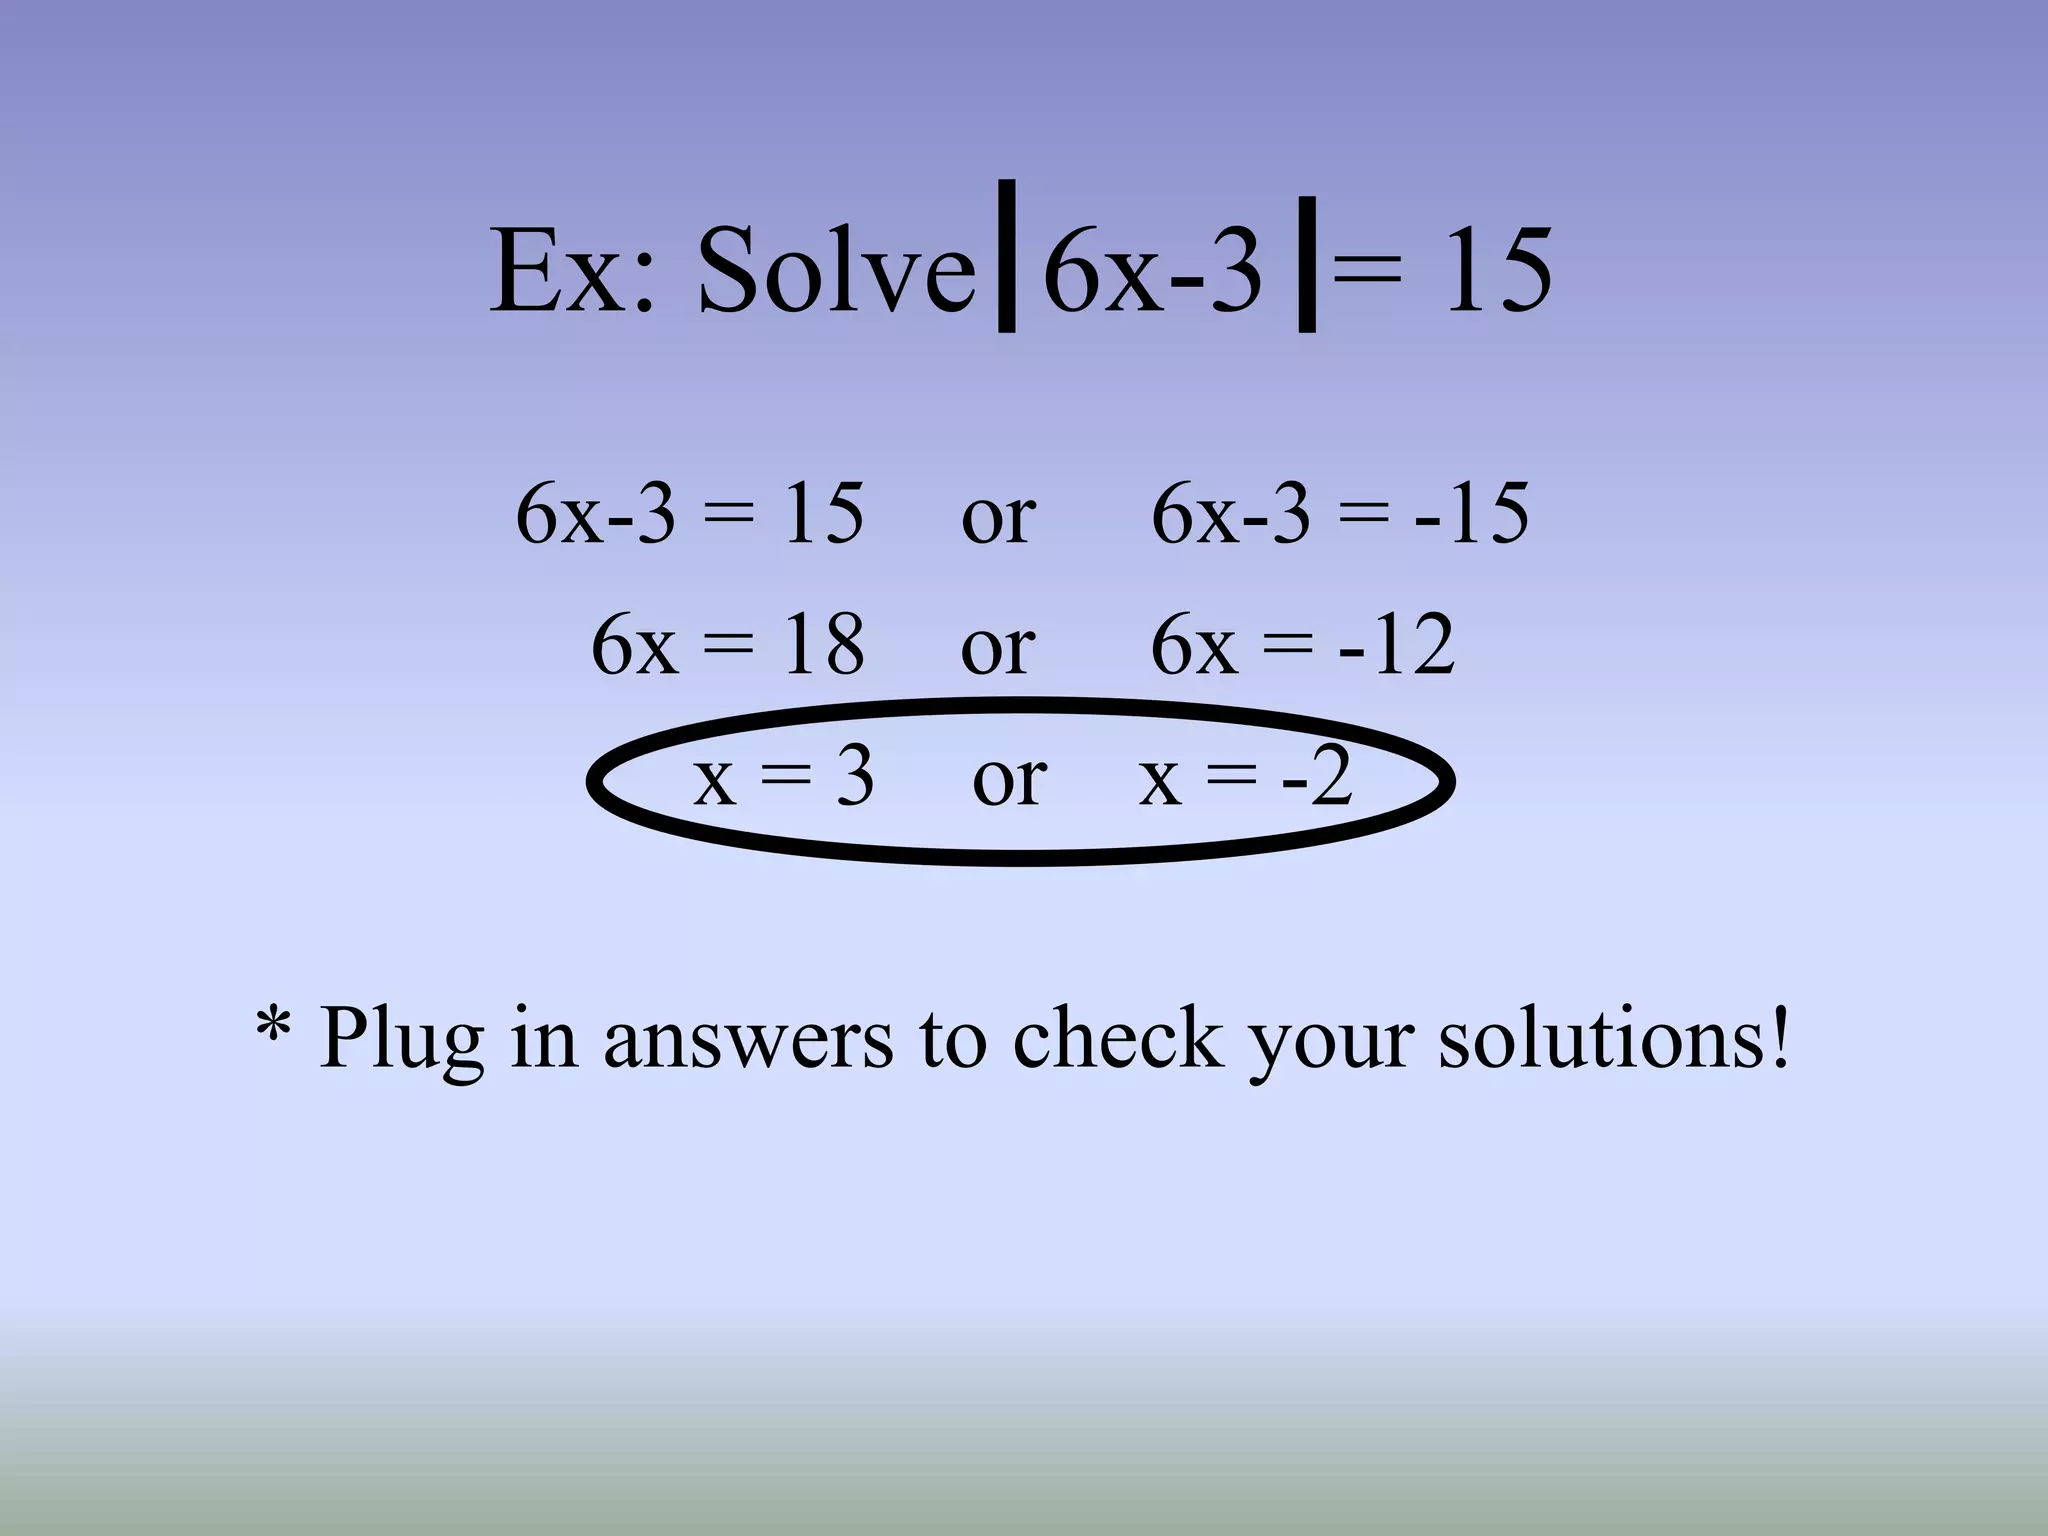
Ex: Solve 6x-3= 15
6x-3 = 15 or 6x-3 = -15
6x = 18 or 6x = -12
x = 3 or x = -2
* Plug in answers to check your solutions!
31.
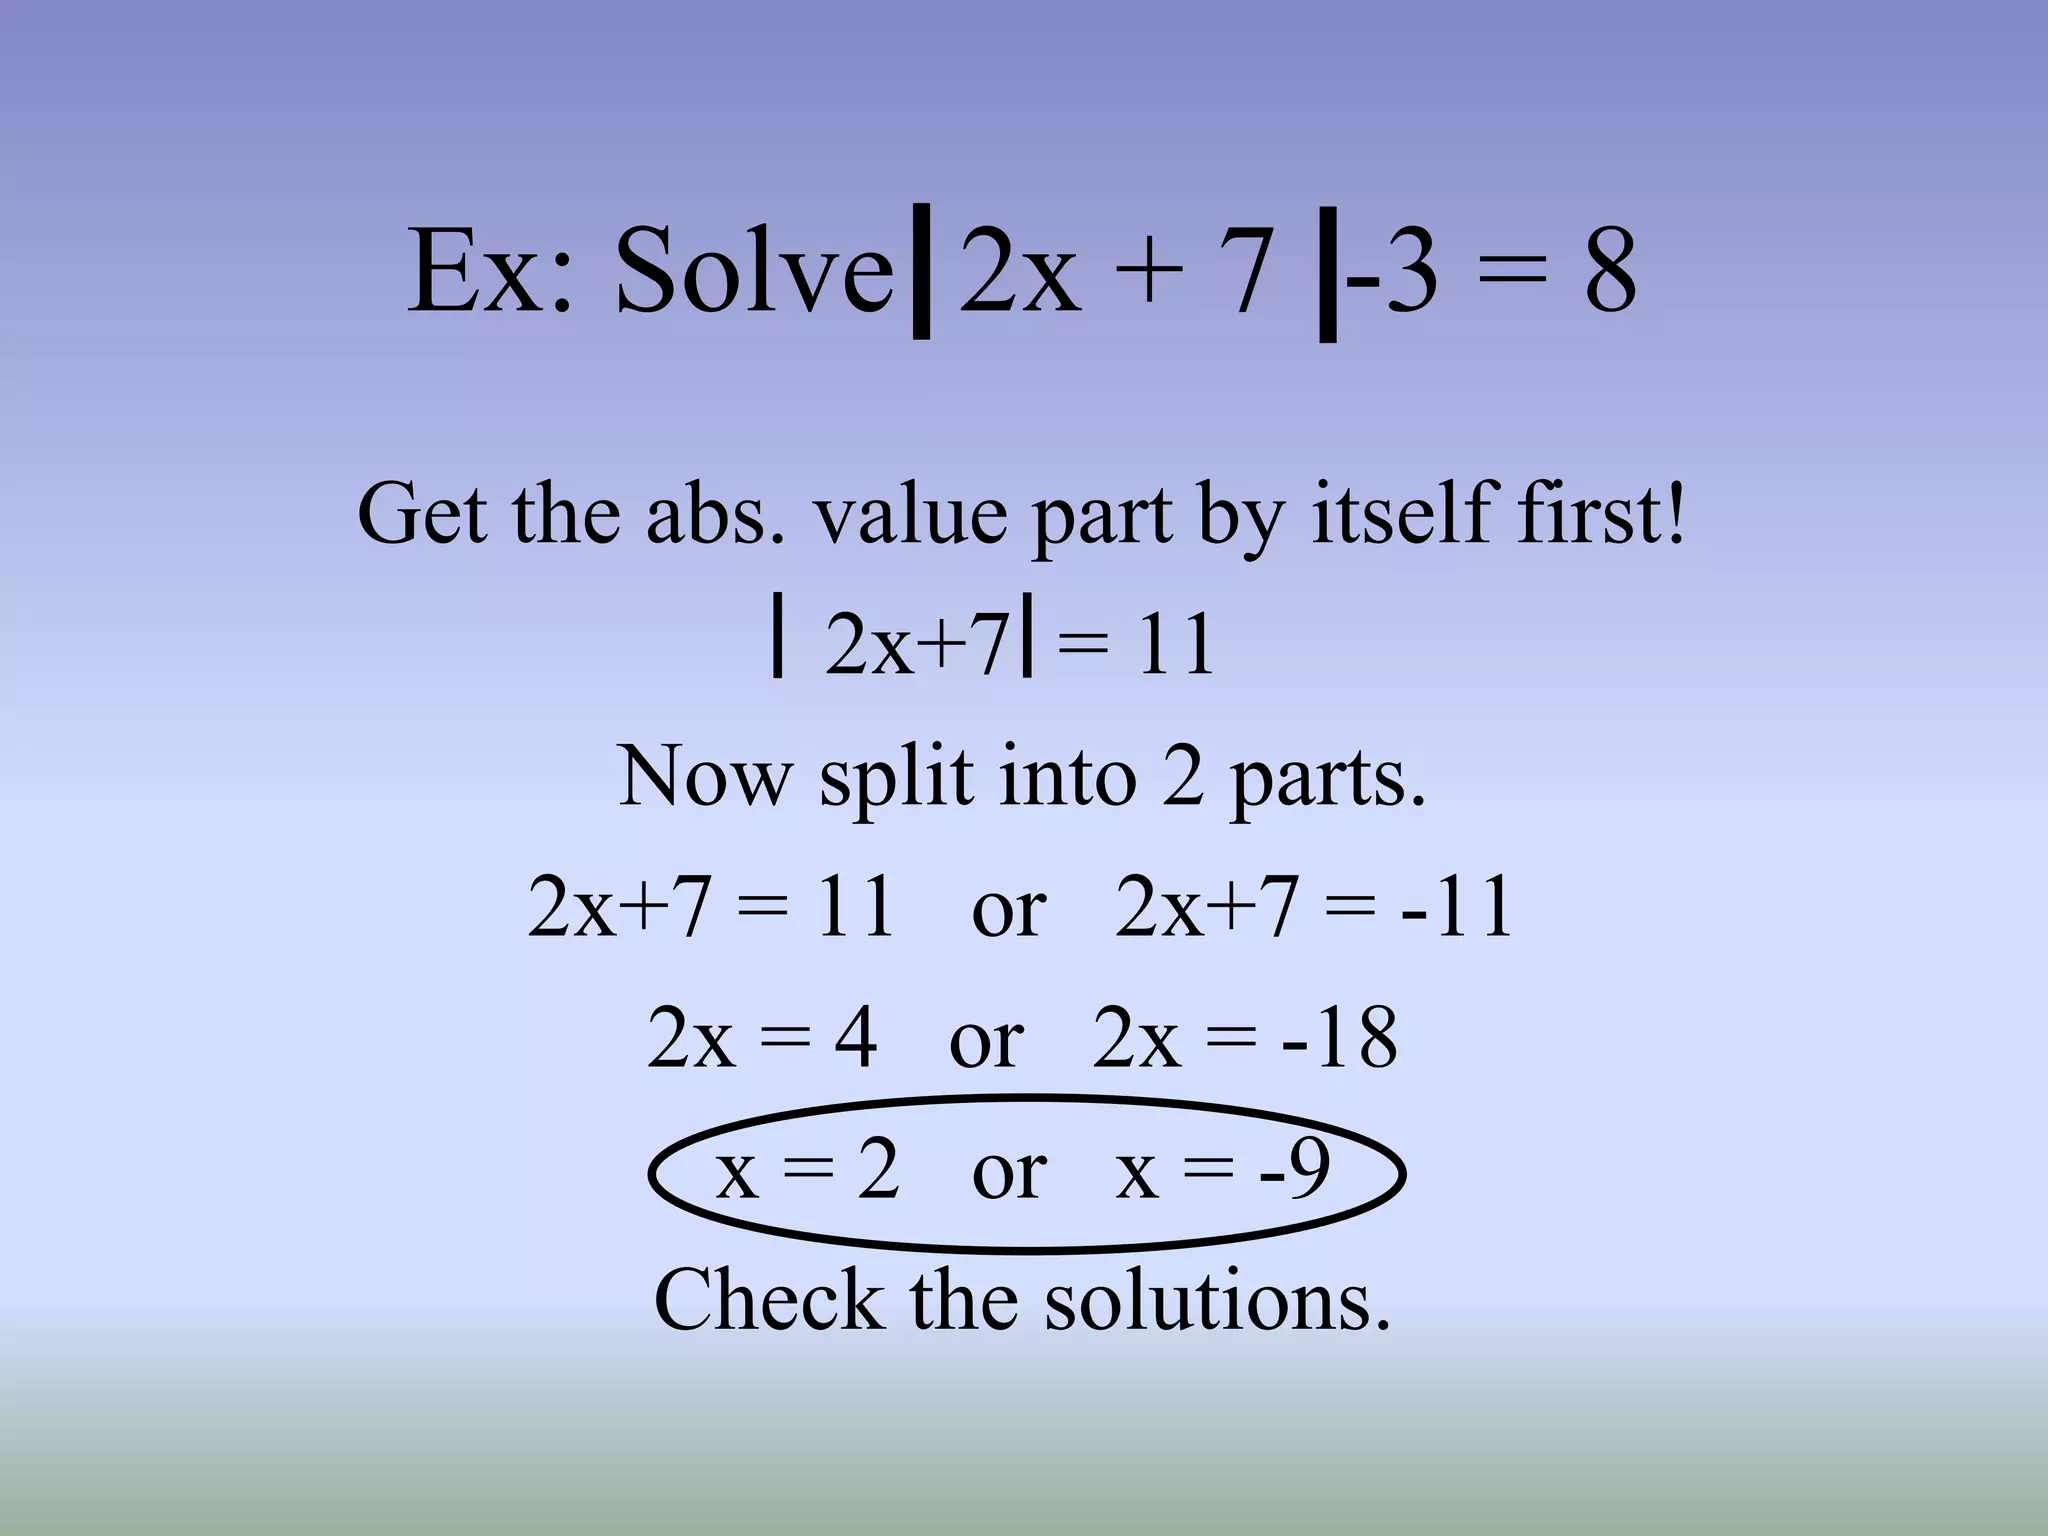
Ex: Solve 2x+ 7 -3 = 8
Get the abs. value part by itself first!
2x+7 = 11
Now split into 2 parts.
2x+7 = 11 or 2x+7 = -11
2x = 4 or 2x = -18
x = 2 or x = -9
Check the solutions.
32.
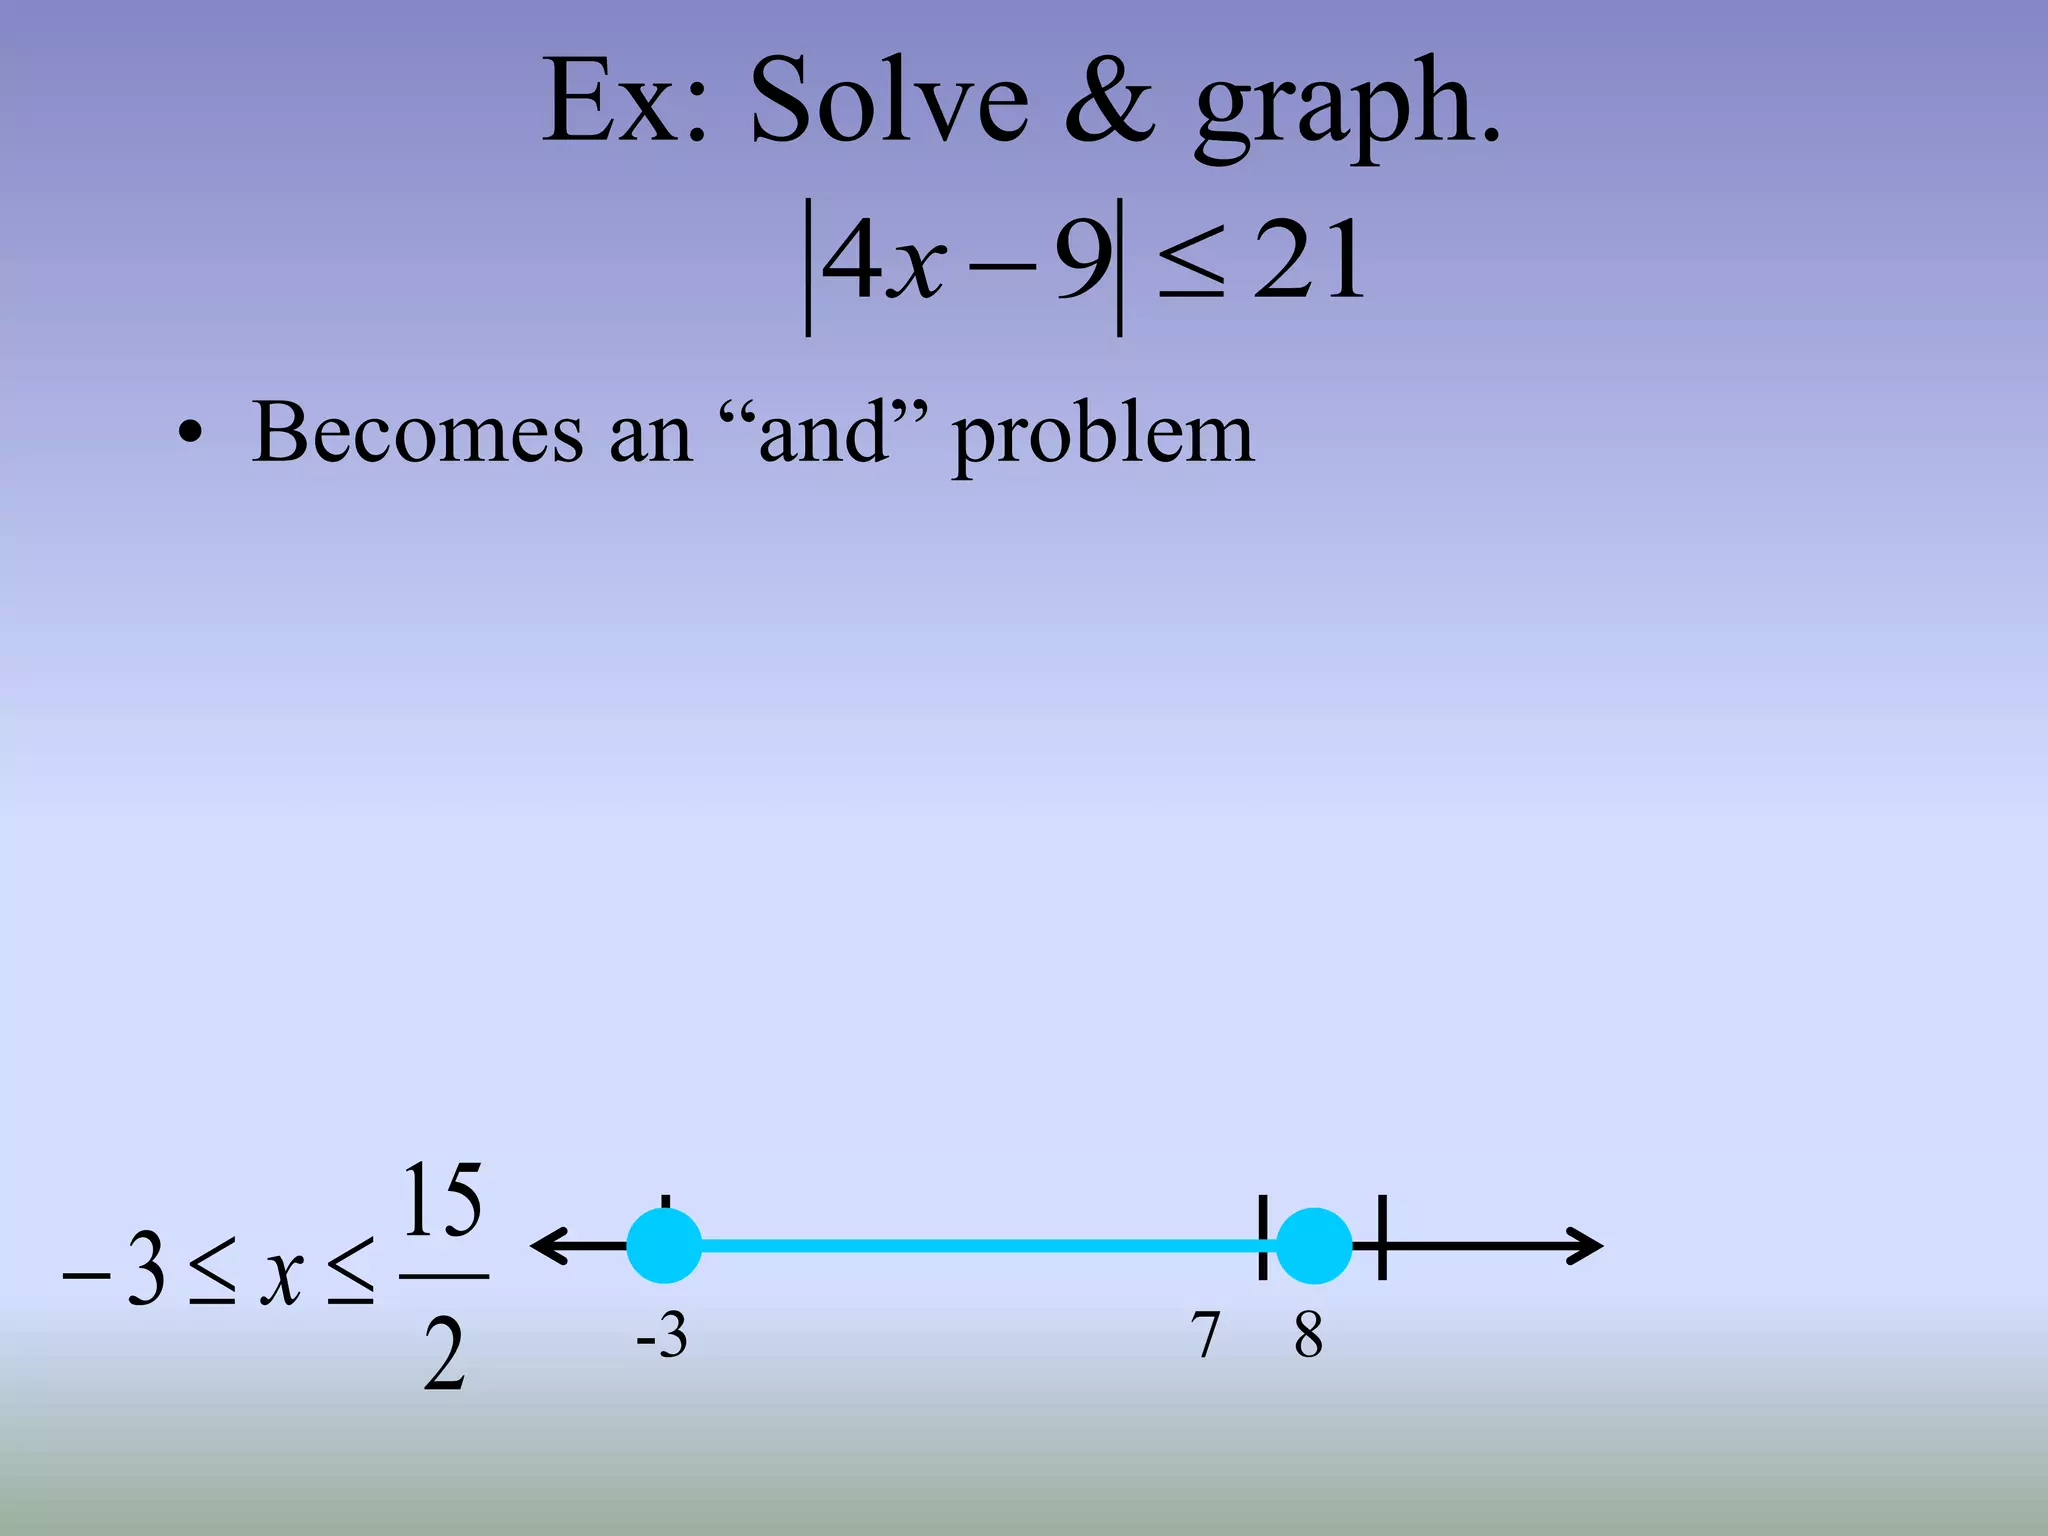
Ex: Solve &graph.
• Becomes an “and” problem
21
9
4
x
2
15
3
x -3 7 8
33.
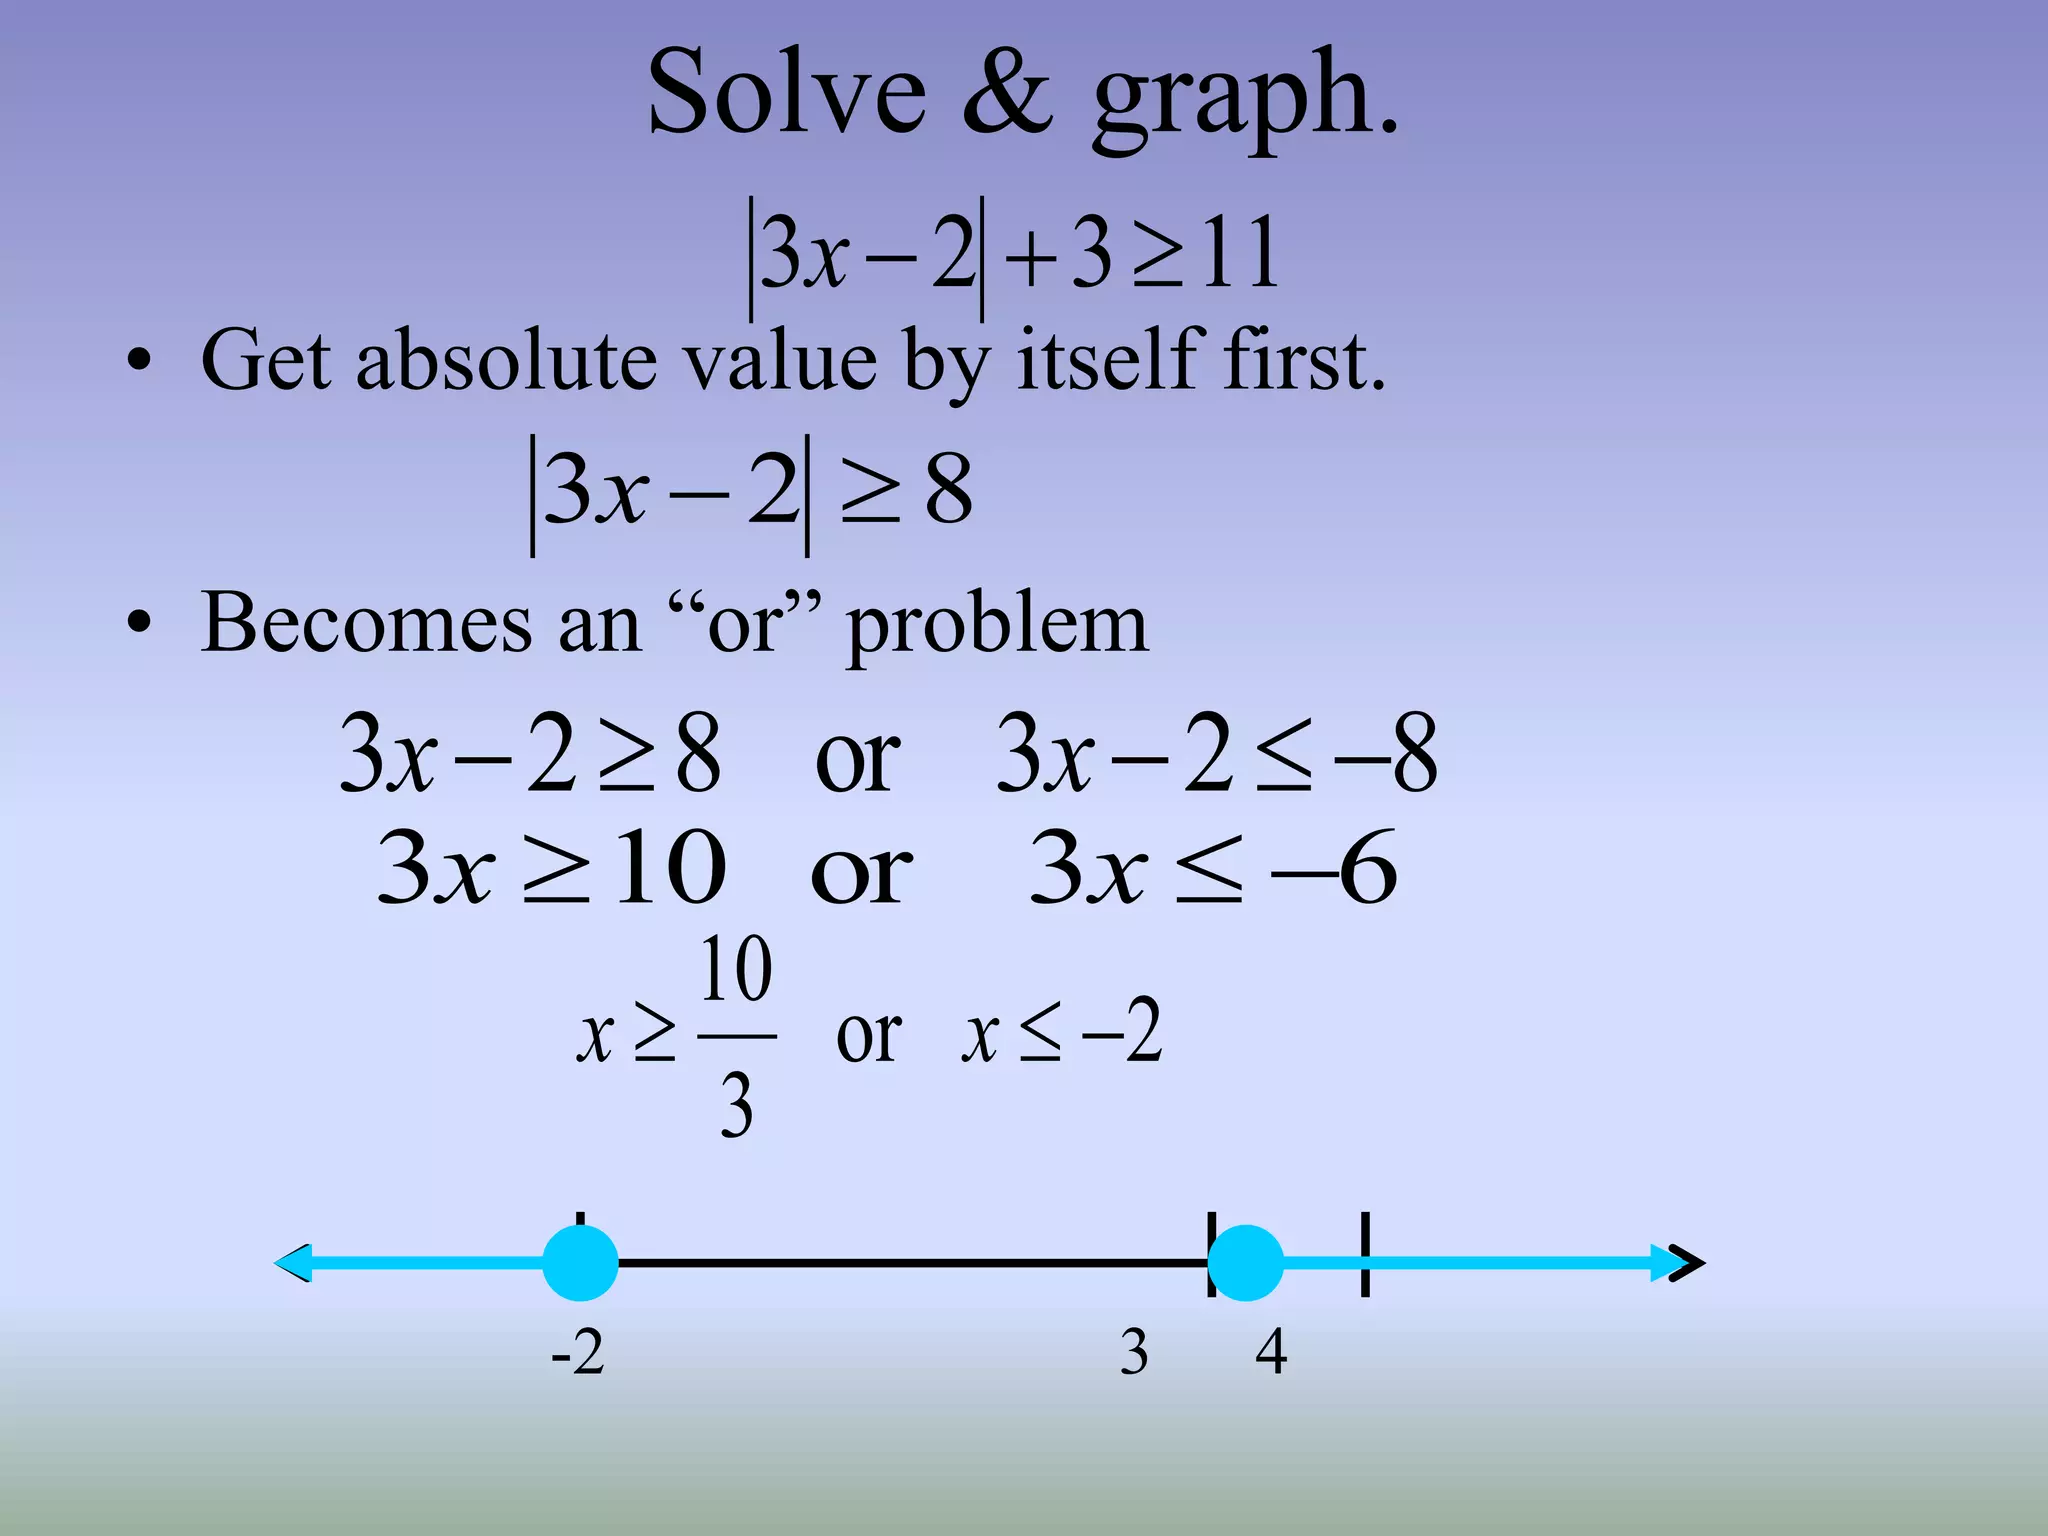
Solve & graph.
•Get absolute value by itself first.
• Becomes an “or” problem
11
3
2
3
x
8
2
3
x
8
2
3
or
8
2
3
x
x
6
3
or
10
3
x
x
2
or
3
10
x
x
-2 3 4
34.
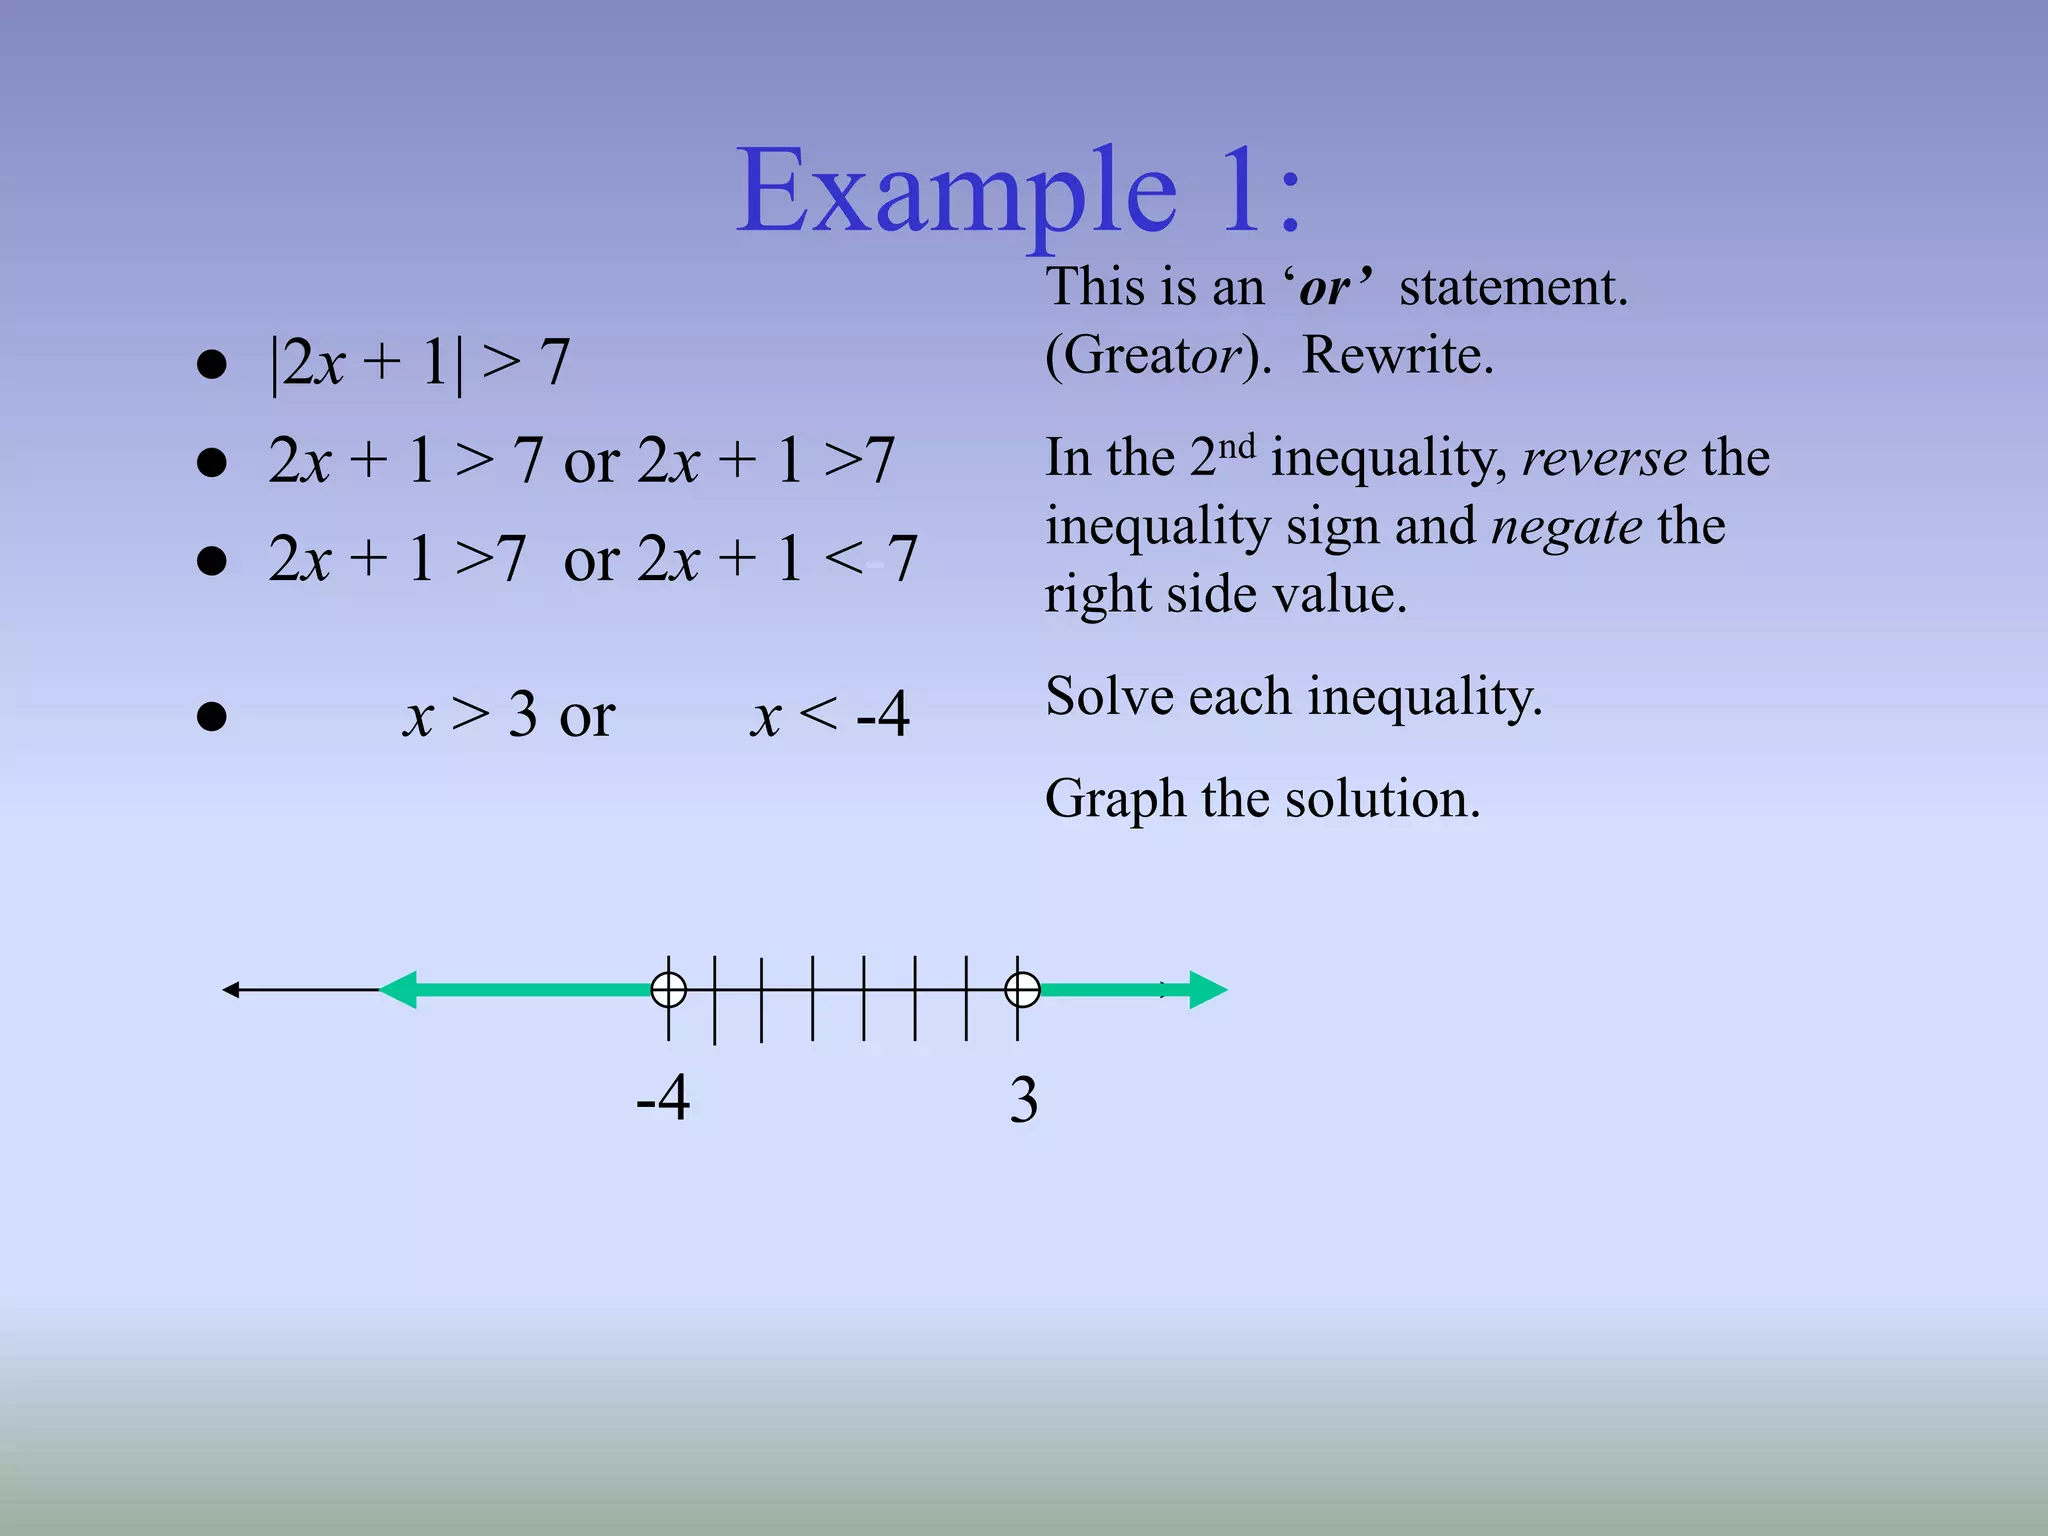
Example 1:
● |2x+ 1| > 7
● 2x + 1 > 7 or 2x + 1 >7
● 2x + 1 >7 or 2x + 1 <-7
● x > 3 or x < -4
This is an ‘or’ statement.
(Greator). Rewrite.
In the 2nd inequality, reverse the
inequality sign and negate the
right side value.
Solve each inequality.
Graph the solution.
3
-4
35.
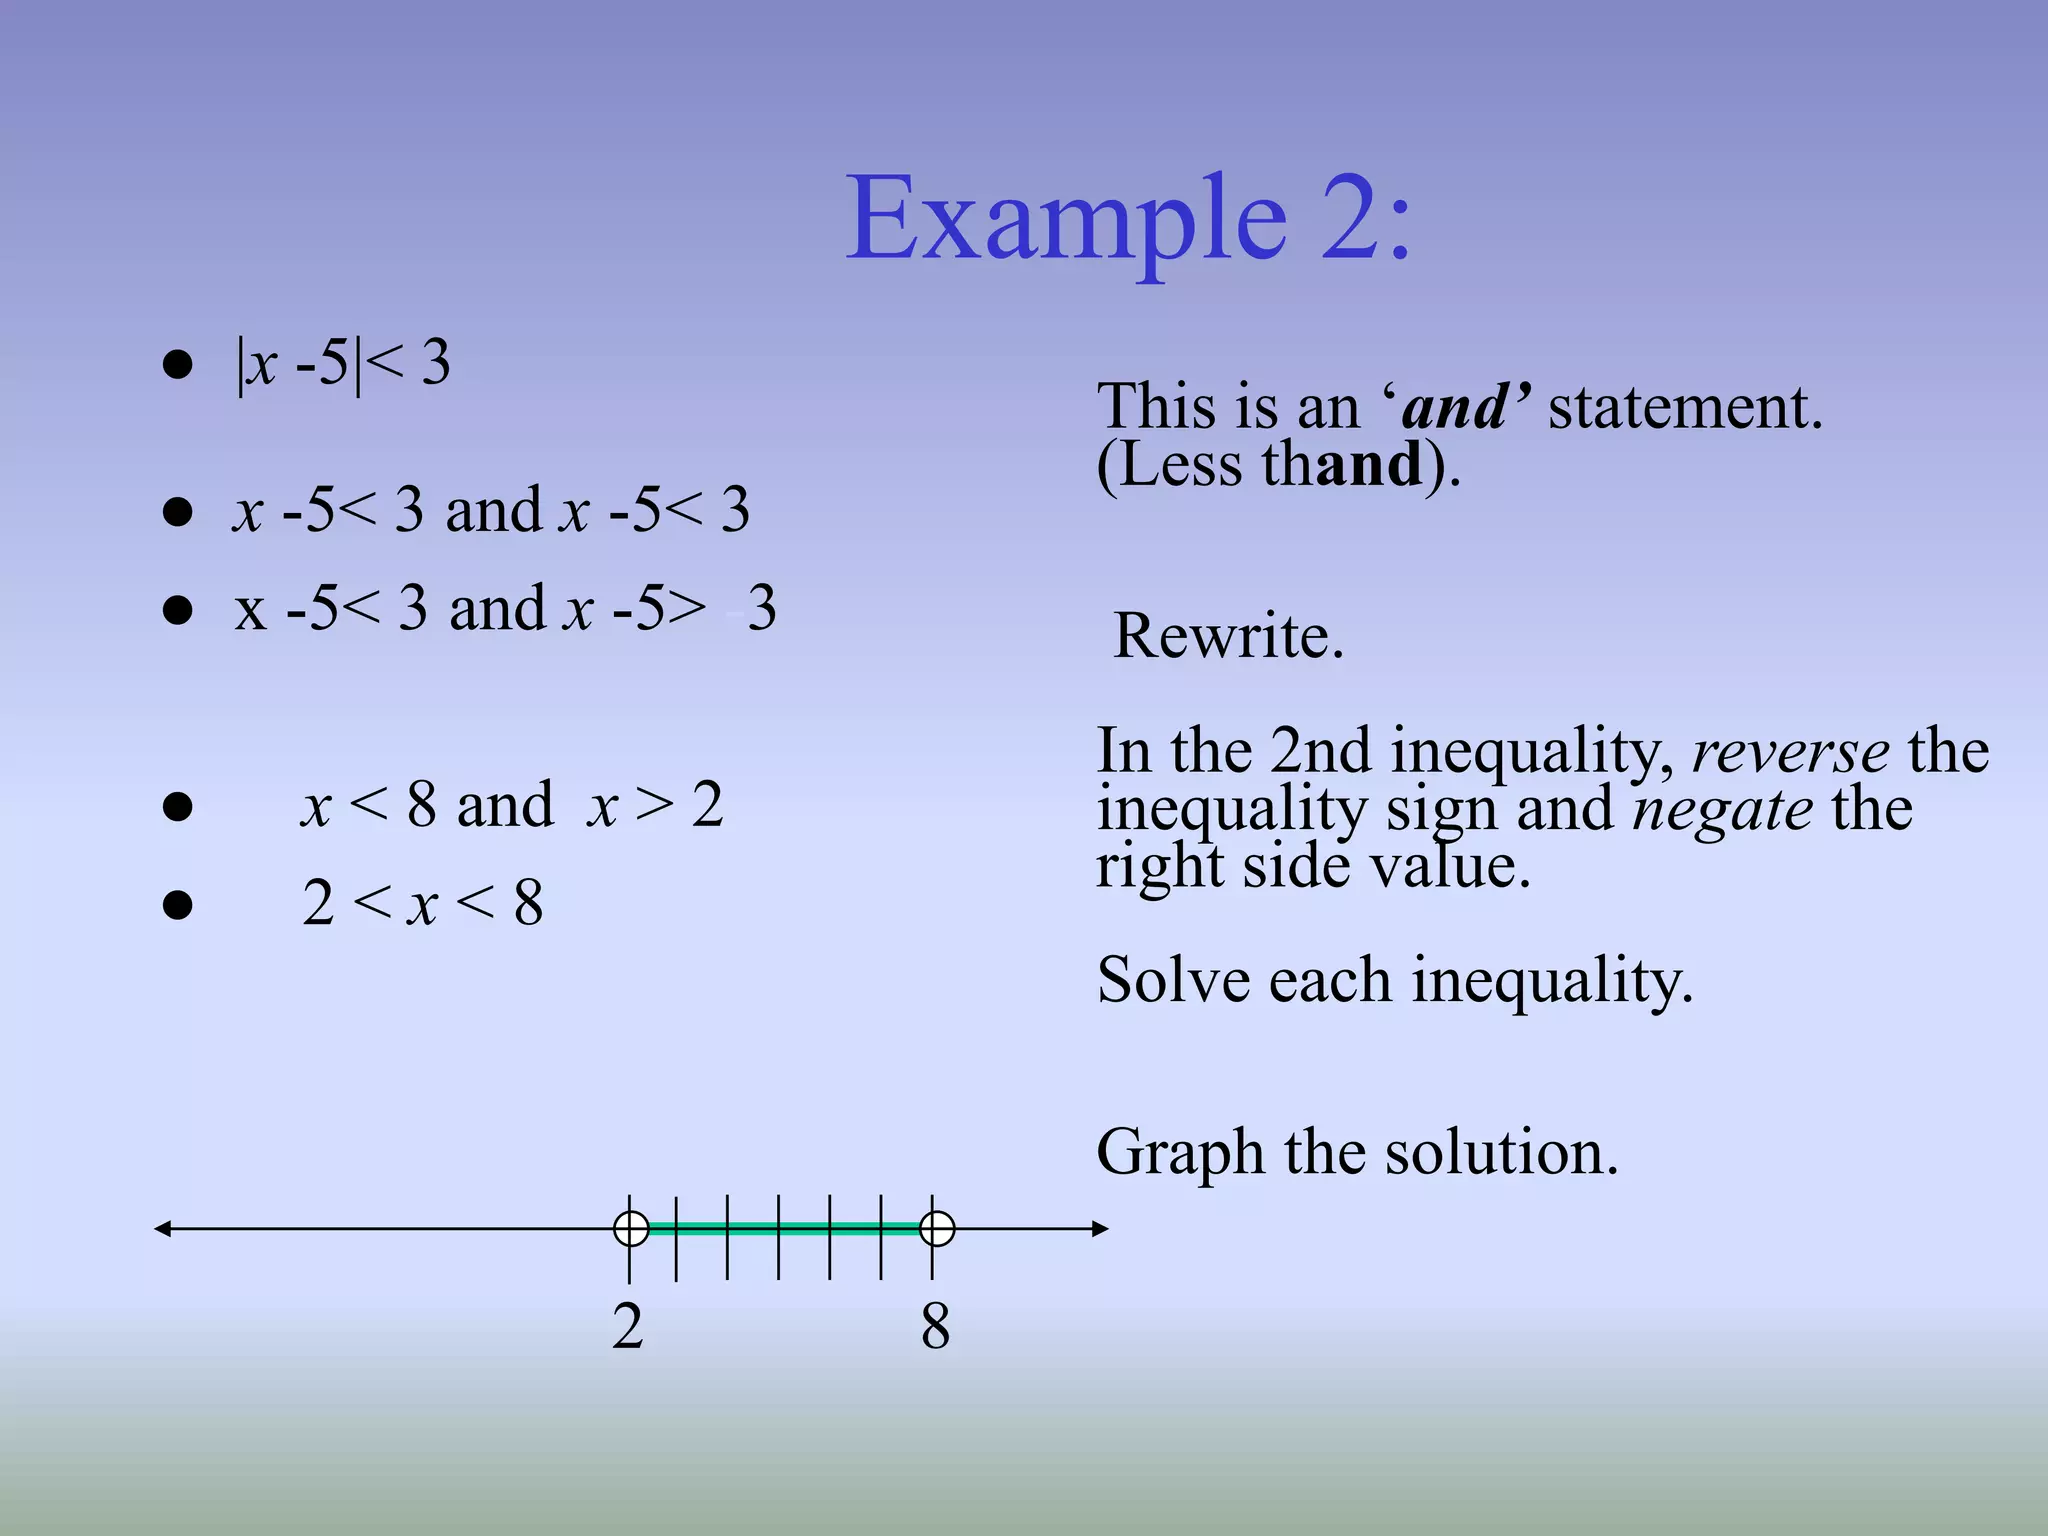
Example 2:
● |x-5|< 3
● x -5< 3 and x -5< 3
● x -5< 3 and x -5> -3
● x < 8 and x > 2
● 2 < x < 8
This is an ‘and’ statement.
(Less thand).
Rewrite.
In the 2nd inequality, reverse the
inequality sign and negate the
right side value.
Solve each inequality.
Graph the solution.
8
2
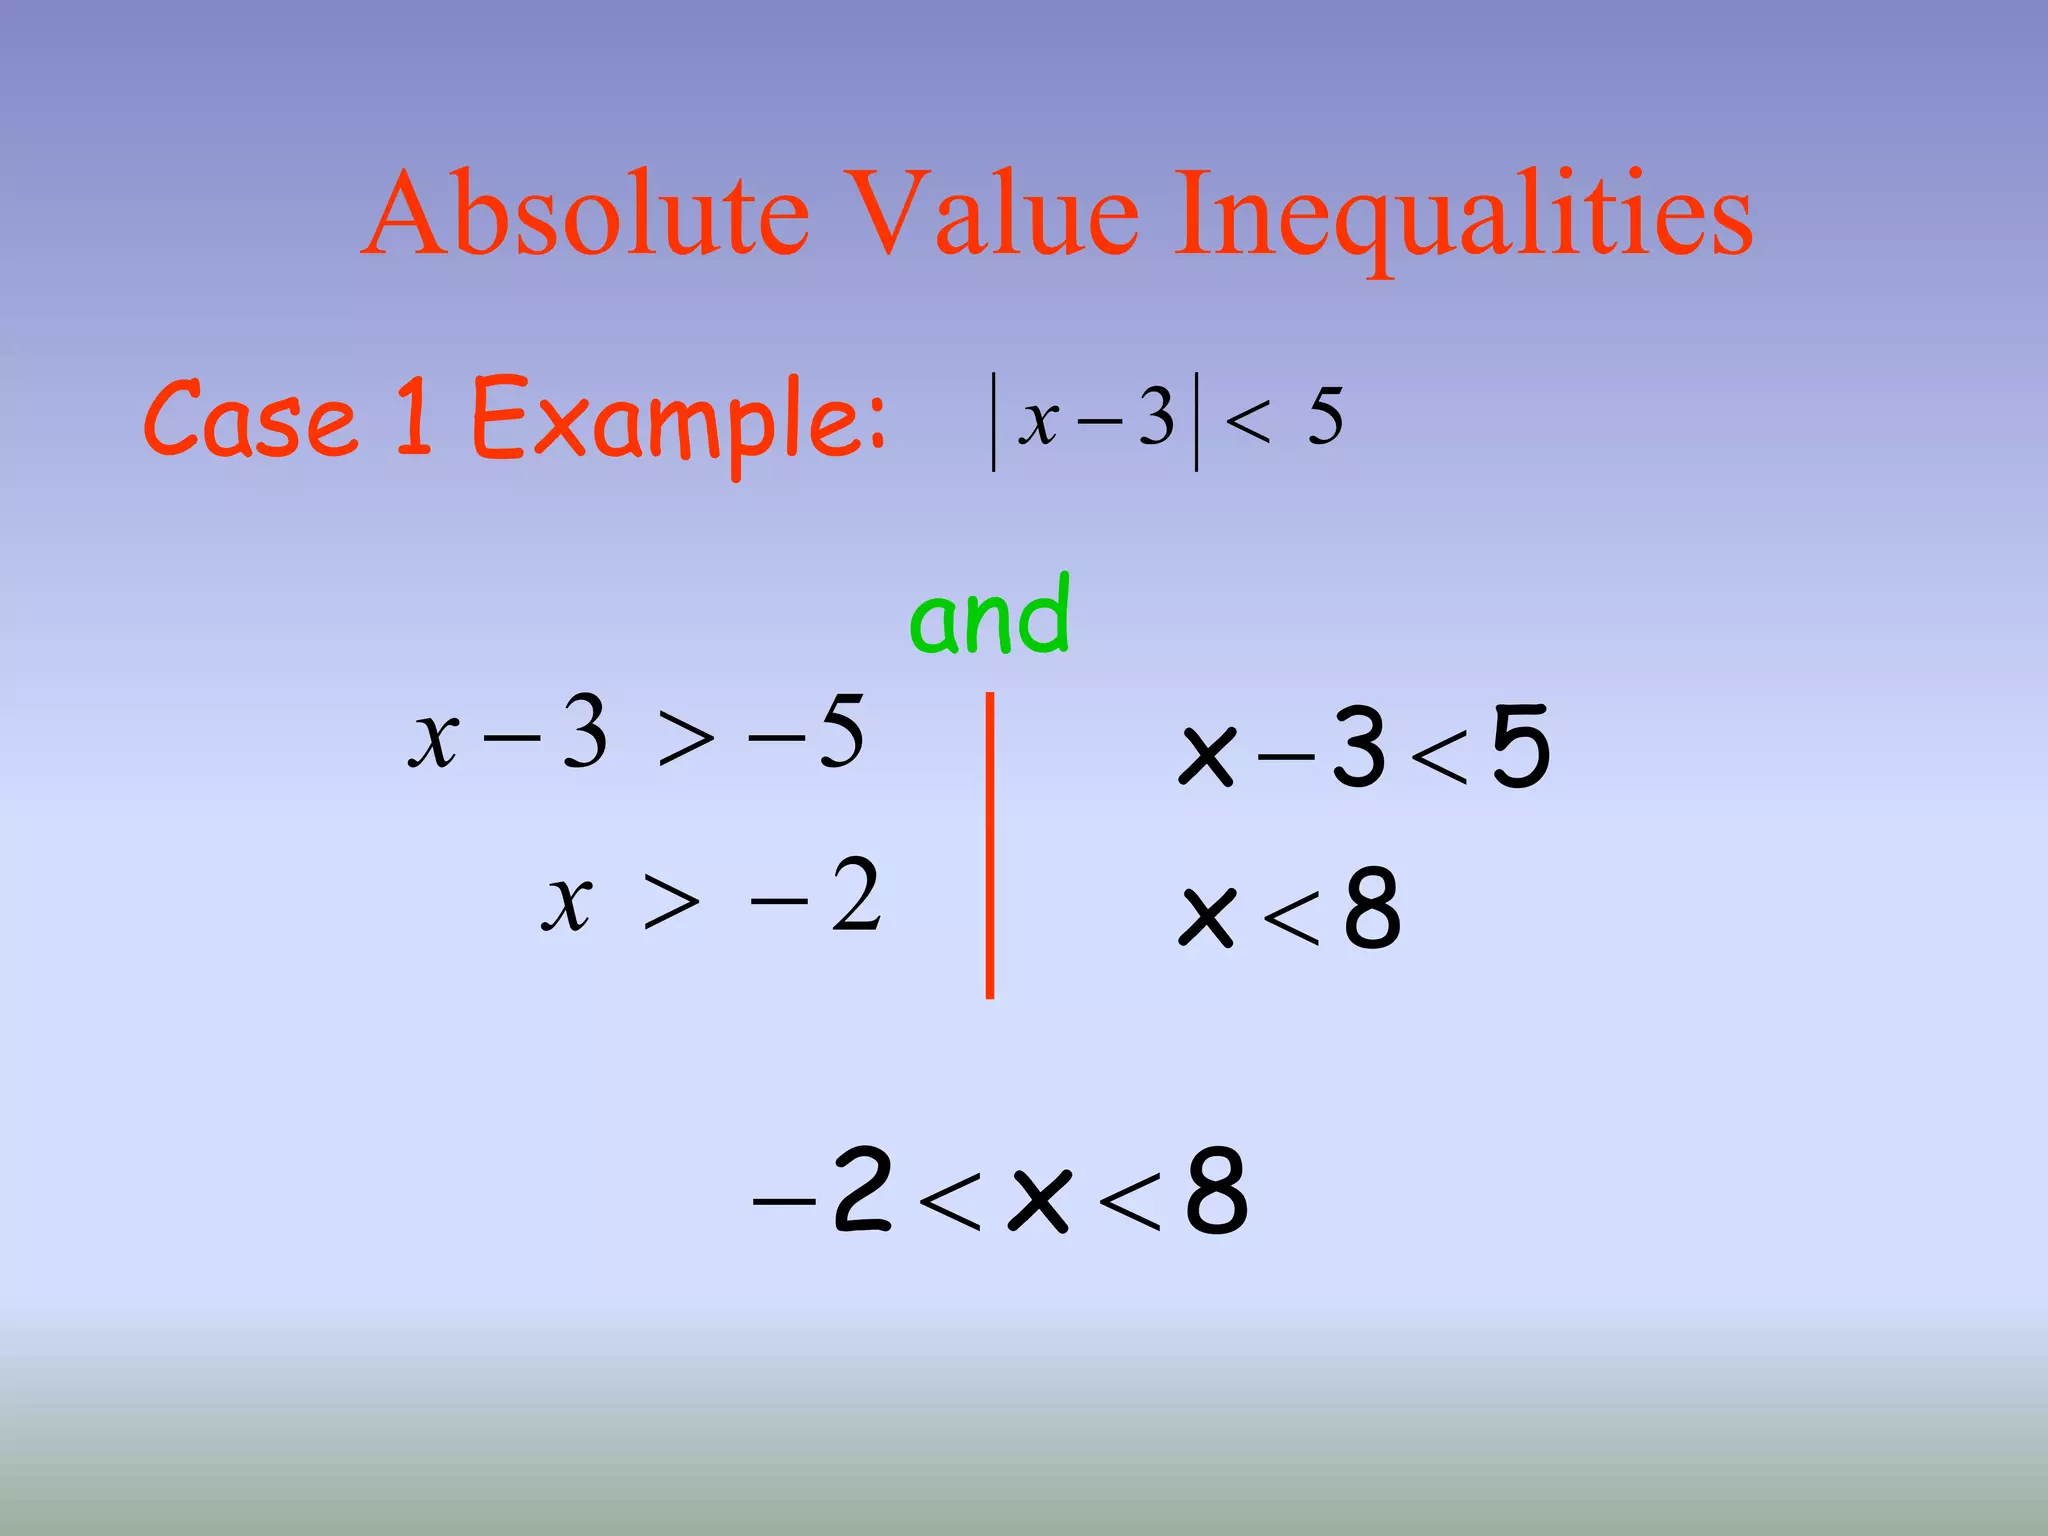
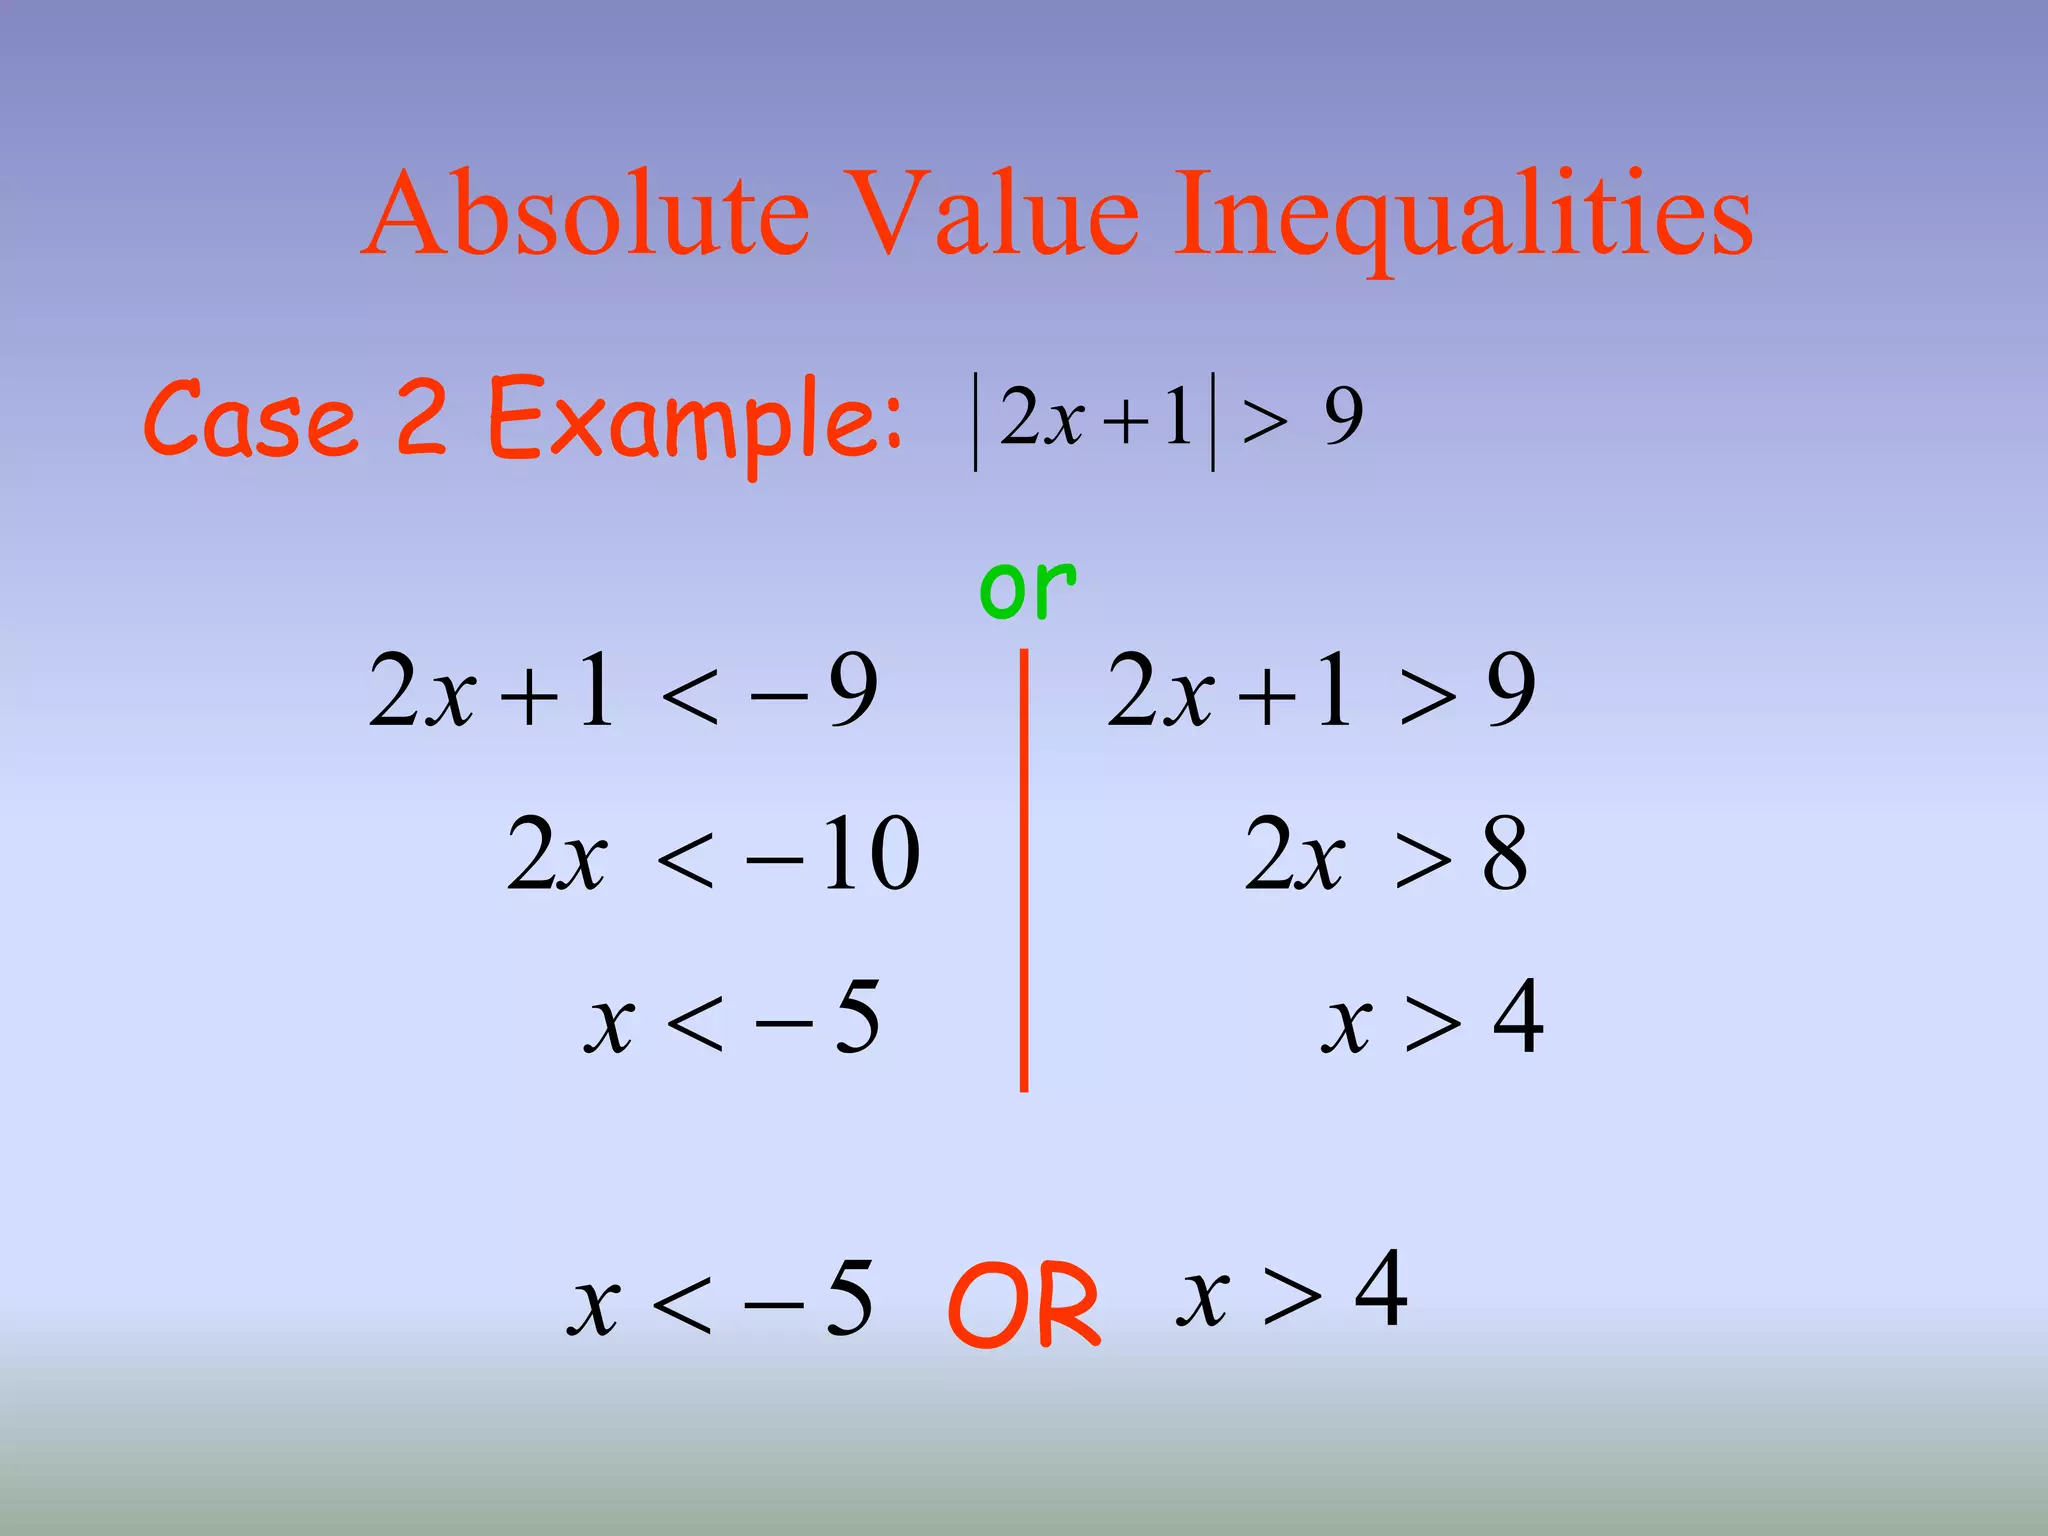
Absolute Value Inequalities
Case2 Example: 2 1 9
x
2 1 9
2 10
5
x
x
x
5
x
2 1 9
2 8
4
x
x
x
4
x
OR
or
38.
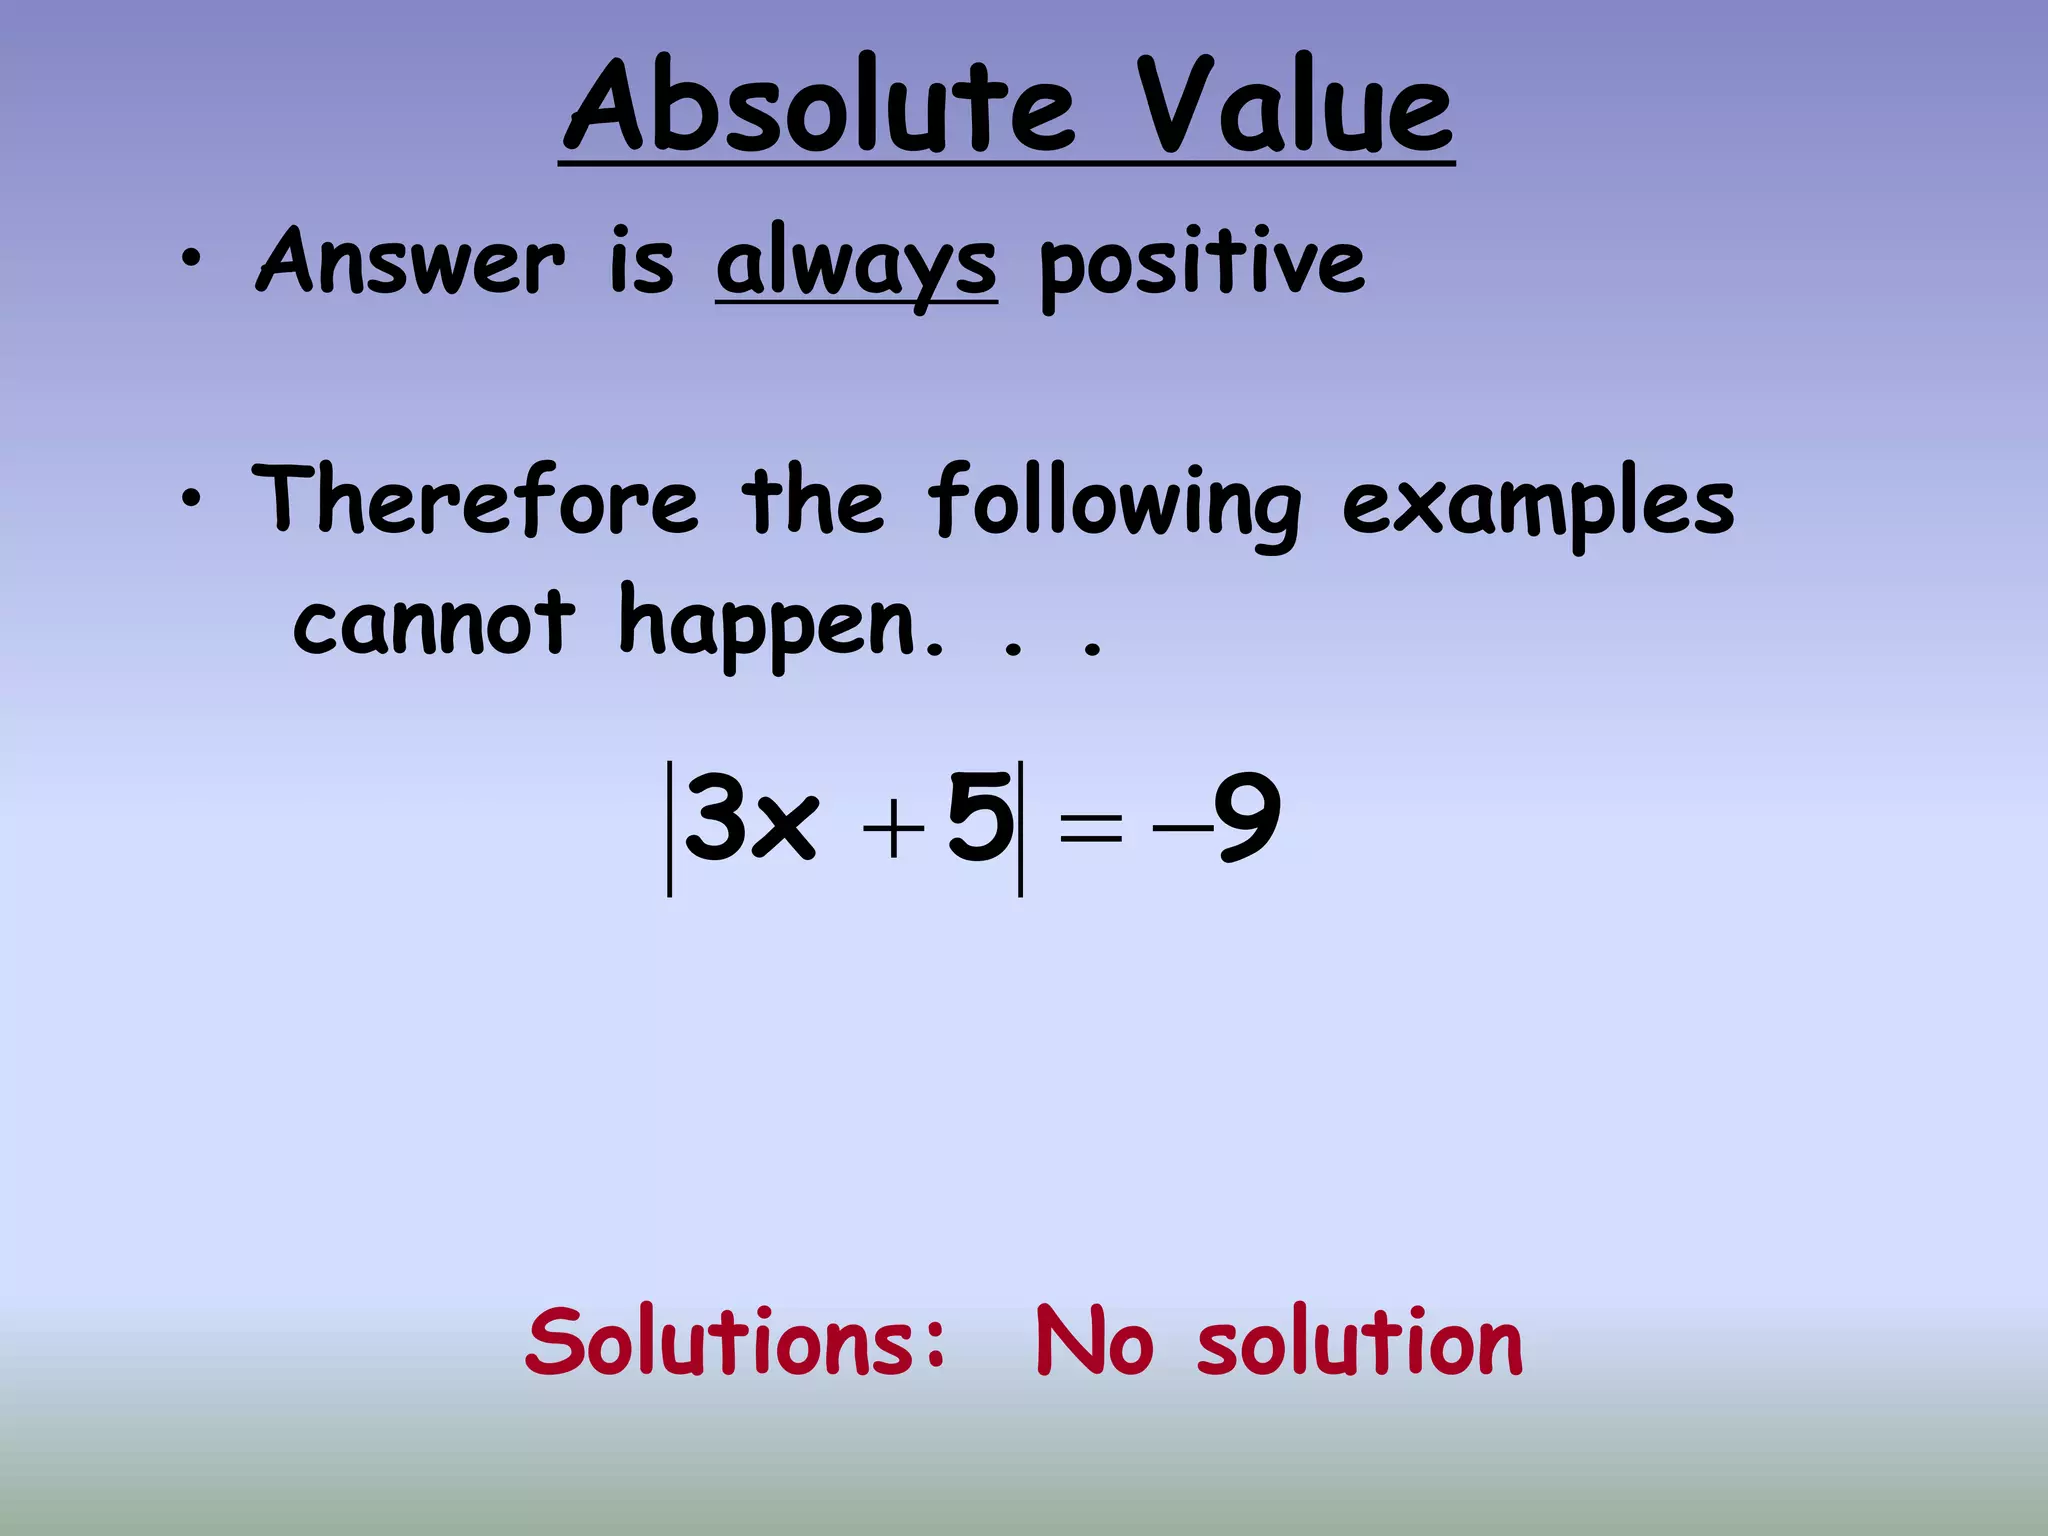
Absolute Value
• Answeris always positive
• Therefore the following examples
cannot happen. . .
Solutions: No solution
9
5
3x
39.
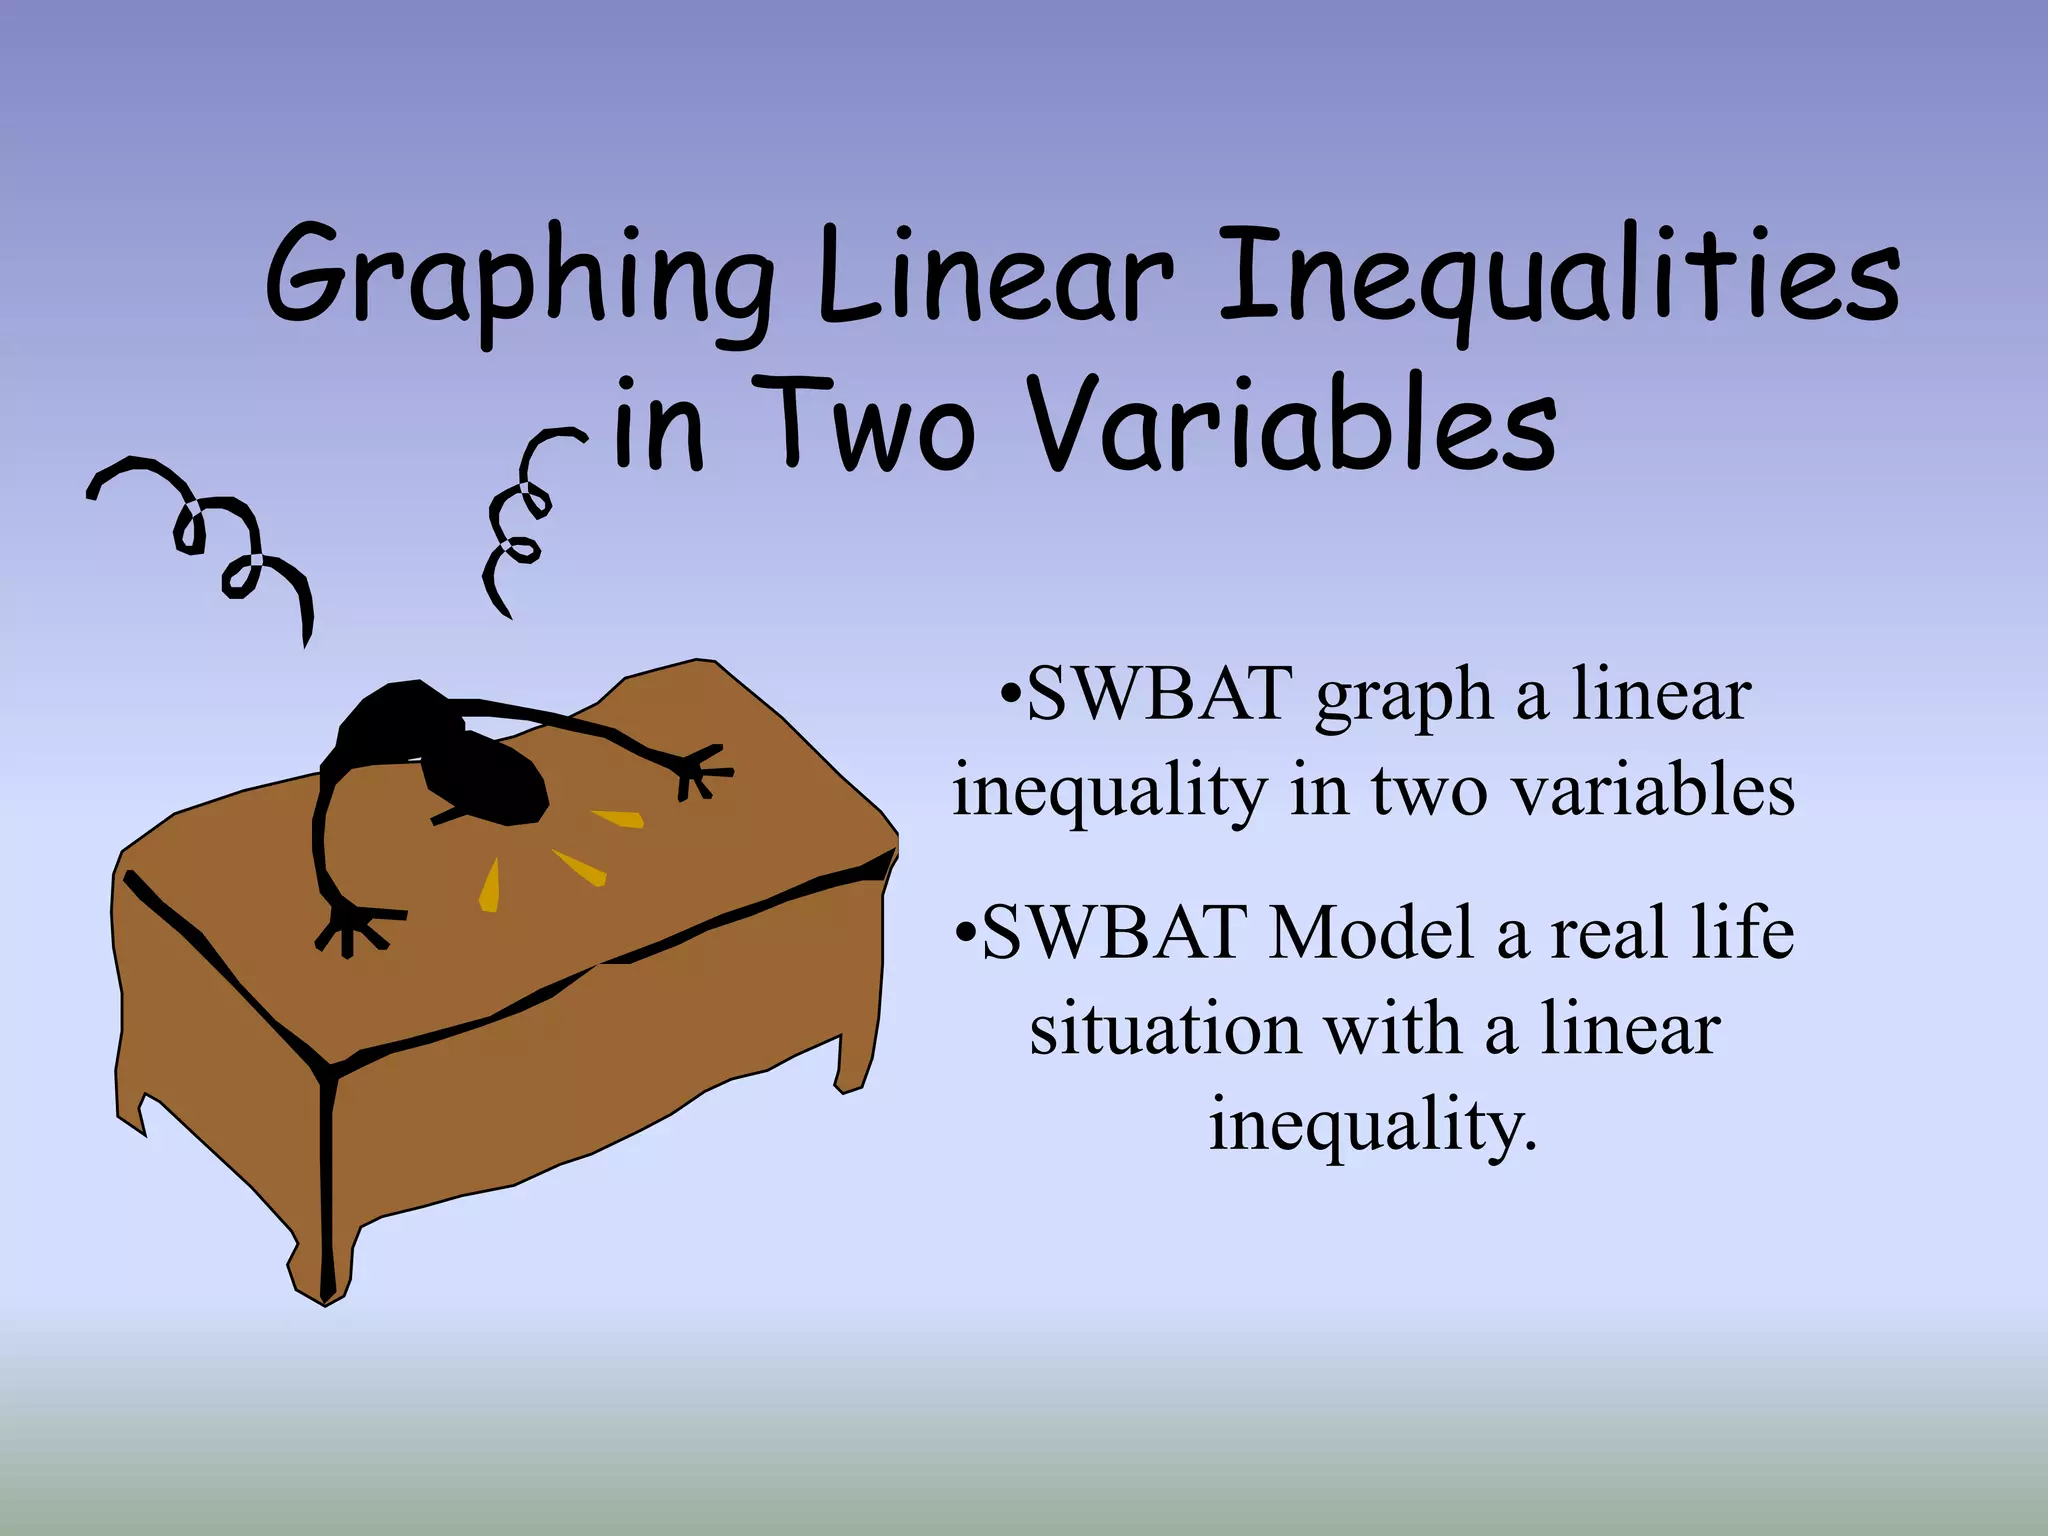
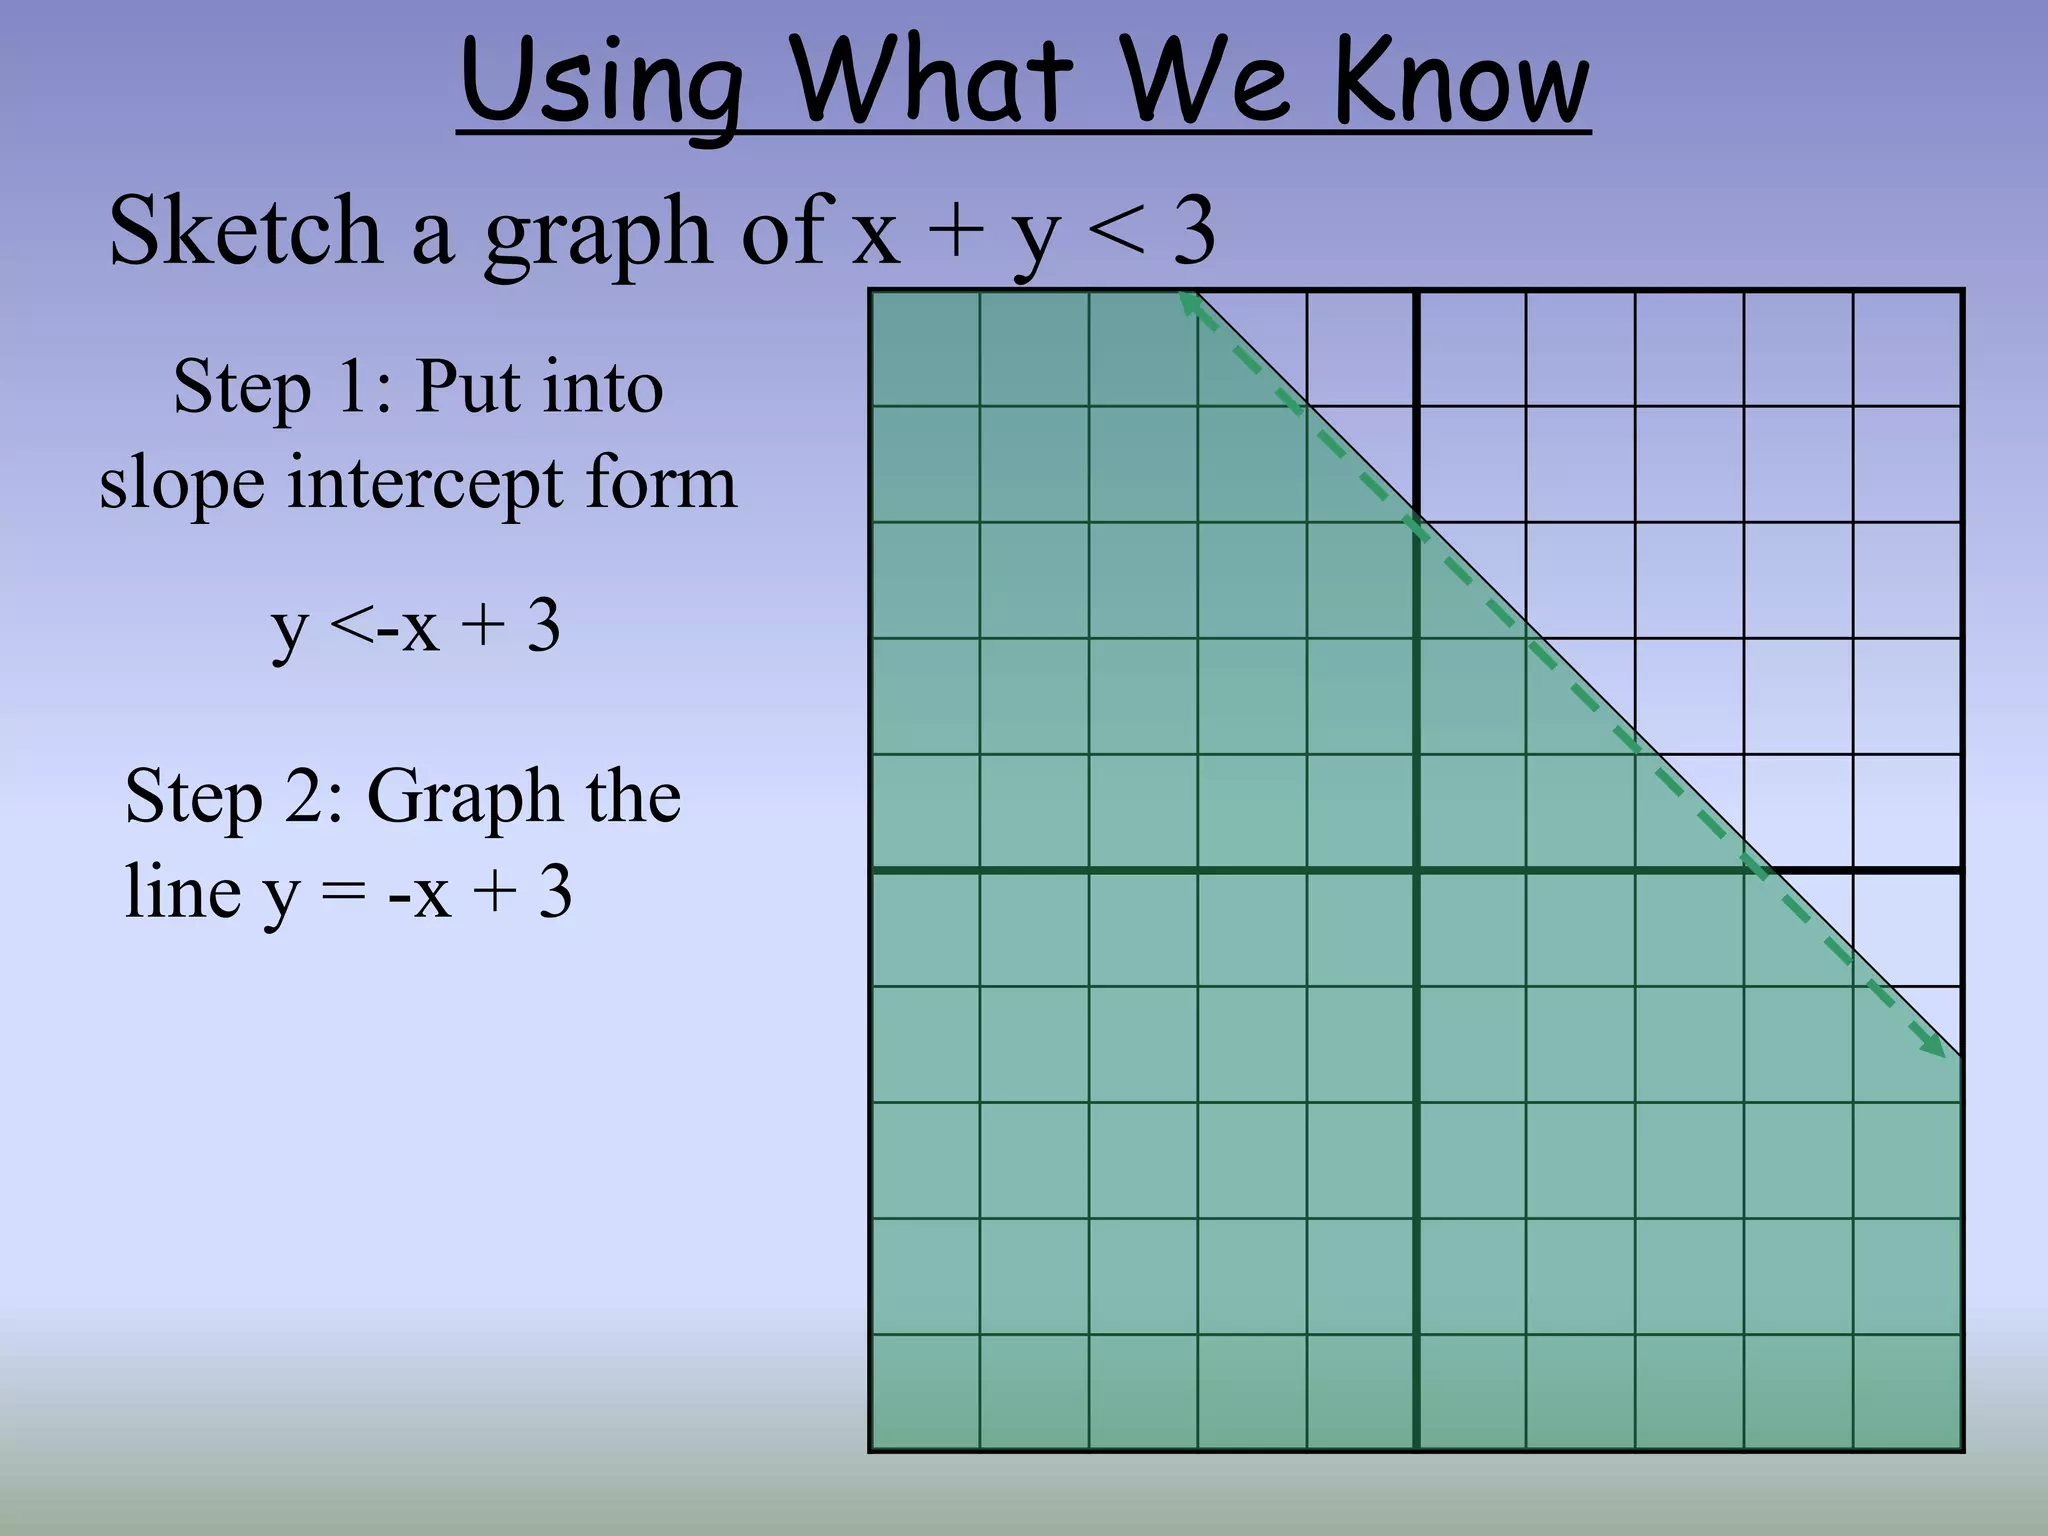
Graphing Linear Inequalities
inTwo Variables
•SWBAT graph a linear
inequality in two variables
•SWBAT Model a real life
situation with a linear
inequality.
40.
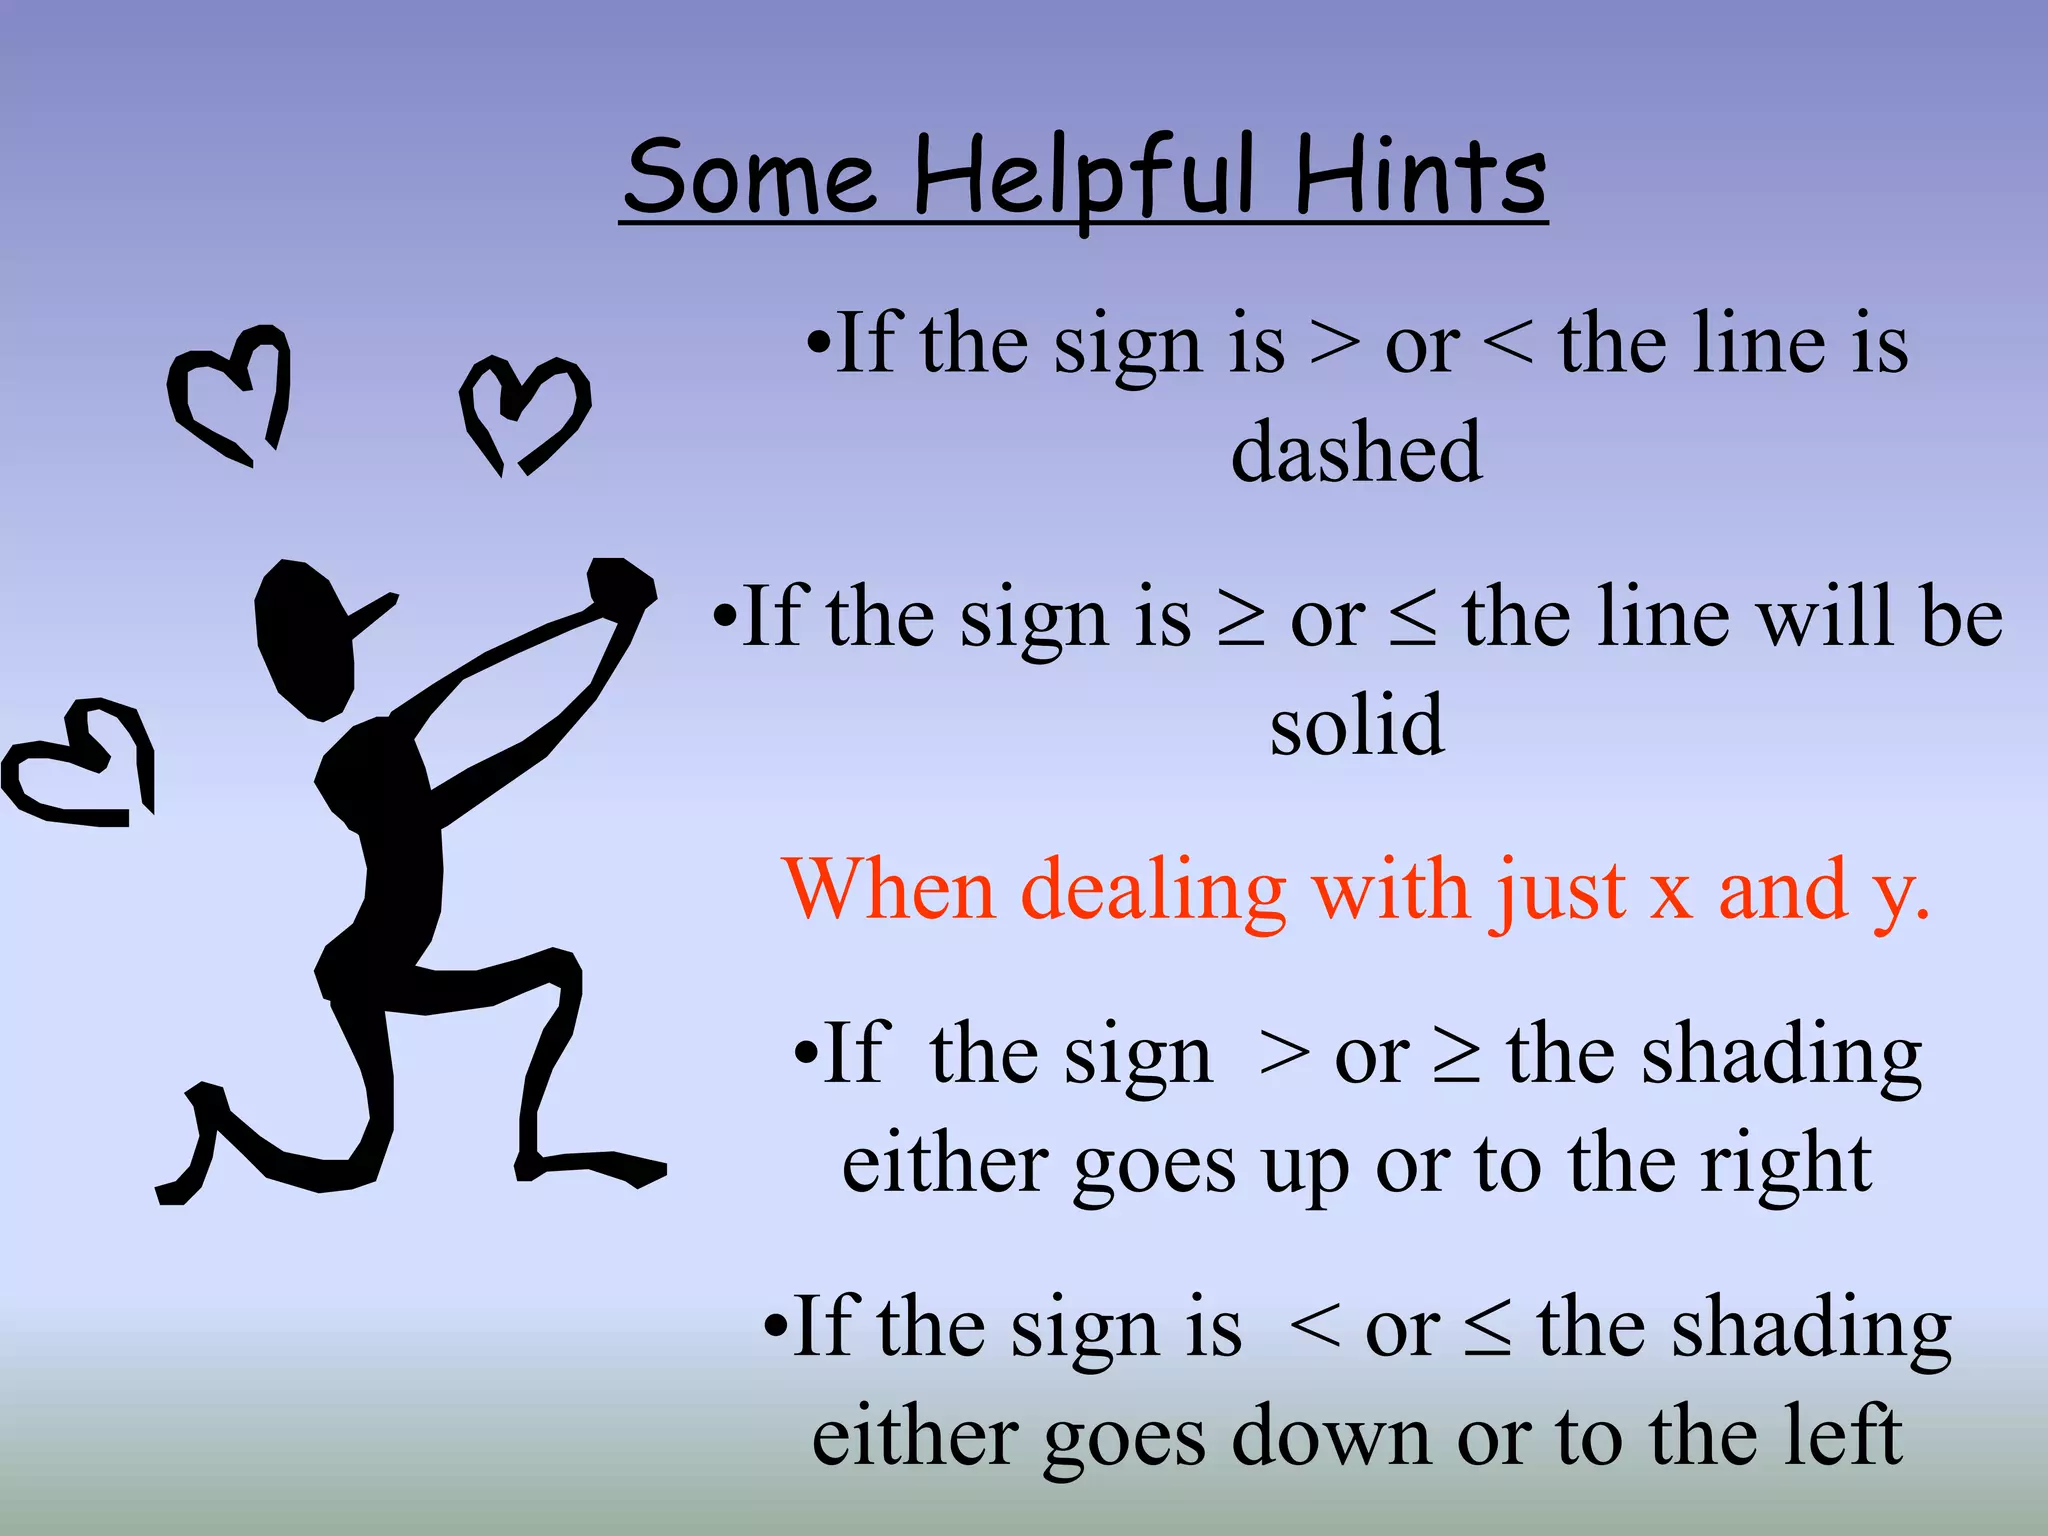
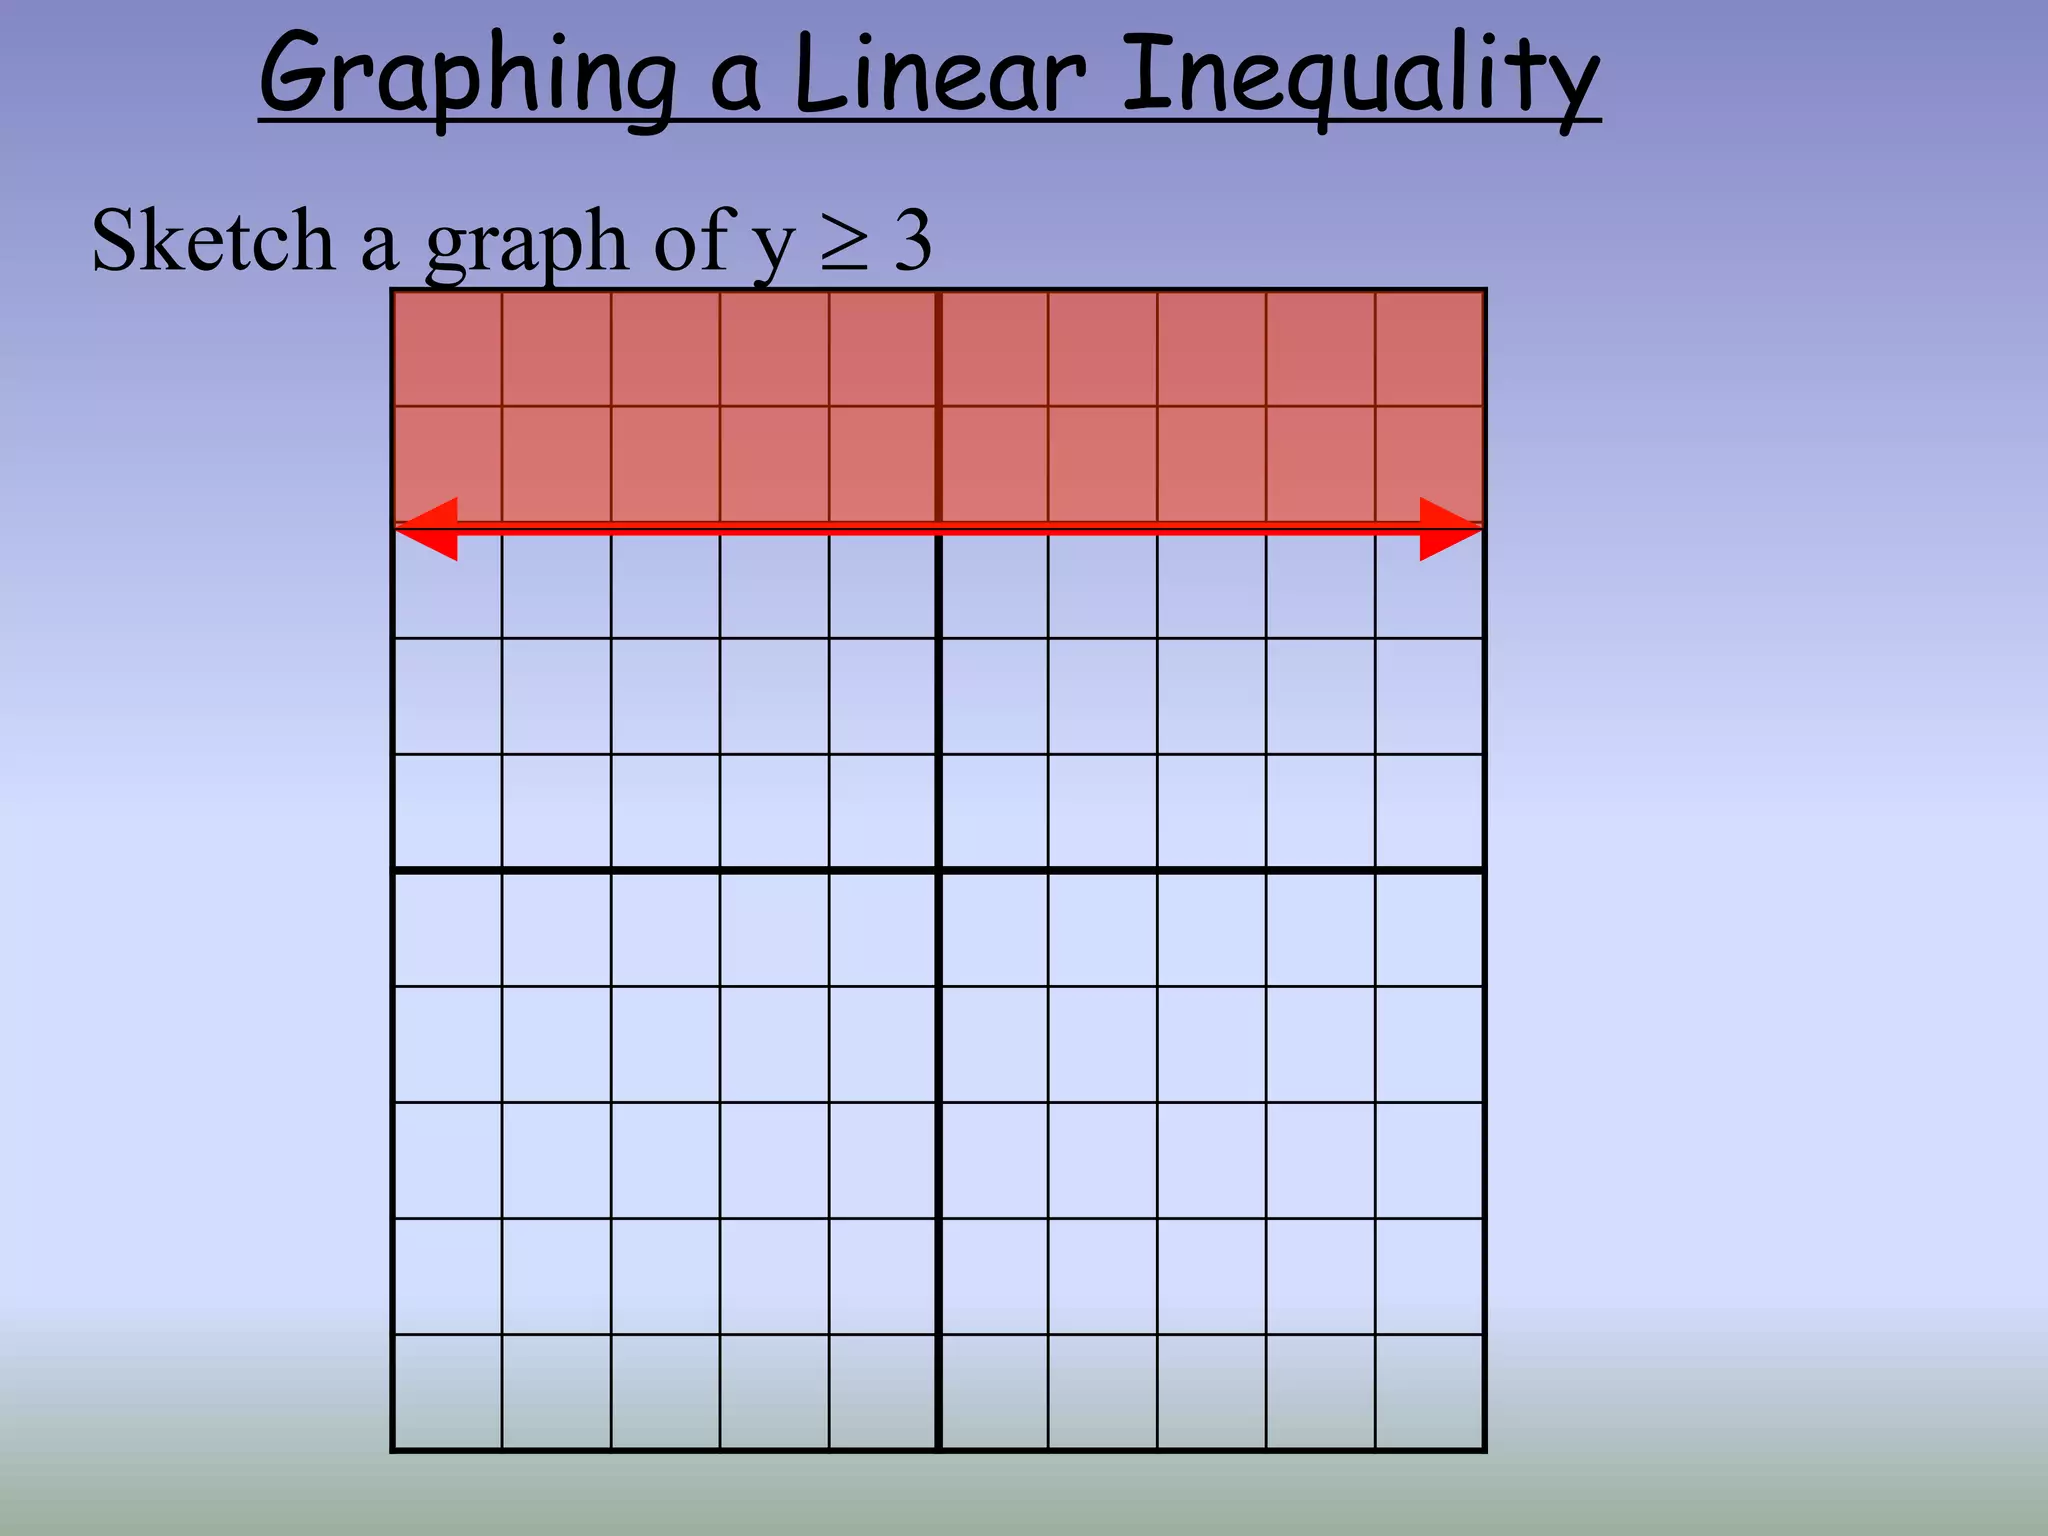
Some Helpful Hints
•Ifthe sign is > or < the line is
dashed
•If the sign is or the line will be
solid
When dealing with just x and y.
•If the sign > or the shading
either goes up or to the right
•If the sign is < or the shading
either goes down or to the left
41.
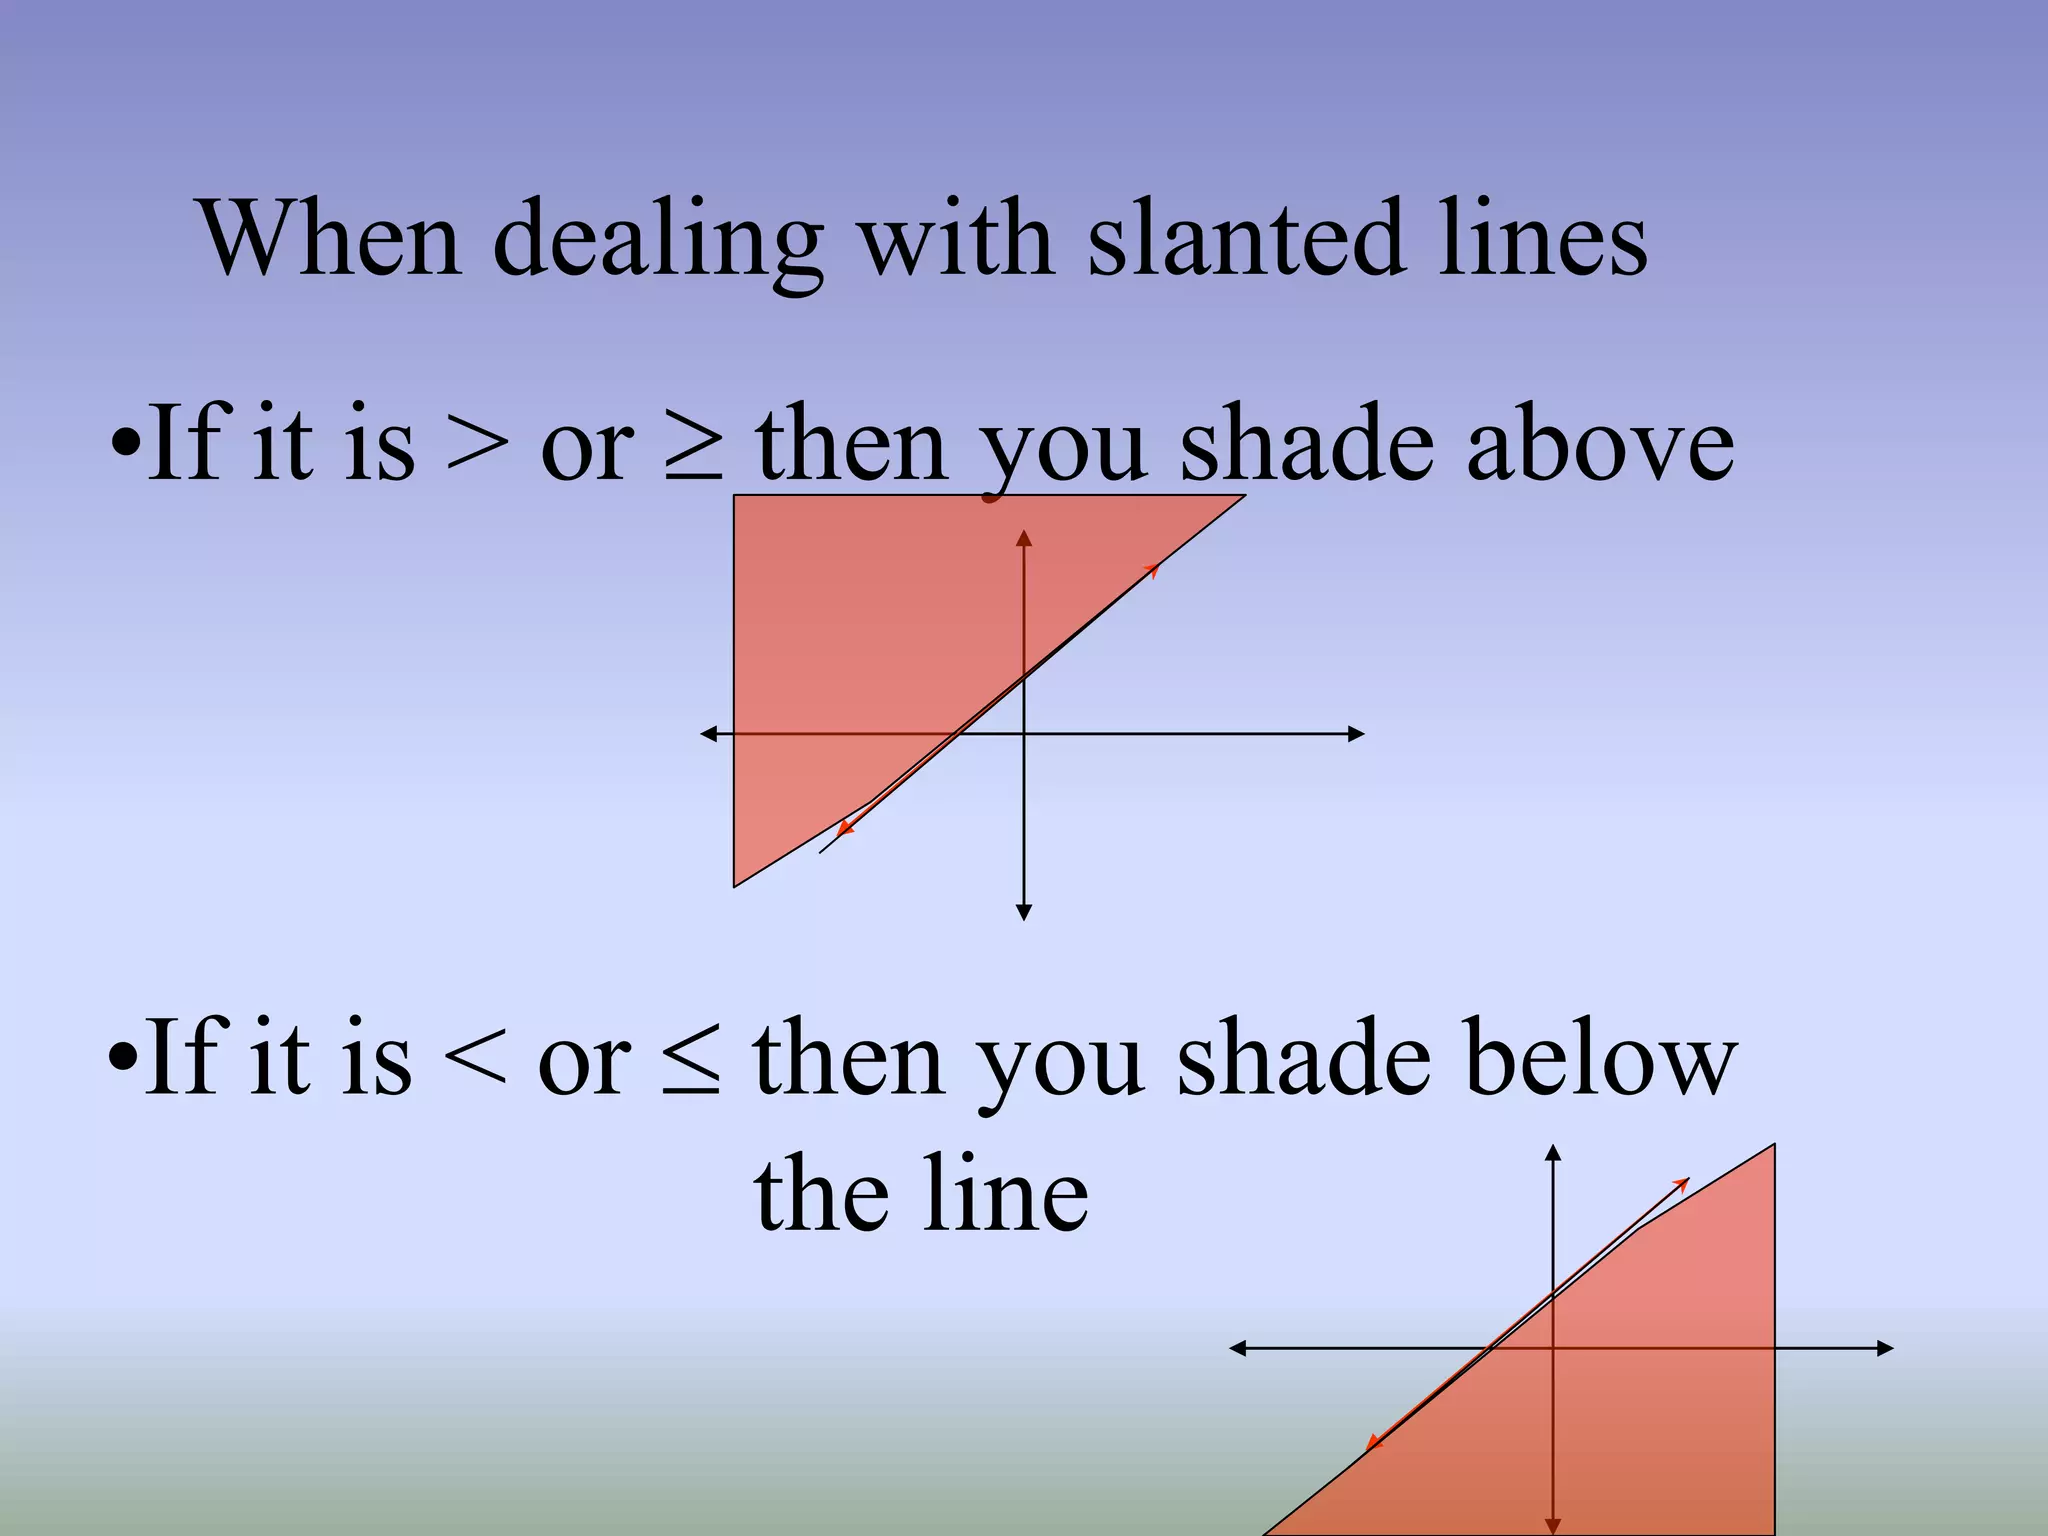
When dealing withslanted lines
•If it is > or then you shade above
•If it is < or then you shade below
the line
42.
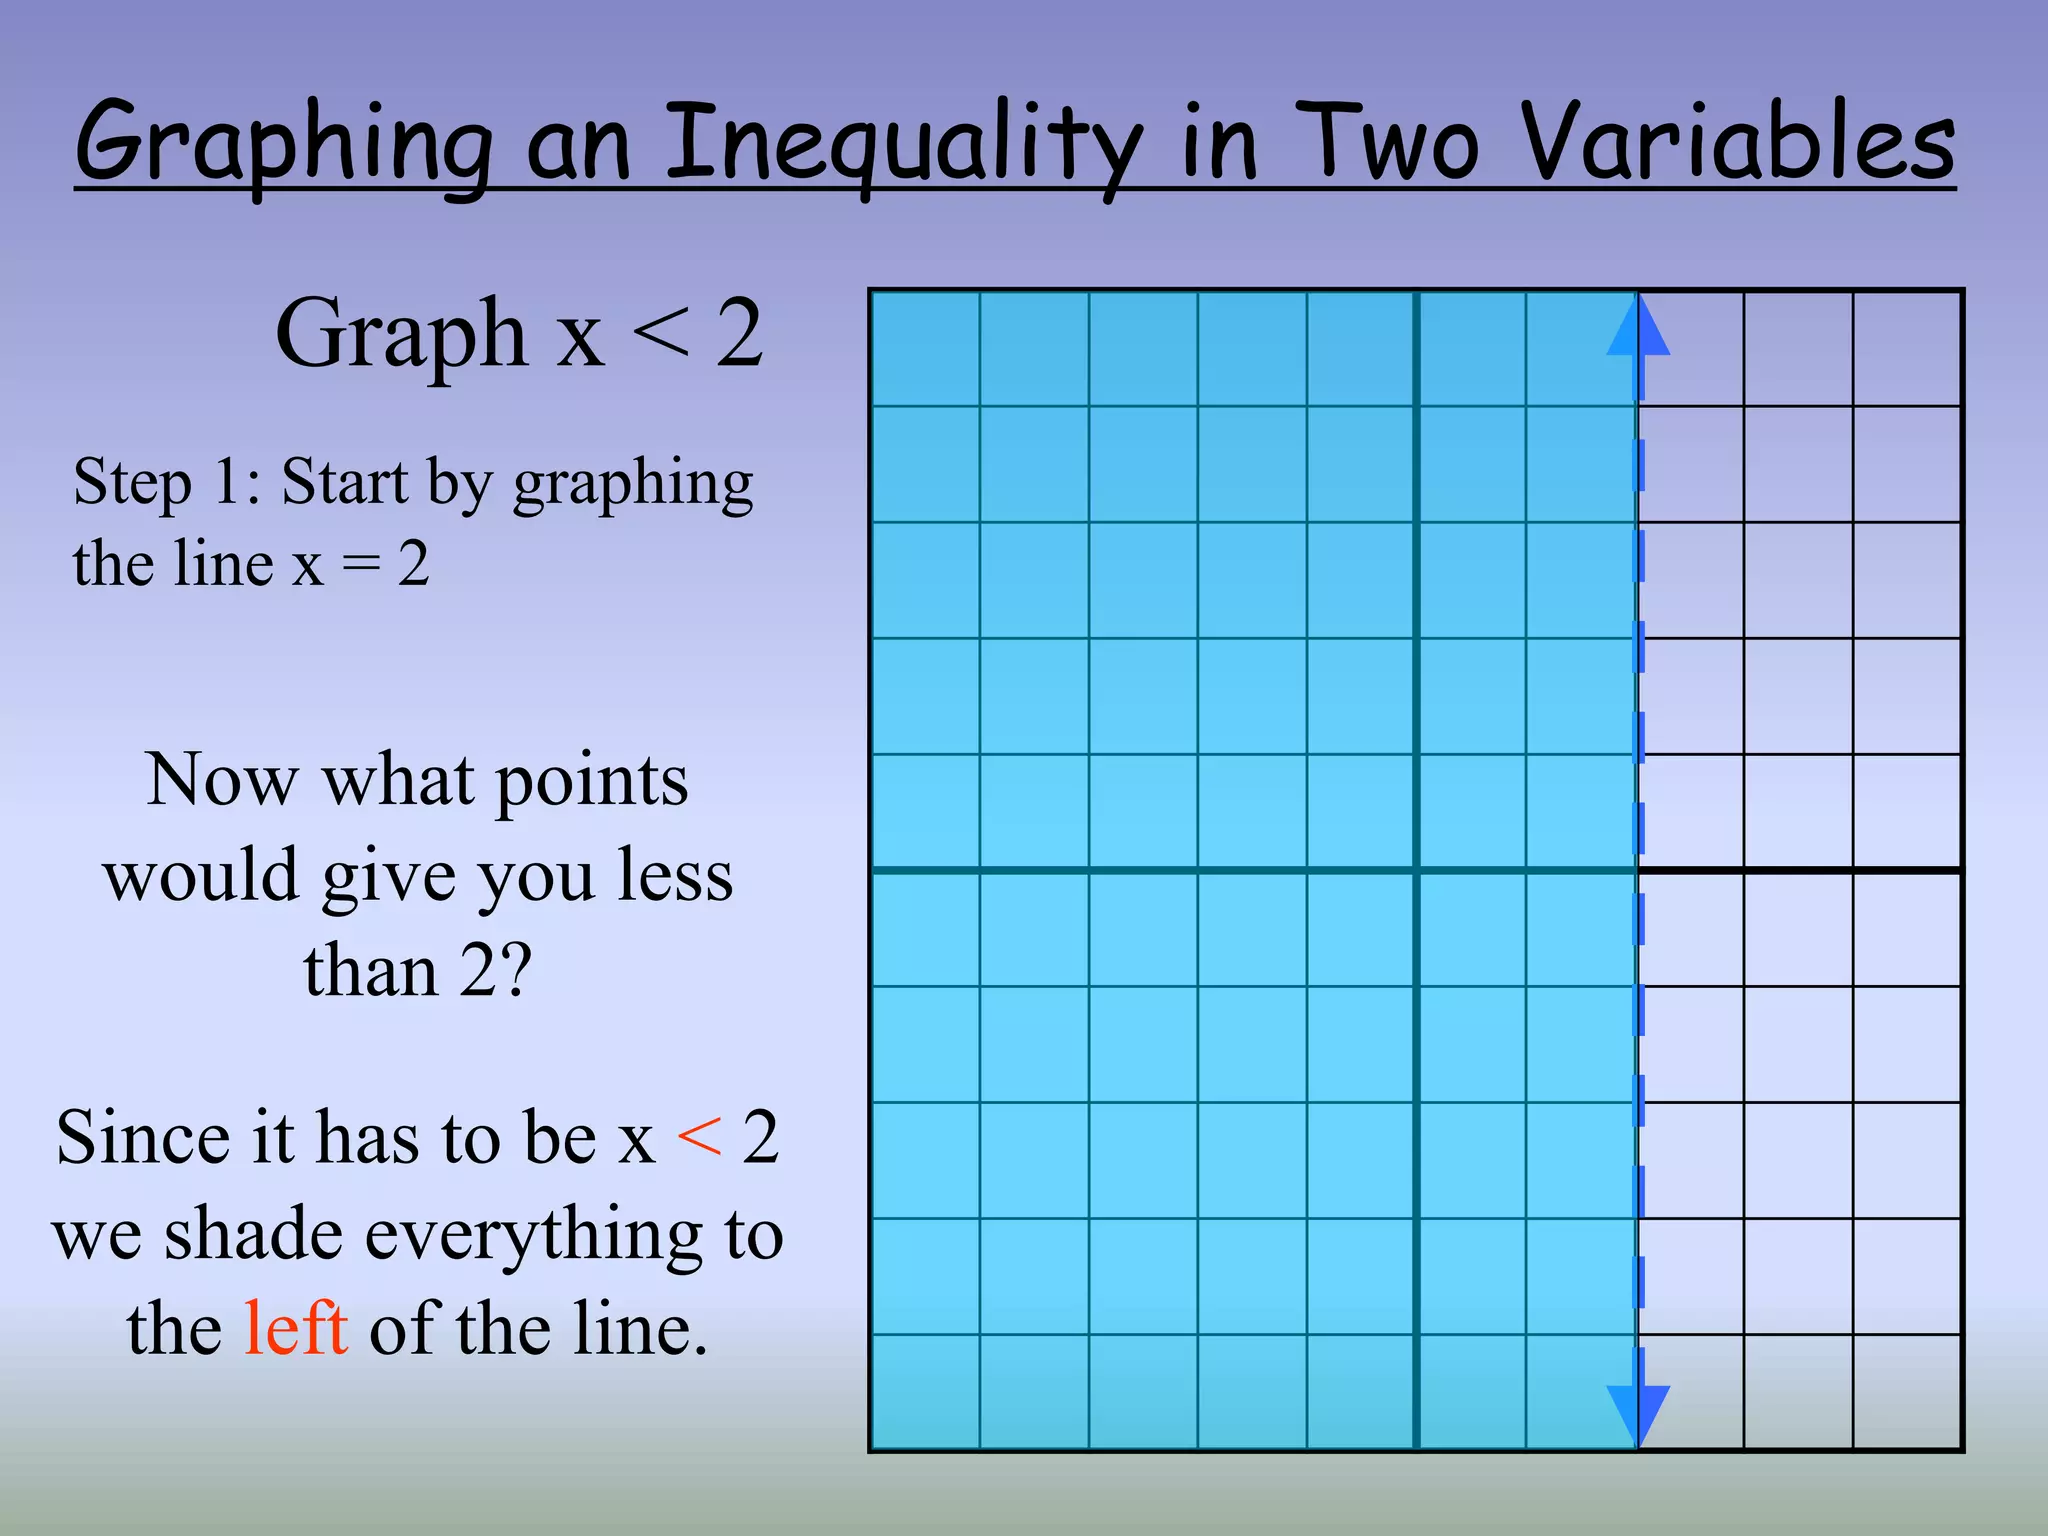
Graphing an Inequalityin Two Variables
Graph x < 2
Step 1: Start by graphing
the line x = 2
Now what points
would give you less
than 2?
Since it has to be x < 2
we shade everything to
the left of the line.


![Grade 8 Probability Cambridge [PPT]](https://cdn.slidesharecdn.com/ss_thumbnails/g8unit15probability-201206023054-thumbnail.jpg?width=640&height=640&fit=bounds)


