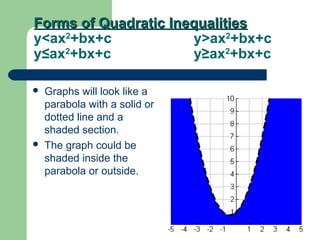
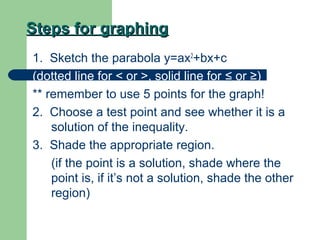
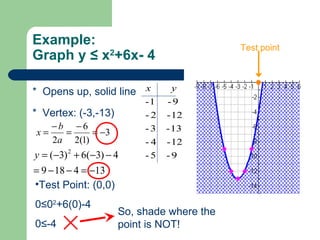
Graphs of quadratic inequalities will be parabolas with solid or dotted lines and shaded regions above or below the parabola. To graph: 1) sketch the parabola y=ax^2+bx+c, 2) choose a test point and see if it satisfies the inequality, 3) shade the appropriate region based on the test point. For example, to graph y ≤ x^2+6x-4: the parabola opens up with a solid line and vertex at (-3,-13), the test point (0,0) satisfies the inequality so shade below the parabola.