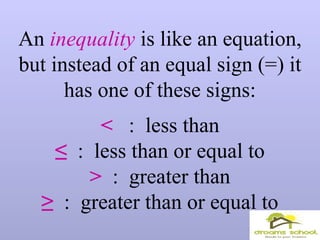
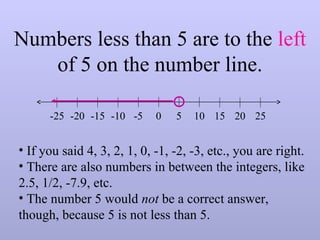
1
Solving and
Graphing
Inequalities
An inequality is like an equation,
but instead of an equal sign (=) it
has one of these signs:
< : less than
≤ : less than or equal to
> : greater than
≥ : greater than or equal to
“x < 5”
means that whatever value x
has, it must be less than 5.
Try to name ten numbers that
are less than 5!
Numbers less than 5 are to the left
of 5 on the number line.
0 5 10 15-20 -15 -10 -5-25 20 25
• If you said 4, 3, 2, 1, 0, -1, -2, -3, etc., you are right.
• There are also numbers in between the integers, like
2.5, 1/2, -7.9, etc.
• The number 5 would not be a correct answer,
though, because 5 is not less than 5.
“x ≥ -2”
means that whatever value x
has, it must be greater than or
equal to -2.
Try to name ten numbers that
are greater than or equal to
-2!
Numbers greater than -2 are to the
right of 5 on the number line.
0 5 10 15-20 -15 -10 -5-25 20 25
• If you said -1, 0, 1, 2, 3, 4, 5, etc., you are right.
• There are also numbers in between the integers,
like -1/2, 0.2, 3.1, 5.5, etc.
• The number -2 would also be a correct answer,
because of the phrase, “or equal to”.
-2
Where is -1.5 on the number line?
Is it greater or less than -2?
0 5 10 15-20 -15 -10 -5-25 20 25
• -1.5 is between -1 and -2.
• -1 is to the right of -2.
• So -1.5 is also to the right of -2.
-2
Solve an Inequality
w + 5 < 8
w + 5 + (-5) < 8 + (-5)
w < 3
All numbers less
than 3 are
solutions to this
problem!
More Examples
8 + r ≥ -2
8 + r + (-8) ≥ -2 + (-8)
r ≥ -10
All numbers from -10 and up (including
-10) make this problem true!
More Examples
x - 2 > -2
x + (-2) + (2) > -2 + (2)
x > 0
All numbers greater than 0 make this
problem true!
More Examples
4 + y ≤ 1
4 + y + (-4) ≤ 1 + (-4)
y ≤ -3
All numbers from -3 down (including -3)
make this problem true!
There is one special case.
● Sometimes you may have to reverse the
direction of the inequality sign!!
● That only happens when you
multiply or divide both sides of the
inequality by a negative number.
Example:
Solve: -3y + 5 >23
-5 -5
-3y > 18
-3 -3
y < -6
●Subtract 5 from each side.
●Divide each side by negative 3.
●Reverse the inequality sign.
●Graph the solution.
0-6
Try these:
1.) Solve 2x + 3 > x + 5 2.)Solve - c – 11 >23
3.) Solve 3(r - 2) < 2r + 4
-x -x
x + 3 > 5
-3 -3
x > 2
+ 11 + 11
-c > 34
-1 -1
c < -34
3r – 6 < 2r + 4
-2r -2r
r – 6 < 4
+6 +6 r < 10
You did remember to reverse
the signs . . .
57415 ≤−−<− x
7+7+
1248 ≤−<− x
4−
7+
4− 4−
2 x 3−> ≥
. . . didn’t you?Good job!
Example: 8462 +<− xx
- 4x - 4x
862 <−− x
+ 6 +6
142 <− x
-2 -2
Ring the alarm!
We divided by a
negative!
7−>xWe turned the sign!
Remember Absolute Value
Ex: Solve 6x-3 = 15
6x-3 = 15 or 6x-3 = -15
6x = 18 or 6x = -12
x = 3 or x = -2
* Plug in answers to check your solutions!
Ex: Solve 2x + 7 -3 = 8
Get the abs. value part by itself first!
2x+7 = 11
Now split into 2 parts.
2x+7 = 11 or 2x+7 = -11
2x = 4 or 2x = -18
x = 2 or x = -9
Check the solutions.
Ex: Solve & graph.
• Becomes an “and” problem
2194 ≤−x
2
15
3 ≤≤− x -3 7 8
Solve & graph.
• Get absolute value by itself first.
• Becomes an “or” problem
11323 ≥+−x
823 ≥−x
823or823 −≤−≥− xx
63or103 −≤≥ xx
2or
3
10
−≤≥ xx
-2 3 4
Example 1:
● |2x + 1| > 7
● 2x + 1 > 7 or 2x + 1 >7
● 2x + 1 >7 or 2x + 1 <-7
● x > 3 or x < -4
This is an ‘or’ statement.
(Greator). Rewrite.
In the 2nd
inequality, reverse the
inequality sign and negate the
right side value.
Solve each inequality.
Graph the solution.
3-4
Example 2:
● |x -5|< 3
● x -5< 3 and x -5< 3
● x -5< 3 and x -5> -3
● x < 8 and x > 2
● 2 < x < 8
This is an ‘and’ statement.
(Less thand).
Rewrite.
In the 2nd inequality, reverse the
inequality sign and negate the
right side value.
Solve each inequality.
Graph the solution.
82
Absolute Value Inequalities
Case 1 Example: 3 5x − <
3 5
2
x
x
− > −
> −
and
8x
53x
<
<−
8x2 <<−
Absolute Value Inequalities
Case 2 Example: 2 1 9x + >
2 1 9
2 10
5
x
x
x
+ < −
< −
< −
5x < −
2 1 9
2 8
4
x
x
x
+ >
>
>
4x >OR
or
Absolute Value
• Answer is always positive
• Therefore the following examples
cannot happen. . .
Solutions: No solution
953x −=+
Graphing Linear Inequalities
in Two Variables
•SWBAT graph a linear
inequality in two variables
•SWBAT Model a real life
situation with a linear
inequality.
Some Helpful Hints
•If the sign is > or < the line is
dashed
•If the sign is ≥ or ≤ the line will be
solid
When dealing with just x and y.
•If the sign > or ≥ the shading
either goes up or to the right
•If the sign is < or ≤ the shading
either goes down or to the left
When dealing with slanted lines
•If it is > or ≥ then you shade above
•If it is < or ≤ then you shade below
the line
Graphing an Inequality in Two Variables
Graph x < 2
Step 1: Start by graphing
the line x = 2
Now what points
would give you less
than 2?
Since it has to be x < 2
we shade everything to
the left of the line.
Graphing a Linear Inequality
Sketch a graph of y ≥ 3
Using What We Know
Sketch a graph of x + y < 3
Step 1: Put into
slope intercept form
y <-x + 3
Step 2: Graph the
line y = -x + 3
34
Do you find this slides were useful?
One second of your life , can bring a smile in a girl life
If Yes ,Join Dreams School “Campaign for Female Education”
Help us in bringing a change in a girl life, because “When
someone takes away your pens you realize quite how
important education is”.
Just Click on any advertisement on the page, your one
click can make her smile.
Eliminate Inequality “Not Women”
One second of your life , can bring a smile in her life!!
Do you find these slides were useful?
If Yes ,Join Dreams School “Campaign
for Female Education”
Help us in bringing a change in a girl life,
because “When someone takes away your
pens you realize quite how important
education is”.
Just Click on any advertisement on the page,
your one click can make her smile.
We our doing our part & u ?
Eliminate Inequality “Not Women”

0

  • 1.
  • 2.
  • 3.
    An inequality islike an equation, but instead of an equal sign (=) it has one of these signs: < : less than ≤ : less than or equal to > : greater than ≥ : greater than or equal to
  • 4.
    “x < 5” meansthat whatever value x has, it must be less than 5. Try to name ten numbers that are less than 5!
  • 5.
    Numbers less than5 are to the left of 5 on the number line. 0 5 10 15-20 -15 -10 -5-25 20 25 • If you said 4, 3, 2, 1, 0, -1, -2, -3, etc., you are right. • There are also numbers in between the integers, like 2.5, 1/2, -7.9, etc. • The number 5 would not be a correct answer, though, because 5 is not less than 5.
  • 6.
    “x ≥ -2” meansthat whatever value x has, it must be greater than or equal to -2. Try to name ten numbers that are greater than or equal to -2!
  • 7.
    Numbers greater than-2 are to the right of 5 on the number line. 0 5 10 15-20 -15 -10 -5-25 20 25 • If you said -1, 0, 1, 2, 3, 4, 5, etc., you are right. • There are also numbers in between the integers, like -1/2, 0.2, 3.1, 5.5, etc. • The number -2 would also be a correct answer, because of the phrase, “or equal to”. -2
  • 8.
    Where is -1.5on the number line? Is it greater or less than -2? 0 5 10 15-20 -15 -10 -5-25 20 25 • -1.5 is between -1 and -2. • -1 is to the right of -2. • So -1.5 is also to the right of -2. -2
  • 9.
    Solve an Inequality w+ 5 < 8 w + 5 + (-5) < 8 + (-5) w < 3 All numbers less than 3 are solutions to this problem!
  • 10.
    More Examples 8 +r ≥ -2 8 + r + (-8) ≥ -2 + (-8) r ≥ -10 All numbers from -10 and up (including -10) make this problem true!
  • 11.
    More Examples x -2 > -2 x + (-2) + (2) > -2 + (2) x > 0 All numbers greater than 0 make this problem true!
  • 12.
    More Examples 4 +y ≤ 1 4 + y + (-4) ≤ 1 + (-4) y ≤ -3 All numbers from -3 down (including -3) make this problem true!
  • 13.
    There is onespecial case. ● Sometimes you may have to reverse the direction of the inequality sign!! ● That only happens when you multiply or divide both sides of the inequality by a negative number.
  • 14.
    Example: Solve: -3y +5 >23 -5 -5 -3y > 18 -3 -3 y < -6 ●Subtract 5 from each side. ●Divide each side by negative 3. ●Reverse the inequality sign. ●Graph the solution. 0-6
  • 15.
    Try these: 1.) Solve2x + 3 > x + 5 2.)Solve - c – 11 >23 3.) Solve 3(r - 2) < 2r + 4 -x -x x + 3 > 5 -3 -3 x > 2 + 11 + 11 -c > 34 -1 -1 c < -34 3r – 6 < 2r + 4 -2r -2r r – 6 < 4 +6 +6 r < 10
  • 16.
    You did rememberto reverse the signs . . . 57415 ≤−−<− x 7+7+ 1248 ≤−<− x 4− 7+ 4− 4− 2 x 3−> ≥ . . . didn’t you?Good job!
  • 17.
    Example: 8462 +<−xx - 4x - 4x 862 <−− x + 6 +6 142 <− x -2 -2 Ring the alarm! We divided by a negative! 7−>xWe turned the sign!
  • 18.
  • 19.
    Ex: Solve 6x-3= 15 6x-3 = 15 or 6x-3 = -15 6x = 18 or 6x = -12 x = 3 or x = -2 * Plug in answers to check your solutions!
  • 20.
    Ex: Solve 2x+ 7 -3 = 8 Get the abs. value part by itself first! 2x+7 = 11 Now split into 2 parts. 2x+7 = 11 or 2x+7 = -11 2x = 4 or 2x = -18 x = 2 or x = -9 Check the solutions.
  • 21.
    Ex: Solve &graph. • Becomes an “and” problem 2194 ≤−x 2 15 3 ≤≤− x -3 7 8
  • 22.
    Solve & graph. •Get absolute value by itself first. • Becomes an “or” problem 11323 ≥+−x 823 ≥−x 823or823 −≤−≥− xx 63or103 −≤≥ xx 2or 3 10 −≤≥ xx -2 3 4
  • 23.
    Example 1: ● |2x+ 1| > 7 ● 2x + 1 > 7 or 2x + 1 >7 ● 2x + 1 >7 or 2x + 1 <-7 ● x > 3 or x < -4 This is an ‘or’ statement. (Greator). Rewrite. In the 2nd inequality, reverse the inequality sign and negate the right side value. Solve each inequality. Graph the solution. 3-4
  • 24.
    Example 2: ● |x-5|< 3 ● x -5< 3 and x -5< 3 ● x -5< 3 and x -5> -3 ● x < 8 and x > 2 ● 2 < x < 8 This is an ‘and’ statement. (Less thand). Rewrite. In the 2nd inequality, reverse the inequality sign and negate the right side value. Solve each inequality. Graph the solution. 82
  • 25.
    Absolute Value Inequalities Case1 Example: 3 5x − < 3 5 2 x x − > − > − and 8x 53x < <− 8x2 <<−
  • 26.
    Absolute Value Inequalities Case2 Example: 2 1 9x + > 2 1 9 2 10 5 x x x + < − < − < − 5x < − 2 1 9 2 8 4 x x x + > > > 4x >OR or
  • 27.
    Absolute Value • Answeris always positive • Therefore the following examples cannot happen. . . Solutions: No solution 953x −=+
  • 28.
    Graphing Linear Inequalities inTwo Variables •SWBAT graph a linear inequality in two variables •SWBAT Model a real life situation with a linear inequality.
  • 29.
    Some Helpful Hints •Ifthe sign is > or < the line is dashed •If the sign is ≥ or ≤ the line will be solid When dealing with just x and y. •If the sign > or ≥ the shading either goes up or to the right •If the sign is < or ≤ the shading either goes down or to the left
  • 30.
    When dealing withslanted lines •If it is > or ≥ then you shade above •If it is < or ≤ then you shade below the line
  • 31.
    Graphing an Inequalityin Two Variables Graph x < 2 Step 1: Start by graphing the line x = 2 Now what points would give you less than 2? Since it has to be x < 2 we shade everything to the left of the line.
  • 32.
    Graphing a LinearInequality Sketch a graph of y ≥ 3
  • 33.
    Using What WeKnow Sketch a graph of x + y < 3 Step 1: Put into slope intercept form y <-x + 3 Step 2: Graph the line y = -x + 3
  • 34.
    34 Do you findthis slides were useful? One second of your life , can bring a smile in a girl life If Yes ,Join Dreams School “Campaign for Female Education” Help us in bringing a change in a girl life, because “When someone takes away your pens you realize quite how important education is”. Just Click on any advertisement on the page, your one click can make her smile. Eliminate Inequality “Not Women” One second of your life , can bring a smile in her life!! Do you find these slides were useful? If Yes ,Join Dreams School “Campaign for Female Education” Help us in bringing a change in a girl life, because “When someone takes away your pens you realize quite how important education is”. Just Click on any advertisement on the page, your one click can make her smile. We our doing our part & u ? Eliminate Inequality “Not Women”