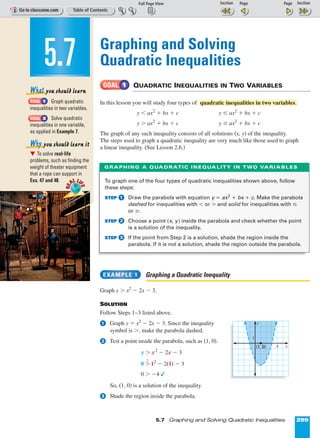
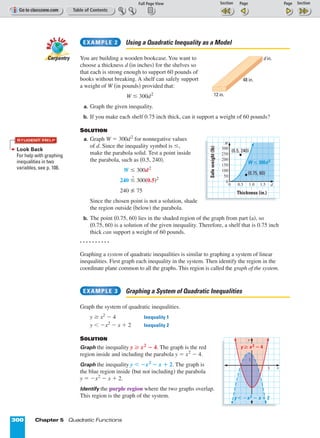
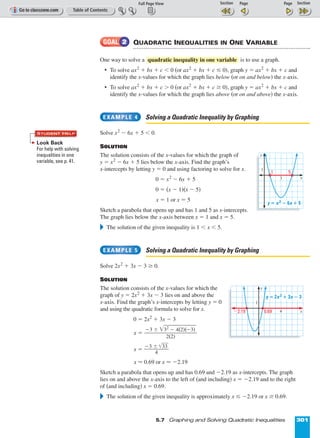
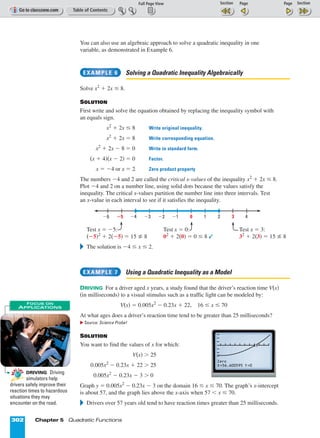
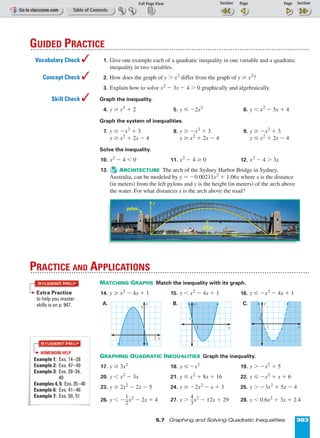
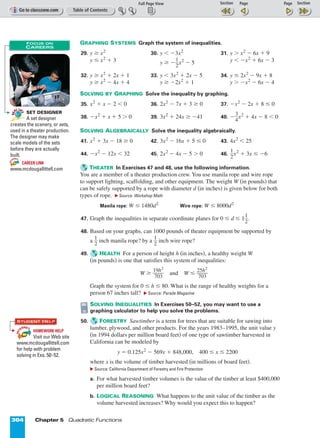
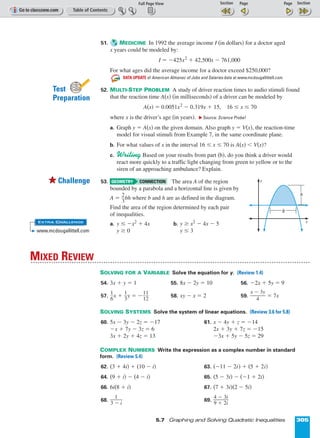

This document discusses graphing and solving quadratic inequalities. It provides examples of graphing quadratic inequalities in two variables by drawing the parabola defined by the equation and shading the appropriate region based on the inequality symbol. It also discusses graphing systems of quadratic inequalities by identifying the common region where the individual graphs overlap. The document further explains how to solve quadratic inequalities in one variable either graphically by identifying the x-values where the parabola lies above or below the x-axis, or algebraically by finding the critical values and testing intervals. Examples are provided to illustrate both graphical and algebraic approaches.


