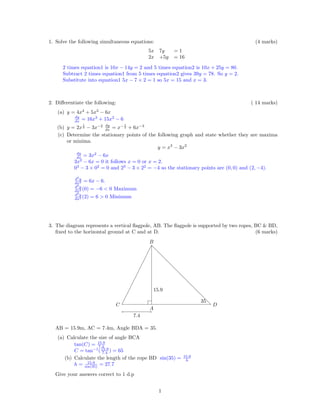
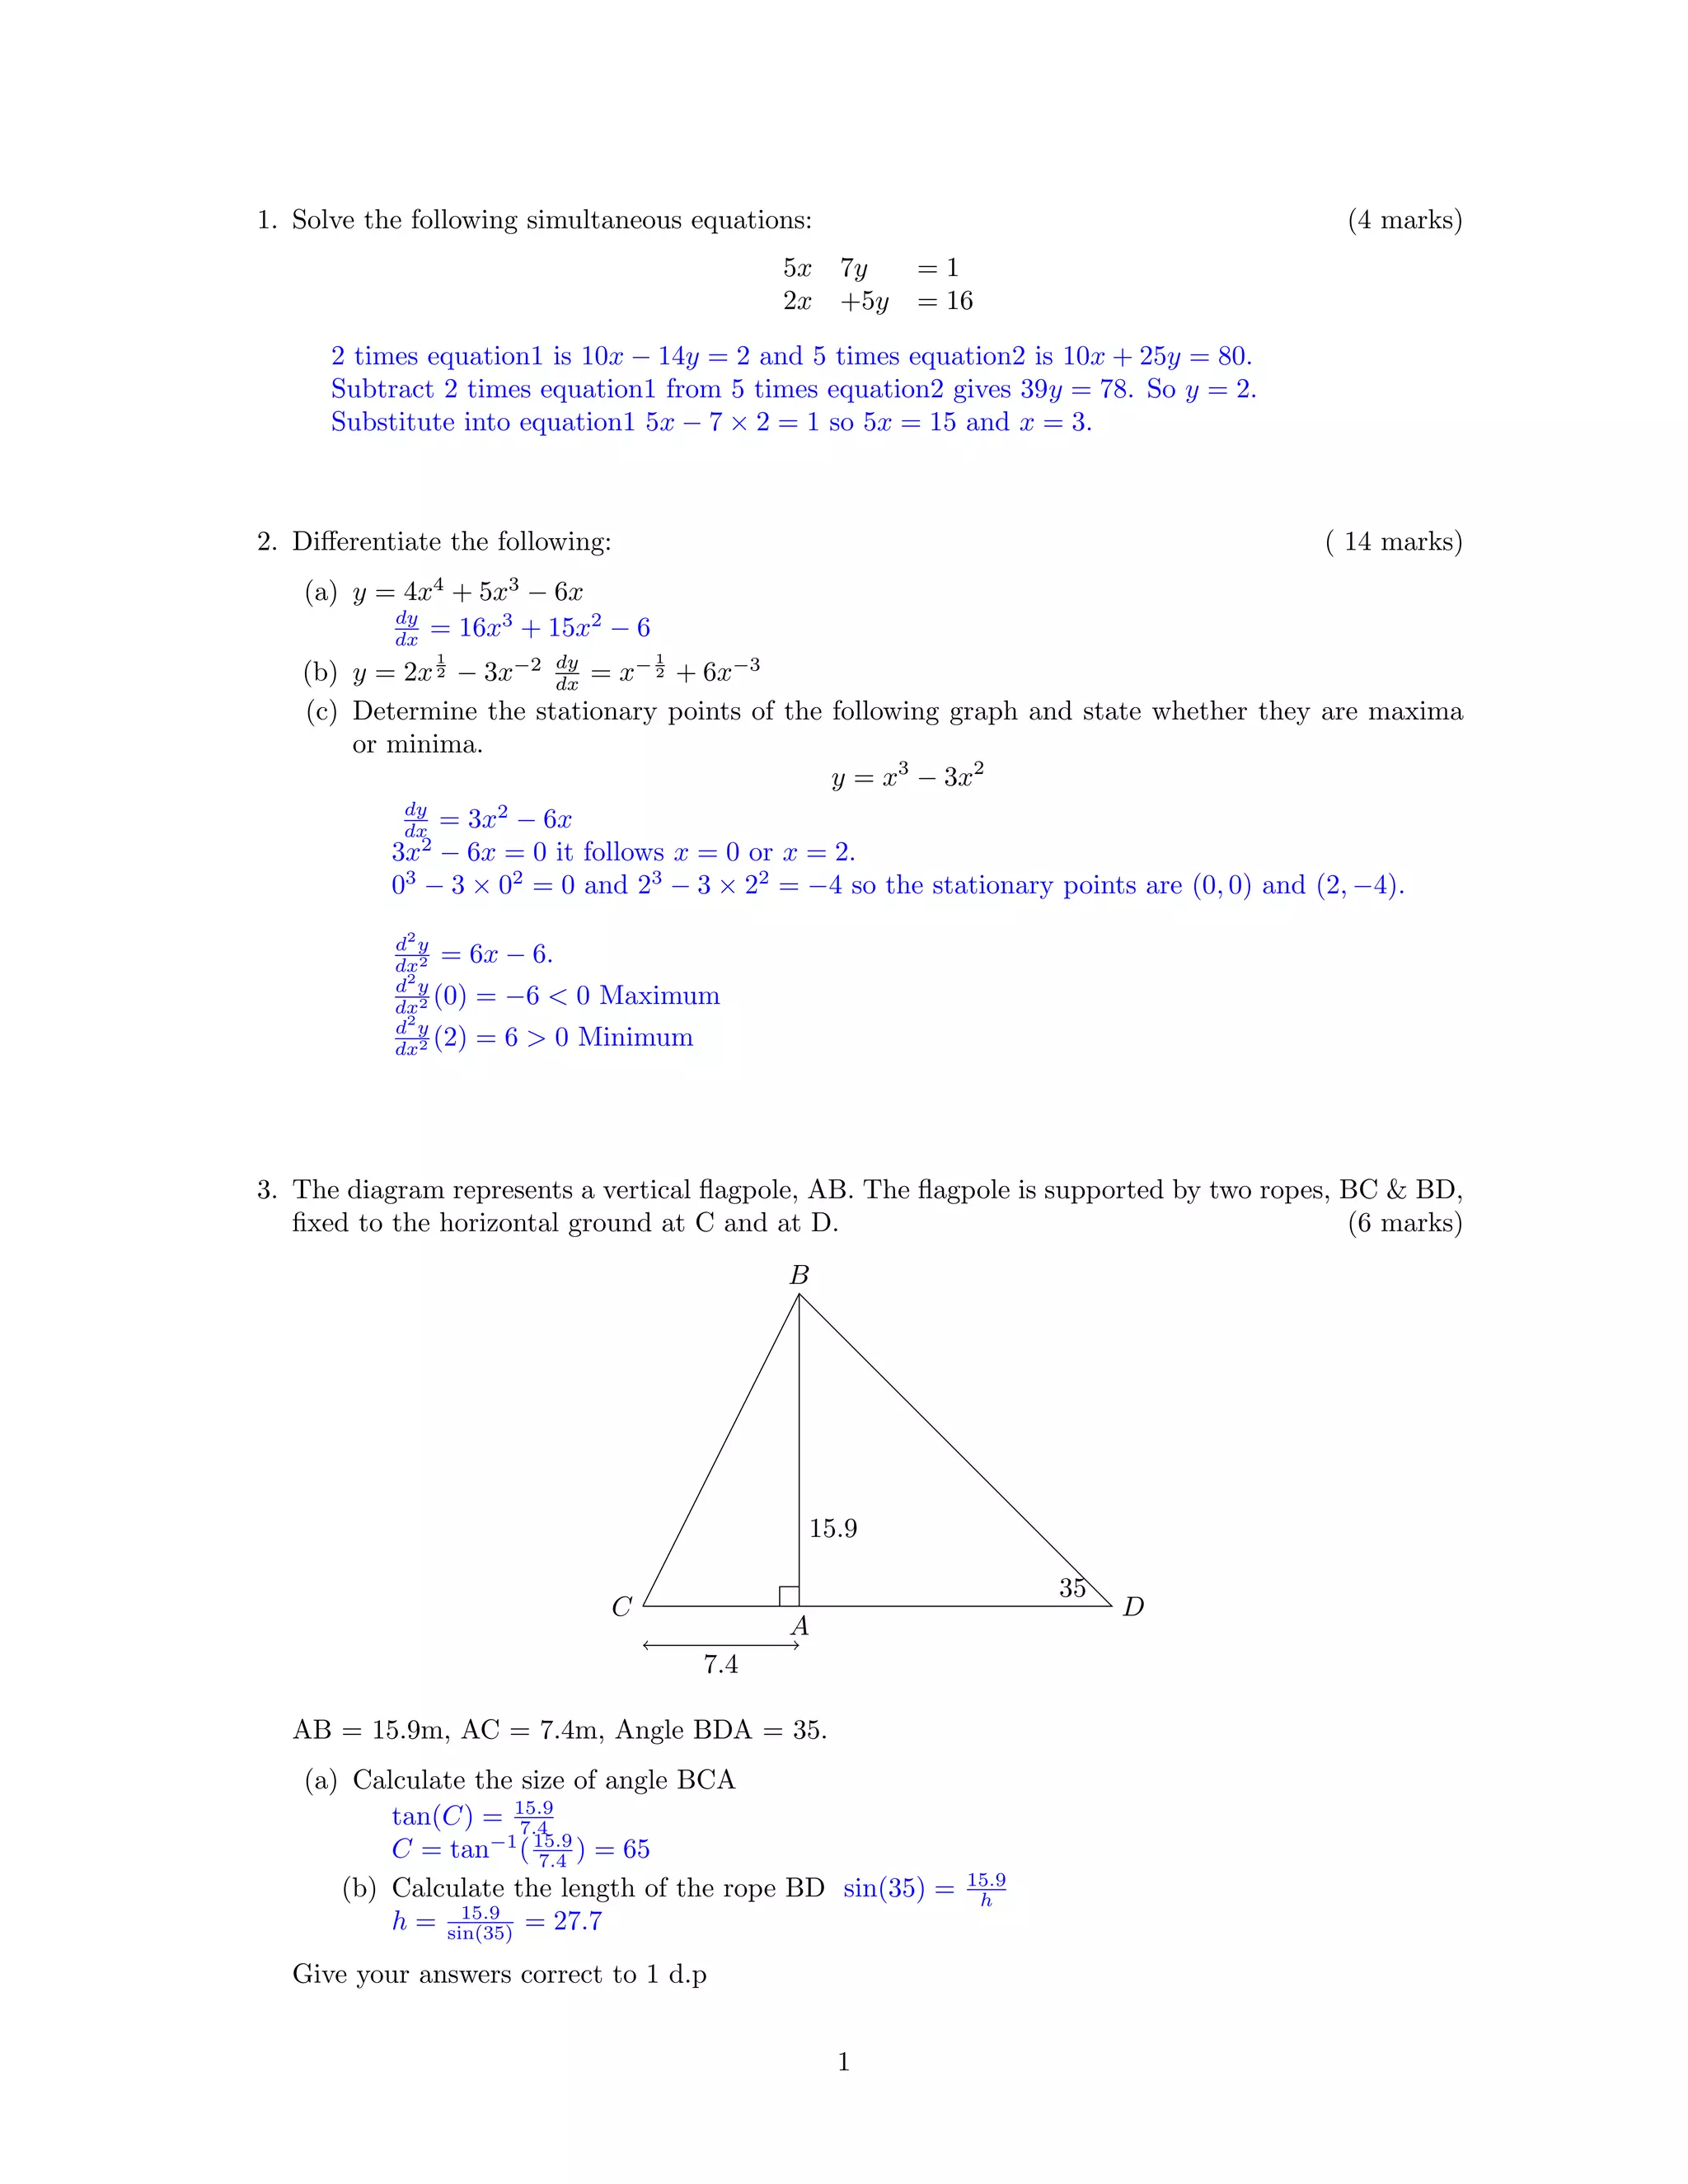
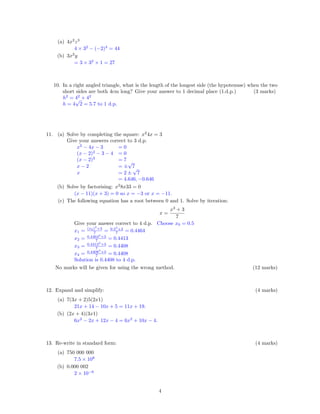
1. The document provides solutions to various mathematical problems including: solving simultaneous equations, differentiation, determining stationary points, trigonometry involving a flagpole, probability, integration, and standard form.
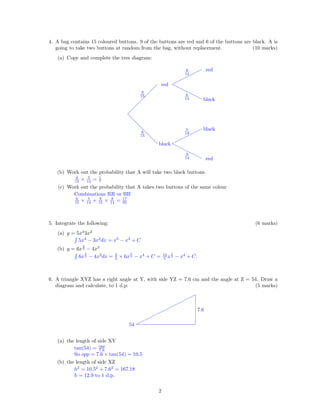
2. A chi-squared test is performed to determine if there is a difference between students' views of maths and English. The null hypothesis is that there is no difference, and it is not rejected based on the test statistic being less than the critical value.
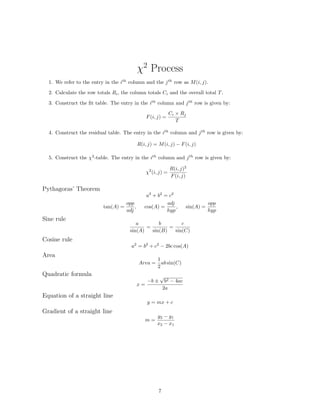
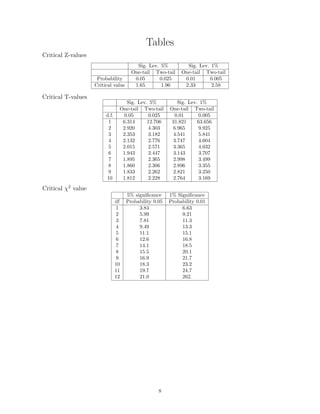
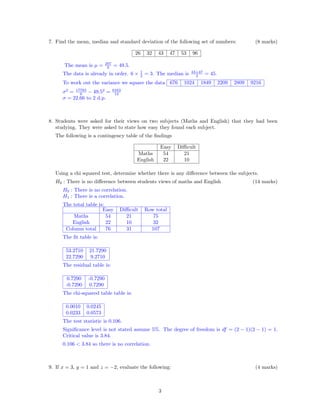
3. Various formulae are provided for statistical measures like mean, variance, z-score, t-score, as well as trigonometric, geometric formulas and tables of critical values for z, t and chi-squared tests.
![Formulae
Let X be a list of data of size n.
Mean:
µ(X) =
n
i=1 X[i]
n
Variance
σ2
(X) =
n
i=1(X[i])2
n
− µ2
(X)
Absolute deviation
AD =
n
i=1 |X[i] − µ|
n
Z-statistic
Z =
µ(X) − µ
σ/
√
n
Sample Variance
σ2
(X) =
n
i=1(X[i])2
− nµ2
(X)
n − 1
T-statistic
T =
µ(X) − µ
σ(X)/
√
n
Alternative notation
Mean
¯x =
x
n
Variance
V ar =
x2
n
− ¯x2
Absolute deviation
AD =
|x − ¯x|
n
Z-statistic
Z =
¯x − A
σ/
√
n
Sample Variance
s2
=
x2
− n¯x2
n − 1
T-statistic
T =
¯x − A
s/
√
n
6](https://image.slidesharecdn.com/foundationc2examaugust2012sols-140603104828-phpapp02/85/Foundation-c2-exam-august-2012-sols-6-320.jpg)