Downloaded 13 times

![NMR Spectroscopy
Con….
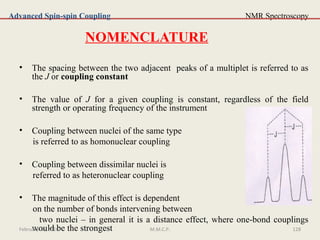
There are many variations of the subscripts and superscripts associated with J
constants
In general, the superscript numeral to the left of J is the number of intervening
bonds through which the coupling is taking place
3
J is a coupling constant operating through three bonds
Subscripts to the right of J can be used to show the type of coupling, such as HH for
homonuclear between protons or HC for heteronuclear between a carbon and
proton
Often, this subscript will be used to define the various J-constants within a
complex multiplet: J1, J2, J3, etc. or JAB, JBC, JAC]
Although J values are referred to as positive numbers, they may in actuality be
positive or negative
Advanced Spin-spin Coupling
February 28, 2016 129M.M.C.P.](https://image.slidesharecdn.com/3-160228042413/85/3-b-pharm-nuclearmagneticresonance-jntu-pharmacy-129-320.jpg)


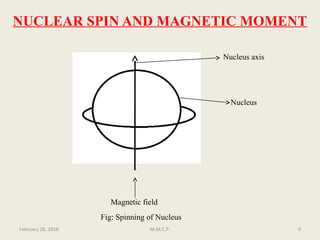
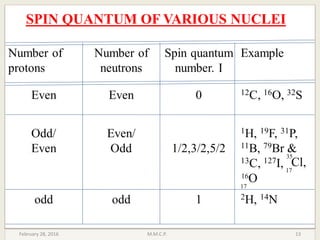
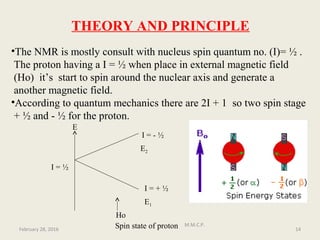
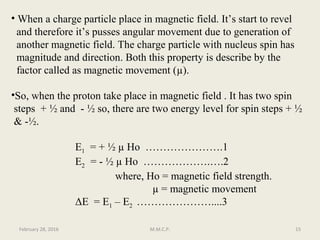
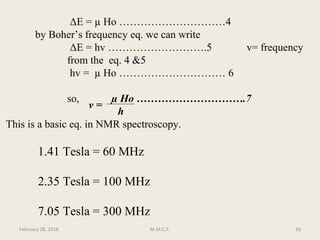
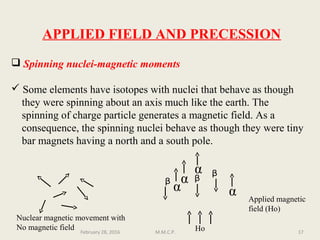
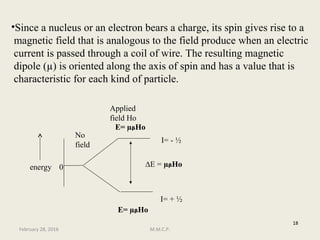
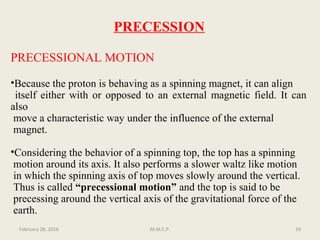
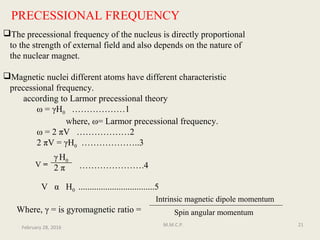
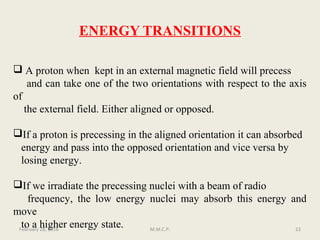
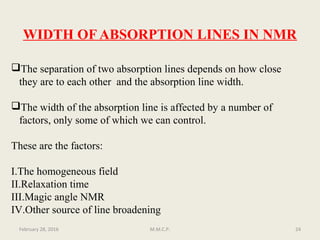
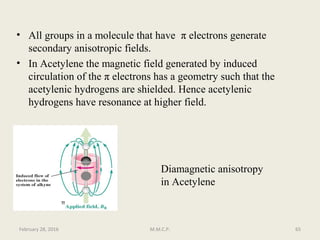
This document provides an overview of Nuclear Magnetic Resonance Spectroscopy (NMR). It discusses key topics such as nuclear spin, magnetic moments, precession, resonance frequency, absorption lines, relaxation times, and factors that influence line broadening. The document is intended to introduce students to the basic theory, principles, and applications of NMR spectroscopy.