Downloaded 30 times
![Spectroscopy[2,4,5]
EMR ANALYTE SPECTROPHOTOGRAPH
Conc. should be lower
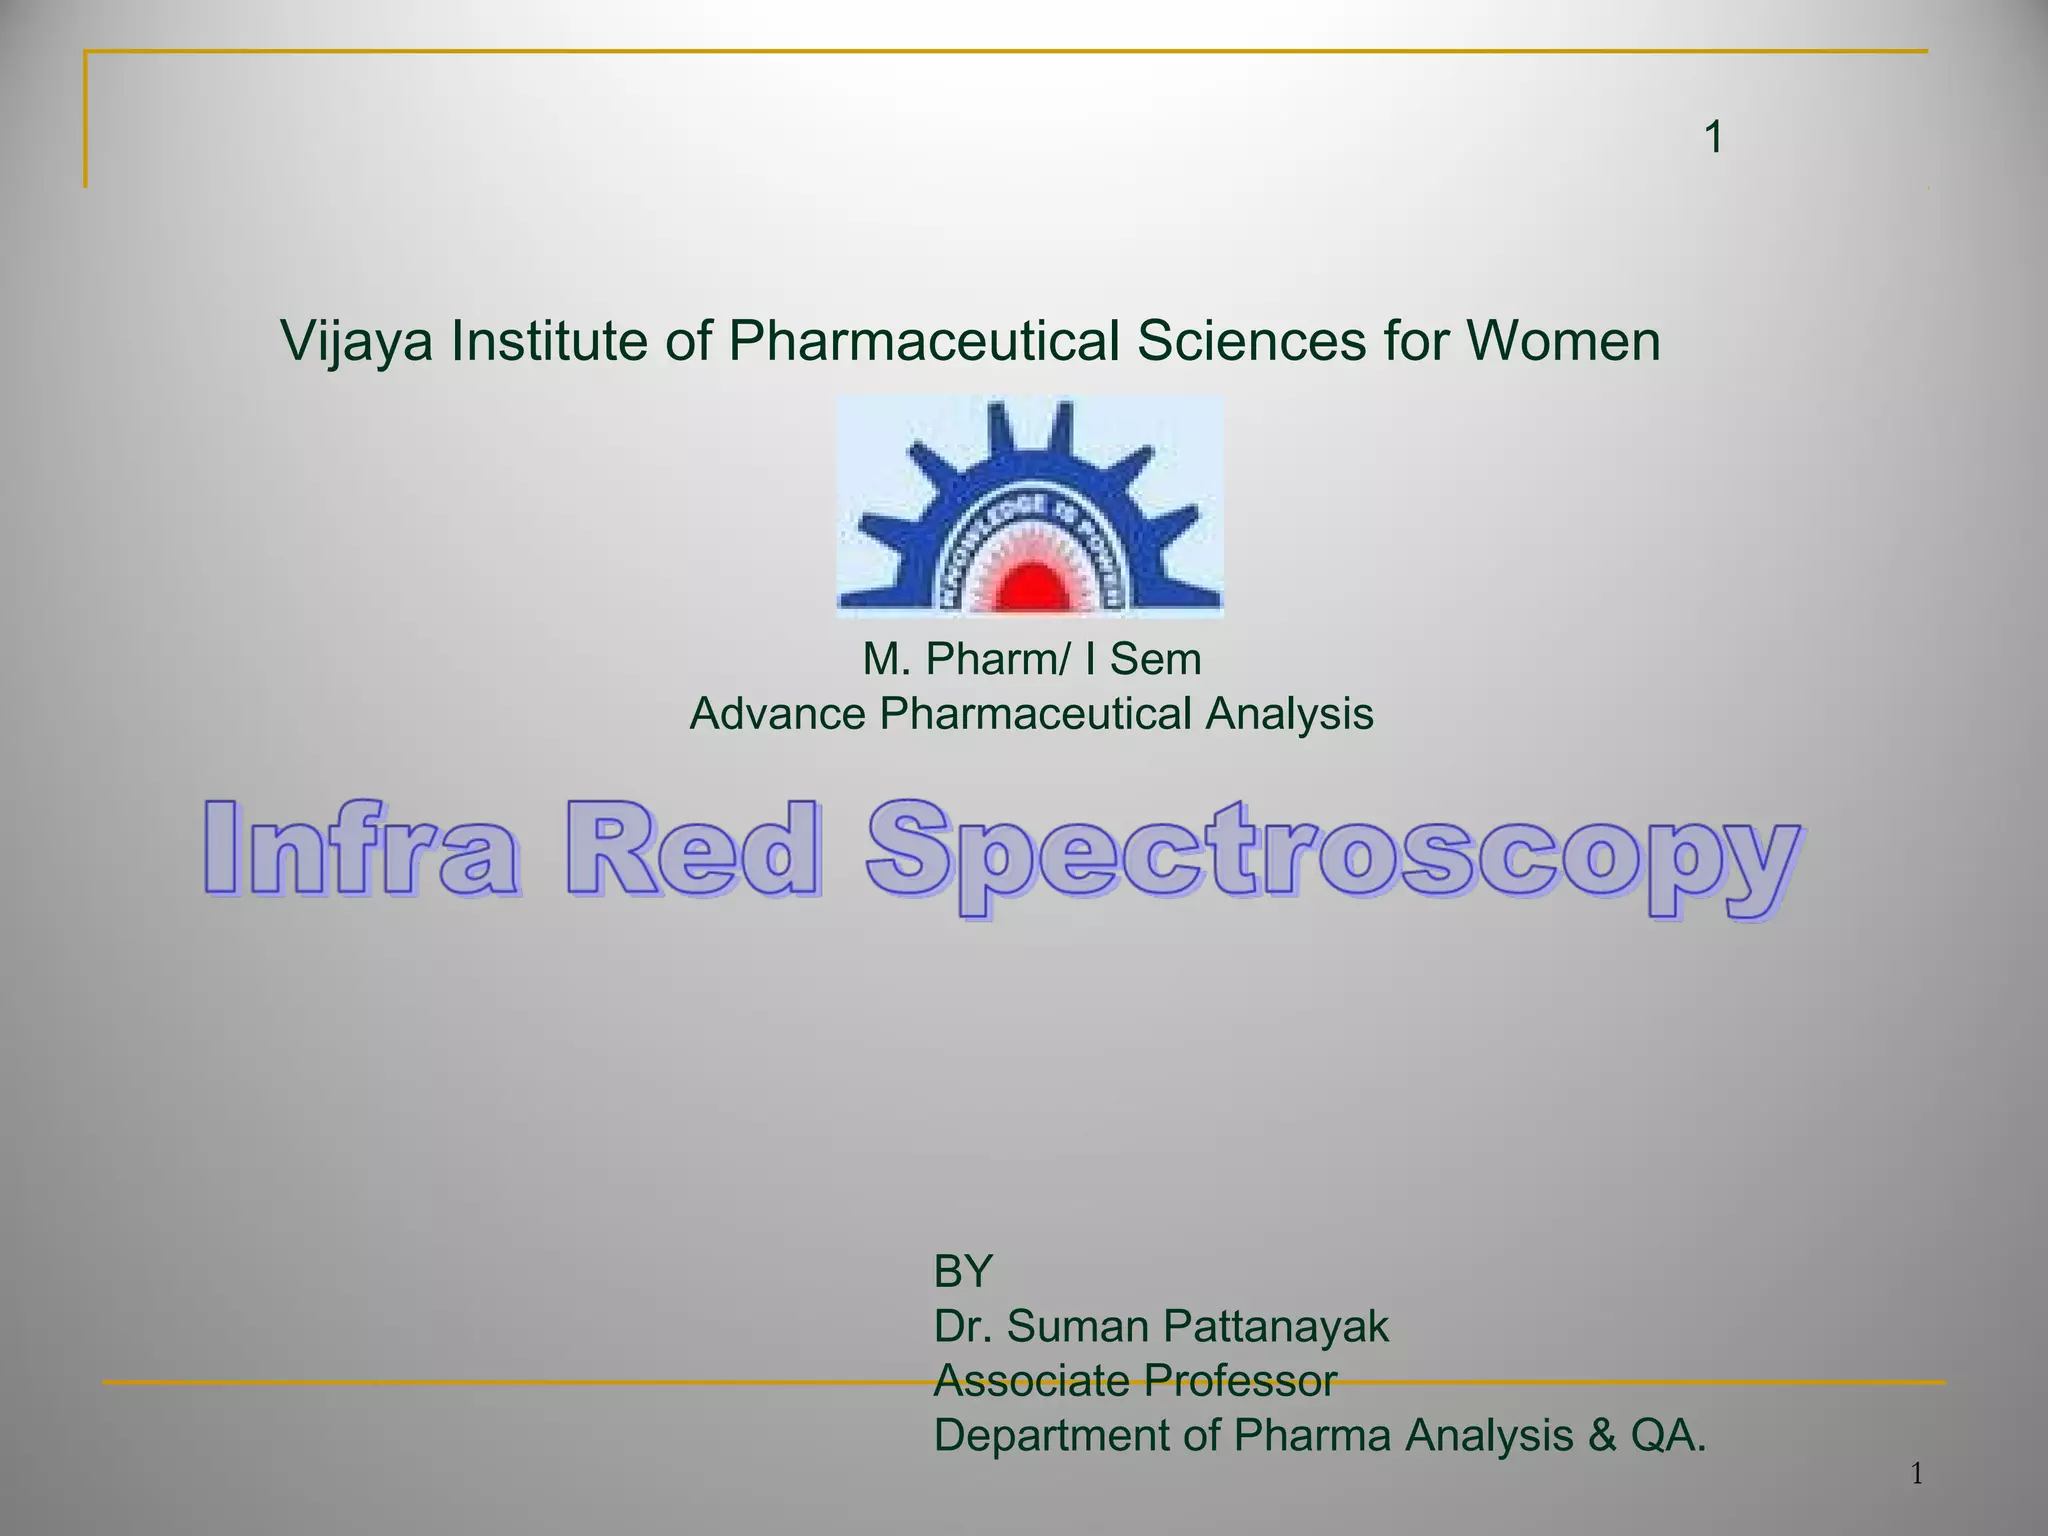
1.UV-Visible radiations---excitation of electrons----uv-visiblespectrum
2.IR-radiations—vibration changes in electrons---IR spectrum
3.Microwave radiations---spin resonance----E.S.R spectrum
4.Radio frequency---spin rotational changes---N.M.R spectrum
study of interaction of
electromagnetic radiation with
matter
4. www.answers.com. Web. 25 feb 2010. http://www.answers.com/topic/spectroscopy
5. www. en.wikipedia.org. Web. 25 feb 2010 < http://en.wikipedia.org/wiki/Infrared_spectroscopy>.
2. B.K. SHARMA," fundamental principles of spectroscopy” ,spectroscopy ,20th
edition, page noS-11, Goel publications, Delhi, 2007. print.
4
Principle of spectroscopy[2,4,5]](https://image.slidesharecdn.com/7irinterpretationjntupharmacy-160228044721/85/7-ir-interpretatio-njntu-pharmacy-4-320.jpg)
![Gamma rays
X rays
UV
Visible
Infra-Red
Micro waves
Radio waves
Violet
indigo
Blue
Green
Orange
Yellow
Red
370
nm
nm
650
590
550
490
450
430
EMR
Drug
substance
Energy
Kcal/mol
9.4 x 10⁷
9.4 x101
9.4 x10³
9.4 x 10⁻¹
9.4 x 10⁻³
9.4 x 10⁻⁵
9.4 x 10⁻⁷
Λ
0
A
Frequency
(Hz)
Absorbing radiations
Type
of
spectroscopy
1
7 6 0 0
6 x 10⁶
3 x 10⁹
3 x 10¹³
15 0
3 8 0 0
1021
1017
1015
1013
1011
1009
1007
Emission
Both E & Abs
NMR Abs
Absorption
Absorption
Absorption
Absorption
THE ELECTROMAGNETIC SPECTRUMTHE ELECTROMAGNETIC SPECTRUM
Characteristics of radiations
Resulting spectrum
5. www. en.wikipedia.org. Web. 25 feb 2010 < http://en.wikipedia.org/wiki/Infraredspectroscopy>.
2. B.K. SHARMA," fundamental principles of spectroscopy” Spectroscopy 20th
edition, page no.S-11- S-20, goel publications, Delhi, 2007.print.
5
[2,5]](https://image.slidesharecdn.com/7irinterpretationjntupharmacy-160228044721/85/7-ir-interpretatio-njntu-pharmacy-5-320.jpg)
![IR -SPECTROSCOPY 2
Theory
origin of spectra
Physics3
Principle
observed changes
Chemistry2
Instrumentation
working
Engineering6
Applications[2,3,6]
uses
pharmacy
BIO-technology
Genetic engineering
Multidisciplinary of IR spectroscopy[2,3,6]
6
2. B.K. SHARMA," Infrared spectroscopy” Spectroscopy 20th edition, page no.S-220, goel publications, Delhi, 2007.print.
3. Douglas A.Skoog, F.James Holler, Timothy A.Nieman, ,”Infrared spectroscopy", principles of instrumental analysis, 5th
edition, saunders Golden sunburst series. Forth worth, Philadelohia,
Chicago, Sydney, Toronto. Page no. 406. Print.
6. Hobart H. Willard, Lynne L. Merritt. Jr., John A. Dean, Frank A. Settle, Jr. “Infrared spectroscopy”, instrumental methods of analysis,7th
edition page288,289,292,293, content no. 11.1 . CBS
publications, Toronto. 2005. print.](https://image.slidesharecdn.com/7irinterpretationjntupharmacy-160228044721/85/7-ir-interpretatio-njntu-pharmacy-6-320.jpg)
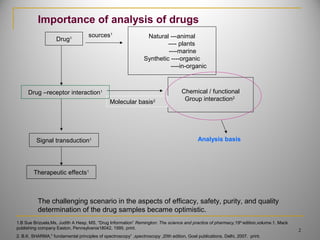
![REGION WAVE
LENGTH
λ (μm)
WAVE NUMBER
υ (cm-1
)
FREQUENCY
RANGE
Hz
NEAR 0.78 - 2.5 12800 - 4000 3.8x10¹⁴
-1.2x10¹⁴
MIDDLE 2.5 - 50 4000 - 200 1.2x10¹⁴
- 6x112
FAR 50 - 1000 200 -10 6x10¹²
- 30x1011
MOST USED 2.5 - 15 4000 - 670 1.2x10¹⁴
-2x10¹³
IR-REGION: 12,800 - 10 cm-1
1.Near IR----carbohydrates and proteins
2.Middle IR-----organic molecules—functional groups
3.Far IR—in-organic –co-ordination bonds& quaternary ammonium compounds
3. Douglas A.Skoog, F.James Holler, Timothy A.Nieman, ,”Infrared spectroscopy”, introduction to instrumental methods of analysis", principles of instrumental analysis, 5th
edition, saunders
Golden sunburst series. Forth worth, Philadelohia, Chicago, Sydney, Toronto. Page no. 406. Print.
6. Hobart H. Willard, Lynne L. Merritt. Jr., John A. Dean, Frank A. Settle, Jr. “Infrared spectroscopy”, instrumental methods of analysis,7th
edition page288,289,292,293, content no. 11.1 .
CBS publications, Toronto. 2005. print.
[3,6]
7](https://image.slidesharecdn.com/7irinterpretationjntupharmacy-160228044721/85/7-ir-interpretatio-njntu-pharmacy-7-320.jpg)
![REGION Detectors Source of
radiation
Optical
system
Type of
samples
NEAR Photo
conductance
Tungsten
filament lamp
Prism
grating
Solid / liquid
MIDDLE Thermal type Nernst
glowers/
Nichrome wire
Diffraction
grating
Liquid / gas
FAR Golay,
pyroelectric
High pressure
mercury lamp
Double
beam
grating
Gas
MOST
USED
Thermal type Nernst
glowers/
Nichrome wire
Diffraction
grating
Liquid / gas
Type of
analysis
measurement
Qualitative
Quantitative
Diffusive reflectance
Absorption
Qualitative
Quantitative
Chromatographic
Diffusive reflectance
Absorption
Adsorption
Quantitative emission
Qualitative
Quantitative
Chromatographic
Diffusive reflectance
Absorption
Adsorption
INSTRUMENTAL AND APPLICATIONS OF VARIOUS IR REGIONS[7,8]
7. www. orgchem.colorado.edu. web,.25.2010. < http://orgchem.colorado.edu/hndbksupport/irtutor/tutorial.html >
8.Donald L.Pavia, Gary M.Lampman, George S. Kriz.”infrared spectroscopy "introduction to spectroscopy,3rd
edition, CBSPublications Thomas books Australia,
U.S.print ,Canada, Mexico, 2007. print..
8](https://image.slidesharecdn.com/7irinterpretationjntupharmacy-160228044721/85/7-ir-interpretatio-njntu-pharmacy-8-320.jpg)
![Due to 4 changes in energies of the molecules
1. Electronic transitions -----E t
2. Electronic rotations -------E r
3. Electronic vibrations-------E v
4. Electronic energy-----------E e
total energy of the molecule= E e + E v + E r + E t
energies required in the order -----E e > E v> E r > E t
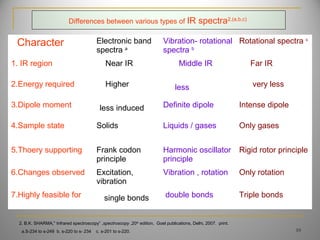
Various types IR –spectra
1. Rotational spectra
2. Vibrational- rotational spectra
3. Electronic band spectra
ORIGIN OF IR SPECTRUM [2,3]
2. B.K. SHARMA," Infrared spectroscopy” ,spectroscopy ,20th
edition, Goel publications, Delhi, 2007. print.
3. Douglas A.Skoog, F.James Holler, Timothy A.Nieman,”Infrared spectroscopy”, introduction to instrumental methods of analysis", principles of
instrumental analysis, 5th
edition, saunders Golden sunburst series. Forth worth, Philadelohia, Chicago, Sydney, Toronto. Page no. 406. Print.
9](https://image.slidesharecdn.com/7irinterpretationjntupharmacy-160228044721/85/7-ir-interpretatio-njntu-pharmacy-9-320.jpg)
![1. Selection rules9
2. Types of vibrations9
3. Number of possible vibrational modes10
4. Vibrational frequency[9,10]
5. Factors influencing vibrational modes[9,10]
INFRARED THEORY [9,10]
Matching of Frequency
Dipole moment
Vibrational Quantum Number
Translational motion
Rotational motion
Vibrational motion
A. Phase and solvents used
B. Coupled interactions
C. Hydrogen bonding
D. Fermi resonance
E. Electronic effects
9. Robert M.Silverstien Francis X.Webster ,”infrared spectroscopy”, spectroscopic identification of organic compounds, 6th
edition, John Wiley, Chichester,
Singapore, Toronto, Brisbane page no. 3.5, 2005. Print.
10. Jag Mohan ,”infrared spectroscopy”, Organic Spectroscopy, Principles And Applications, 2nd
edition,Narosa,Newdelhi, Chennai 2005. Print.
11](https://image.slidesharecdn.com/7irinterpretationjntupharmacy-160228044721/85/7-ir-interpretatio-njntu-pharmacy-11-320.jpg)
![Asymmetric (nu) Symmetric (nu) Scissoring (s) Rocking (ρ )Wagging (ω)Twisting (tau)
Stretching vibrations Bending vibrations
In-plane Out -plane
2925 2850 1465 1350 1150 720 cm-1
In-plane
Types of vibrations [5,11]
Vibrational energy depends on :-
1. masses of the atoms 2. strength of bonds
3. arrangement of atoms within the molecule
5. www. en.wikipedia.org. web.25 feb 2010. < http://en.wikipedia.org/wiki/Infrared_spectroscopy>.
11. Dudles H,Williams,Ian Fleming ,”infrared spectroscopy”, Spectroscopy Methods In Organic Chemistry, 5th
edition,Tata mecGrawHill.Education. Newyork,
Singapore, Sydney, 2004. Print. 12
For stretching vibration = N -1
For bending vibration
[(3N - 6)-(N -1)]=2N -5 for non-linear
[(3N - 5)-(N -1)] =2N – 4 for linear ‘N’ is the
number of atoms in the bond.](https://image.slidesharecdn.com/7irinterpretationjntupharmacy-160228044721/85/7-ir-interpretatio-njntu-pharmacy-12-320.jpg)

![A. Phase and solvents used
Phase and solvents may bring the changes in IR in the aspects of
1.Band frequency shifts
2. Band splitting
e.g.;- the effect of phase and solvents in Acetone.
>c=o in acetone ----------1742 cmcm-1-1
in vapor statein vapor state
-----------1718 cm-----------1718 cm-1-1
in liquid statein liquid state
Acetone interactions with some solventsAcetone interactions with some solvents
-----------1726 cm-----------1726 cm-1-1
in a solution of Hexanein a solution of Hexane
-------------1713 cm-------------1713 cm-1-1
in chloroformin chloroform
--------------1709 cm--------------1709 cm-1-1
in ethanolin ethanol
Dipole-dipole lowers wave number
Factors influencing vibrational modes [2,10,12]
2. B.K. SHARMA," Infrared spectroscopy” ,spectroscopy ,20th
edition, Goel publications, Delhi, 2007. print.
10. Jag Mohan ,”infrared spectroscopy”, Organic Spectroscopy, Principles And Applications, 2nd
edition,Narosa,Newdelhi, Chennai 2005. Print.
12.Y.R.Sharma,”infrared spectroscopy”, Elementary organic spectroscopy principles and chemical applications, first edition 1980, reprint 2007. print.
14
B. Coupled interactions
Extent of coupling influenced by
1.stretching vibrations with two vibrations have common atom
2. bending vibrations with a common bond b/t vibrating groups.
3. coupled groups of identical energies.
4. groups separated by two/more bonds, little or no interaction occur.
6. vibrations of symmetrical species.](https://image.slidesharecdn.com/7irinterpretationjntupharmacy-160228044721/85/7-ir-interpretatio-njntu-pharmacy-14-320.jpg)
![Factors influencing vibrational modes[2,10,12]
2. B.K. SHARMA," Infrared spectroscopy” ,spectroscopy ,20th
edition, Goel publications, Delhi, 2007. print.
10. Jag Mohan ,”infrared spectroscopy”, Organic Spectroscopy, Principles And Applications, 2nd
edition,Narosa,Newdelhi, Chennai 2005. Print.
12.Y.R.Sharma,”infrared spectroscopy”, Elementary organic spectroscopy principles and chemical applications, first edition 1980, reprint 2007. print.
15
Strength of H-bond effected by
1. ring strain
2. molecular geometry
3. relative acidity and basicity of proton donor and acceptor
C.. Hydrogen bonding
Types of hydrogen bonding :-
1. intermolecular hydrogen bonding extent of bonding
depends on Temp.
2. intramolecular hydrogen bonding
D. Fermi resonance
Factors leads to Fermi resonance
a) vibrational levels are same for symmetrical compounds.
b) interacting groups located in the molecule for an appreciable mechanical coupling to
occur.
e.g.:-
1. co2 actual absorption frequencies at 1286,1388 cm-1 the splitting caused by coupling b/tcm-1 the splitting caused by coupling b/t
fundamental c=o stre. near 1340 cmfundamental c=o stre. near 1340 cm-1-1
and 667 cmand 667 cm-1-1
-----1344 cm-----1344 cm-1-1
11stst
overtoneovertone
2. lactones, lactims, lactums, aldehydes.](https://image.slidesharecdn.com/7irinterpretationjntupharmacy-160228044721/85/7-ir-interpretatio-njntu-pharmacy-15-320.jpg)
![Factors influencing vibrational modes [2,10,12]
1.Inductive effect—introduction of alkyl group length
2.Mesomeric effect bond strength
3.Field effect. force constant
vibrational frequency
E. Electronic effects
► Lone pair of electrons
► conjugation lowers absorption
► Mesomeric effect dominate inductive effect for some
time and vice versa
Introduction of electronegative atoms Bond strength Force constant
Vibrational frequency
HCHO----1750 cm-1cm-1
CH3CHO---1745 cm-1cm-1
CH3COCH3---1715 cm-1cm-1
CH3COCH3---1715 cm-1cm-1
ClCH2COCH3---1725 cm-1cm-1
Cl2CHCOCH3----1740 cm-1cm-1
16
2. B.K. SHARMA," Infrared spectroscopy” ,spectroscopy ,20th
edition, Goel publications, Delhi, 2007. print.
10. Jag Mohan ,”infrared spectroscopy”, Organic Spectroscopy, Principles And Applications, 2nd
edition,Narosa,Newdelhi, Chennai 2005. Print.
12.Y.R.Sharma,”infrared spectroscopy”, Elementary organic spectroscopy principles and chemical applications, first edition 1980, reprint 2007. print.](https://image.slidesharecdn.com/7irinterpretationjntupharmacy-160228044721/85/7-ir-interpretatio-njntu-pharmacy-16-320.jpg)
![INSTRUMENTATION [2,6]
1.Radiation source
2. Monochromatic light.
3.Sample handling.
4.Detectros
5.Amplifiers .
2. B.K. SHARMA," Infrared spectroscopy” ,spectroscopy ,20th
edition, Goel publications, Delhi, 2007. print.
6. Hobart H. Willard, Lynne L. Merritt. Jr., John A. Dean, Frank A. Settle, Jr. “Infrared spectroscopy”, instrumental methods of analysis,7thedition
content no. 6.18. CBS publications, Toronto. 2005. print.
17
2.Sampling of substances
solids
liquids
gases .
1.solids run in solution form
2.solid films
3.mull technique
4.pressured pellet
technique.](https://image.slidesharecdn.com/7irinterpretationjntupharmacy-160228044721/85/7-ir-interpretatio-njntu-pharmacy-17-320.jpg)
![S.NO Character Nernst
glower
Globar Incandescent Mercury arc Tungsten
lamp
Co2 laser
1. Composition Rare earth
oxides
Silicone
carbide
Nichrome wire High (Hg)
pressure
Tungsten –
Halogen
Tunable
Co2 laser.
2. Operating
temp.
1200 —
2200K
1300
---1500 K
1100K 1000K 3500K -------
3. Radiations
produced O.P
12,800-
4000cm-1cm-1
5200 cm-1cm-1 10,800--
8000cm-1cm-1
< 665 cm-1cm-1 10,100—4000
cm-1cm-1
1100-
900cm-1cm-1
4. IR region used Near / visible Middle Near Far Middle Middle
/near
5. Intensity of
radiation
More intense As equal to
Nernst
Less but
longer life.
Greater Mild More
effective
6. Out put
significant (λ)
>2µm >5µm 2-4µm 10µm 2-4µm 5 µm
7. Used for Carbohydrate
, protein
Simple
Functional
groups
complex
organic
molecules.
In- organic
complexes.
Most
organic
functional
groups
NH3 C6H6,
C2H5OH
INFRARED SOURCES [3,6]
3.Douglas A.Skoog, F.James Holler, Timothy A.Nieman, ,”Infrared spectroscopy", principles of instrumental analysis, 5th
edition, saunders Golden sunburst
series. Forth worth, Philadelohia, Chicago, Sydney, Toronto. Page no. 406. Print.
6. Hobart H. Willard, Lynne L. Merritt. Jr., John A. Dean, Frank A. Settle, Jr. “Infrared spectroscopy”, instrumental methods of analysis,7th
edition
page288,289,292,293, content no. 11.1 . CBS publications, Toronto. 2005. print.
18](https://image.slidesharecdn.com/7irinterpretationjntupharmacy-160228044721/85/7-ir-interpretatio-njntu-pharmacy-18-320.jpg)
![S.No Character
Thermocouple
or
Thermopile
Thermister
or
Bolometer
Pyroelectric Golay
or
Pneumatic
1. Principle Pelletier effect Whetstone bridge Electric
polarization
Expanction of
gases
2. Materials used Bismuth & Antimony,
coated by metal oxides
Sintered oxides of
Mn, co, Ni
TGS, DTGS,
LiTGO3 , LiTubO3
generally CO2
3. Material should be Thermally active Thermally
sensitive resistors
Non-center
symmetric crystal
Inert nature
4. Description Half -junction- hot
Alternate -junction -cold
-------------- ------------ Metal cylinder
closed in b/t metal
plate & Ag
5. Conversion unit Radiant to Electric
signal ---measured
Change in
resistance - Q
Thermal alteration
to E.polarization
Expanction of gas
to pressure to
e.signal
6. Used Photocuastic
spectroscopy
Diffusive
reflectance
FTIR Non –dispersive IR
7. Response time 30 sec 4 sec multiple scanning 0.01sec
DETECTORS or TRANSDUCERS[3,6]
3.Douglas A.Skoog, F.James Holler, Timothy A.Nieman, “ Infrared spectroscopy”, introduction to instrumental methods of analysis, principles of instrumental
analysis, 5th
edition, saunders Golden sunburst series. Forth worth, Philadelohia, Chicago, Sydney, Toronto. Page no. 408-410. 2006 Print.
6. Hobart H. Willard, Lynne L. Merritt. Jr., John A. Dean, Frank A. Settle, Jr. “Infrared spectroscopy”, instrumental methods of analysis,7th
edition
page288,289,292,293, content no. 11.1 . CBS publications, Toronto. 2005. print.
19](https://image.slidesharecdn.com/7irinterpretationjntupharmacy-160228044721/85/7-ir-interpretatio-njntu-pharmacy-19-320.jpg)
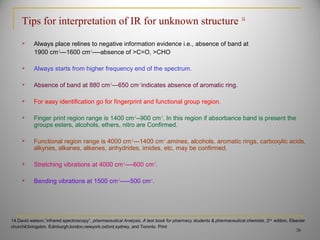
![► 3600—3000cm-1
---OH, --NH2 , >NH, ≡≡C-H.C-H.
► 3200—3000cm-1
≡≡C-H, Ar— C-H.C-H, Ar— C-H.
►3000—2500 cm-1
--C—H of methyl/methelene
asymmetric stre. --C—H, --COOH
►2300—2100 cm-1
Alkynes 2210---2100
Cyanides 2260—2200
Isocyanides 2280—2250
►1900—1650 cm-1
strong bands--- >c=o---1725—1760
anhydrides ----- 1850---1740
Imides ------ two broad band at 1700
Functional [11,13]
group region
11.Dudles H,Williams,Ian Flemming ,”infrared spectroscopy”, Spectroscopy Methods In Organic Chemistry, 5th
edition,Tata mecGrawHill.Education.
Newyork, Singapore, Sydney, page no. 45-60. 2004 . Print.
13.Harold F.Walton,Jorge Reyes, "infrared spectroscopy", Modern Chemical Analysis And Instrumentation,IMBD, Mumbai, Reprint 2001page no 201-203.
Print.
20
General guidelines for IR [11,13]](https://image.slidesharecdn.com/7irinterpretationjntupharmacy-160228044721/85/7-ir-interpretatio-njntu-pharmacy-20-320.jpg)
![► 1650--1000cm-1
confirms ---
esters, alcohol, ethers. Nitro
► 1000—800 cm-1
C— Cl, C-Br
► 800—710cm-1
meta substituted benzene
► 770—730cm-1
strong mono substituted benzene.
► 710—665cm-1
ortho, Para, benzene.
Finger print
region[11,13]
11.Dudles H,Williams,Ian Flemming ,”infrared spectroscopy”, Spectroscopy Methods In Organic Chemistry, 5th
edition,Tata mecGrawHill.Education.
Newyork, Singapore, Sydney, page no. 45-60. 2004 . Print.
13.Harold F.Walton,Jorge Reyes, "infrared spectroscopy", Modern Chemical Analysis And Instrumentation,IMBD, Mumbai, Reprint 2001page no 201-203.
Print.
21
General guidelines for IR interpretation [11,13]](https://image.slidesharecdn.com/7irinterpretationjntupharmacy-160228044721/85/7-ir-interpretatio-njntu-pharmacy-21-320.jpg)
![O—H
N—H
C—H
C—C
HO-C=O
C=_N
C=O C=N C=C C=S N=O S=O C—N C—O
benzene
%T
Graphical interpretation of functional groups in IR [2,10]
22
2. B.K. SHARMA," Infrared spectroscopy” ,spectroscopy ,20th
edition, Goel publications, Delhi, 2007. print.
10. Jag Mohan ,”infrared spectroscopy”, Organic Spectroscopy, Principles And Applications, 2nd
edition,Narosa,Newdelhi, Chennai 2005. Print.
OH, --NH2 , >NH, ≡≡C-HC-H
≡≡C-H, Ar— C-HC-H, Ar— C-H
C—H, --COOH
esters, alcohol, ethers, Nitro groups](https://image.slidesharecdn.com/7irinterpretationjntupharmacy-160228044721/85/7-ir-interpretatio-njntu-pharmacy-22-320.jpg)
![Alkanes
C–H stretch from 3000–2850 cm-1
C–H bend or scissoring from 1470-1450 cm-1
C–H rock, methyl from 1370-1350 cm-1
C–H rock, methyl, seen only in long chain alkanes, from 725-720 cm-1
Wave number cm-1
90
0
C-H stretch
2971 2963
4000 2000 1000 500
1470 728
1383
C-H rock
C-H
scissoring
Long chain
CH2 stretch
Octane spectrum
10. Jag Mohan ,”infrared spectroscopy”, Organic Spectroscopy, Principles And Applications, 2ndedition,Narosa,Newdelhi, Chennai 2005. Print.
11.Dudles H,Williams,Ian Flemming ,”infrared spectroscopy”, Spectroscopy Methods In Organic Chemistry, 5th
edition,Tata mecGrawHill.Education. Newyork,
Singapore, Sydney, page no. 45-60. 2004 . Print.
23
General guidelines for IR interpretation [10,11]](https://image.slidesharecdn.com/7irinterpretationjntupharmacy-160228044721/85/7-ir-interpretatio-njntu-pharmacy-23-320.jpg)
![Alkenes :-
C=C stretch from 1680-1640 cm-1
=C–H stretch from 3100-3000 cm-1
=C–H bend from 1000-650 cm-1
90
%transmittance
Wave number cm-1
1 4
5
2 3
6
7
1. 3083- =C-H stretch
2. 2966- C-H stretch
3. 2863 –C-H stretch
4. 1644- C=C str
5. 1455 C-H sis
6. 1378 C-H rock
7. 1004 =C-H bond
1- Octene spectrum
4000 2000 1000 500
24
General guidelines for IR interpretation[1011]
10. Jag Mohan ,”infrared spectroscopy”, Organic Spectroscopy, Principles And Applications, 2ndedition,Narosa,Newdelhi, Chennai 2005. Print.
11.Dudles H,Williams,Ian Flemming ,”infrared spectroscopy”, Spectroscopy Methods In Organic Chemistry, 5th
edition,Tata mecGrawHill.Education. Newyork,
Singapore, Sydney, page no. 45-60. 2004 . Print.](https://image.slidesharecdn.com/7irinterpretationjntupharmacy-160228044721/85/7-ir-interpretatio-njntu-pharmacy-24-320.jpg)
![Alkynes :-
–C≡C– stretch from 2260-2100 cm-1
–C≡C–H: C–H stretch from 3330-3270 cm-1
–C≡C–H: C–H bend from 700-610 cm-1
90
0
C-H stretch
3324
2971
4000 2000 1000 500
1470
636
1383
C-H rock
C-H
scissoring
C-H scissoring
CC≡≡C- HC- H
CC≡≡C-C-
2126
2679
1- hexyne spectrum
% transmittance
Wavelength cm-1
25
General guidelines for IR interpretation [10,11]
10. Jag Mohan ,”infrared spectroscopy”, Organic Spectroscopy, Principles And Applications, 2ndedition,Narosa,Newdelhi, Chennai 2005. Print.
11.Dudles H,Williams,Ian Flemming ,”infrared spectroscopy”, Spectroscopy Methods In Organic Chemistry, 5th
edition,Tata mecGrawHill.Education. Newyork,
Singapore, Sydney, page no. 45-60. 2004 . Print.](https://image.slidesharecdn.com/7irinterpretationjntupharmacy-160228044721/85/7-ir-interpretatio-njntu-pharmacy-25-320.jpg)
![Alkyl halides :-
C–H wag (-CH2X) from 1300-1150 cm-1
C–X stretches (general) from 850-515 cm-1
C– Cl stretch 850-550 cm-1
C–Br stretch 690-515 cm-1
90
0
C-H stretch
2976 2940
4000 2000 1000 500
1470 651
1291
C-H wag
C-H
scissoring
Long chain,
C-Br stretch
1- bromo propane spectrum
26
General guidelines for IR interpretation [10,11]
10. Jag Mohan ,”infrared spectroscopy”, Organic Spectroscopy, Principles And Applications, 2ndedition,Narosa,Newdelhi, Chennai 2005. Print.
11.Dudles H,Williams,Ian Flemming ,”infrared spectroscopy”, Spectroscopy Methods In Organic Chemistry, 5th
edition,Tata mecGrawHill.Education. Newyork,
Singapore, Sydney, page no. 45-60. 2004 . Print.](https://image.slidesharecdn.com/7irinterpretationjntupharmacy-160228044721/85/7-ir-interpretatio-njntu-pharmacy-26-320.jpg)
![Aromatics:-
C–H stretch from 3100-3000 cm-1
overtones, weak, from 2000-1665 cm-1
C–C stretch (in-ring) from 1600-1585 cm-1
C–C stretch (in-ring) from 1500-1400 cm-1
C–H "loop" from 900-675 cm-1
C-H stretch aromatics
3068
% transmittance
90
0
C-H stretch alkyl
2925
1614
1505
C- H stretch In aromatic ring
Wavelength cm-1
1465
3032
3099
overtones
738
1035
1086
In-plane C-H bending
Aromatic C-H stretches are left to
3000, and aliphatic C-H stretches are
right to 3000
Spectrum of Toluene
27
General guidelines for IR interpretation [10,11]
10. Jag Mohan ,”infrared spectroscopy”, Organic Spectroscopy, Principles And Applications, 2ndedition,Narosa,Newdelhi, Chennai 2005. Print.
11.Dudles H,Williams,Ian Flemming ,”infrared spectroscopy”, Spectroscopy Methods In Organic Chemistry, 5th
edition,Tata mecGrawHill.Education. Newyork,
Singapore, Sydney, page no. 45-60. 2004 . Print.](https://image.slidesharecdn.com/7irinterpretationjntupharmacy-160228044721/85/7-ir-interpretatio-njntu-pharmacy-27-320.jpg)
![Alcohol:-
O–H stretch, hydrogen bonded 3500-3200 cm-1
C–O stretch 1260-1050 cm-1
(s)
The spectrum of ethanol is shown below. Note the very broad, strong band of the
O–H stretch (3391) and the C–O stretches (1102, 1055).
O-H stretch
3391
Wave number cm-1
% transmittance
90
0
C-H stretch
2961
1102
1105
C-O stretch
Spectrum of Ethanol
28
General guidelines for IR interpretation[10,11]
10. Jag Mohan ,”infrared spectroscopy”, Organic Spectroscopy, Principles And Applications, 2ndedition,Narosa,Newdelhi, Chennai 2005. Print.
11.Dudles H,Williams,Ian Flemming ,”infrared spectroscopy”, Spectroscopy Methods In Organic Chemistry, 5th
edition,Tata mecGrawHill.Education. Newyork,
Singapore, Sydney, page no. 45-60. 2004 . Print.](https://image.slidesharecdn.com/7irinterpretationjntupharmacy-160228044721/85/7-ir-interpretatio-njntu-pharmacy-28-320.jpg)
![ketones
C=O stretch:
aliphatic ketones 1715 cm-1
α, β-unsaturated ketones 1685-1666 cm-1
The spectrum of 2-butanone is shown below. This is a saturated ketone, and the C=O band appears at
1715. Note the C–H stretches (around 2991) of alkyl groups.
C-H stretch
2991
1715 C=O stretch
Wave number cm-1
% transmittance
90
0
2-butanone spectrum
4000 3000 2000 1500 1000 500
29
General guidelines for IR interpretation [10,11]
10. Jag Mohan ,”infrared spectroscopy”, Organic Spectroscopy, Principles And Applications, 2ndedition,Narosa,Newdelhi, Chennai 2005. Print.
11.Dudles H,Williams,Ian Flemming ,”infrared spectroscopy”, Spectroscopy Methods In Organic Chemistry, 5th
edition,Tata mecGrawHill.Education. Newyork,
Singapore, Sydney, page no. 45-60. 2004 . Print.](https://image.slidesharecdn.com/7irinterpretationjntupharmacy-160228044721/85/7-ir-interpretatio-njntu-pharmacy-29-320.jpg)
![Aldehydes:
H–C=O stretch 2830-2695 cm-1
C=O stretch:
aliphatic Aldehydes 1740-1720 cm-1
alpha, beta-unsaturated aldehydes 1710-1685 cm-1
The spectra of benzaldehyde and butyraldehyde are shown below. Note that the O=C stretch of
the alpha, beta-unsaturated compound -- benzaldehyde -- is at a lower wave number than that of the
saturated butyraldehyde.
C-H
Stretch alkyl
3073
1696 C=O stretch
Wave number cm-1
% transmittance
90
0
28272725
C-H
aldehyde
Benzaldehyde spectrum
4000 3000 2000 1500 1000 500
30
General guidelines for IR interpretation [10,11]
10. Jag Mohan ,”infrared spectroscopy”, Organic Spectroscopy, Principles And Applications, 2ndedition,Narosa,Newdelhi, Chennai 2005. Print.
11.Dudles H,Williams,Ian Flemming ,”infrared spectroscopy”, Spectroscopy Methods In Organic Chemistry, 5th
edition,Tata mecGrawHill.Education. Newyork,
Singapore, Sydney, page no. 45-60. 2004 . Print.](https://image.slidesharecdn.com/7irinterpretationjntupharmacy-160228044721/85/7-ir-interpretatio-njntu-pharmacy-30-320.jpg)
![Carboxylic acids :-
O–H stretch from 3300-2500 cm--1
C=O stretch from 1760-1690 cm-1
C–O stretch from 1320-1210 cm-1
O–H bend from 1440-1395 and 950-910 cm-1
The spectrum of hexanoic acid is shown below. Note the broad peak due to O–H stretch
superimposed on the sharp band due to C–H stretch. Note the C=O stretch (1721), C–O stretch
(1296), O–H bends (1419, 948), and C–O stretch (1296
O-H stretch and
C-H stretch
2971
1721
C=O stretch
Wave number cm-1
% transmittance
90
0
1419
O-H
band
1296
C-O
stretch
948
O-H
31
General guidelines for IR interpretation [10,11]
10. Jag Mohan ,”infrared spectroscopy”, Organic Spectroscopy, Principles And Applications, 2ndedition,Narosa,Newdelhi, Chennai 2005. Print.
11.Dudles H,Williams,Ian Flemming ,”infrared spectroscopy”, Spectroscopy Methods In Organic Chemistry, 5th
edition,Tata mecGrawHill.Education. Newyork,
Singapore, Sydney, page no. 45-60. 2004 . Print.](https://image.slidesharecdn.com/7irinterpretationjntupharmacy-160228044721/85/7-ir-interpretatio-njntu-pharmacy-31-320.jpg)
![Esters :-
C=O stretch
aliphatic from 1750-1735 cm-1
α, β-unsaturated from 1730-1715 cm-1
C–O stretch from 1300-1000 cm-1
The spectra of ethyl acetate and ethyl benzoate are shown below. Note that the C=O stretch of ethyl
acetate (1752) is at a higher wavelength than that of the α, β-unsaturated ester ethyl benzoate (1726).
Also note the C–O stretches in the region 1300-1000 cm-1
.
90
90
%transmittance
Wave number cm-1
4000 3000 2000 1000 500
1 2 3
1
2 3 4
Ethyl acetate
1. 2981- C-H stretch
2. 1752- C=O ester
stretch
3. 1250- C-O stretch
4. 1055- C-O stretch
4
Ethyl benzoate
1. 3078- C-H aromatic
stretch
2. 2966- C-H alkyl
stretch
3. 1726-C=O stretch
4. 1266, 1117- C-O
stretch
32
General guidelines for IR interpretation[10,11]
10. Jag Mohan ,”infrared spectroscopy”, Organic Spectroscopy, Principles And Applications, 2ndedition,Narosa,Newdelhi, Chennai 2005. Print.
11.Dudles H,Williams,Ian Flemming ,”infrared spectroscopy”, Spectroscopy Methods In Organic Chemistry, 5th
edition,Tata mecGrawHill.Education. Newyork,
Singapore, Sydney, page no. 45-60. 2004 . Print.](https://image.slidesharecdn.com/7irinterpretationjntupharmacy-160228044721/85/7-ir-interpretatio-njntu-pharmacy-32-320.jpg)
![Amines :-
N–H stretch 3400-3250 cm-1
1° amine: two bands from 3400-3300 and 3330-3250 cm-1
2° amine: one band from 3350-3310 cm-1
3° amine: no bands in this region
N–H bend (primary amines only) from 1650-1580 cm-1
C–N stretch (aromatic amines) from 1335-1250 cm-1
C–N stretch (aliphatic amines) from 1250–1020 cm-1
N–H wag (primary and secondary amines only) from 910-665 cm-1
33
General guidelines for IR interpretation [10,11]
10. Jag Mohan ,”infrared spectroscopy”, Organic Spectroscopy, Principles And Applications, 2ndedition,Narosa,Newdelhi, Chennai 2005. Print.
11.Dudles H,Williams,Ian Flemming ,”infrared spectroscopy”, Spectroscopy Methods In Organic Chemistry, 5th
edition,Tata mecGrawHill.Education. Newyork,
Singapore, Sydney, page no. 45-60. 2004 . Print.](https://image.slidesharecdn.com/7irinterpretationjntupharmacy-160228044721/85/7-ir-interpretatio-njntu-pharmacy-33-320.jpg)
![90
90
90
%transmittance
Wave number cm-1
4000 3000 2000 1000 500
Aniline
1.3442
2. 3360-
3. Shoulder band
4. 1619- N-H primary amine
5.1281- C-N stretch
Diethyl amine
1. 3288- N-H stretch Secondary
amine
2.1143- C-N stretching
3.733- N-H waging 10
,20
.
1
4 52 3
1 2 3
1
Tri ethyl amine
1. 1241- C-N
stretching
10
,20
,30
amine spectrums
34
General guidelines for IR interpretation [10,11]
10. Jag Mohan ,”infrared spectroscopy”, Organic Spectroscopy, Principles And Applications, 2ndedition,Narosa,Newdelhi, Chennai 2005. Print.
11.Dudles H,Williams,Ian Flemming ,”infrared spectroscopy”, Spectroscopy Methods In Organic Chemistry, 5th
edition,Tata mecGrawHill.Education. Newyork,
Singapore, Sydney, page no. 45-60. 2004 . Print.](https://image.slidesharecdn.com/7irinterpretationjntupharmacy-160228044721/85/7-ir-interpretatio-njntu-pharmacy-34-320.jpg)
![Nitro groups:-
N–O asymmetric stretch from 1550-1475 cm-1
N–O symmetric stretch from 1360-1290 cm-1
N-O stretch
1573 1383
N-O stretch
Wave number cm-1
% transmittance
90
0
N-O stretch
1537
1358
Black spectrum
Blue spectrum
Nitro methane Meta nitro toluene
35
General guidelines for IR interpretation [10,11]
10. Jag Mohan ,”infrared spectroscopy”, Organic Spectroscopy, Principles And Applications, 2ndedition,Narosa,Newdelhi, Chennai 2005. Print.
11.Dudles H,Williams,Ian Flemming ,”infrared spectroscopy”, Spectroscopy Methods In Organic Chemistry, 5th
edition,Tata mecGrawHill.Education. Newyork,
Singapore, Sydney, page no. 45-60. 2004 . Print.](https://image.slidesharecdn.com/7irinterpretationjntupharmacy-160228044721/85/7-ir-interpretatio-njntu-pharmacy-35-320.jpg)
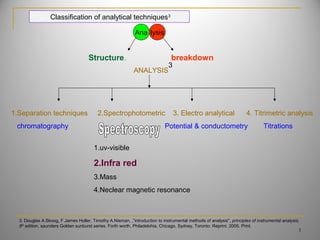
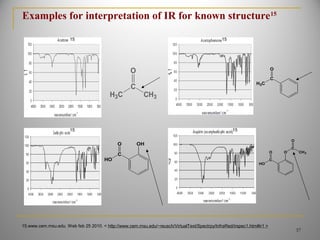
![Example for interpretation of IR for known structure[9,10,14]
HN
OH
C
O
CH3
Acetaminophen 14
(4-acetamido-Phenol)
A. N-H Amide----3360 cm -1
.
B. Phenolic—OH -- 3000 cm -1
--3500 cm -1
C. C—H Stretching---3000 cm-1
.
D. Aromatic overtone ----1840 cm-1
--1940 cm -1
E. >C=O Amide stretching -----1650 cm -1
F. Aromatic C=C stretching--- 1608 cm -1
.
G. N-H Amide bending ----1568 cm -1
H. Aromatic C=C stretching ----1510 cm -1
.
I. >C—H bending --------810 cm -1
A
B
C
D
E
F
G
H
I
9. Robert M.Silverstien Francis X.Webster ,”infrared spectroscopy”, spectroscopic identification of organic compounds, 6thedition, John Wiley, Chichester,
Singapore, Toronto, Brisbane page no. 3.5, 2005. Print.
10. Jag Mohan ,”infrared spectroscopy”, Organic Spectroscopy, Principles And Applications, 2ndedition,Narosa,Newdelhi, Chennai 2005. Print.
14.David watson,”infrared spectroscopy”, pharmaceutical Analysis, A test book for pharmacy students & pharmaceutical chemists, 2nd
edition, Elsevier
churchil,livingston. Edinburgh,london,newyork,oxford,sydney, and Toronto. Print
36](https://image.slidesharecdn.com/7irinterpretationjntupharmacy-160228044721/85/7-ir-interpretatio-njntu-pharmacy-36-320.jpg)
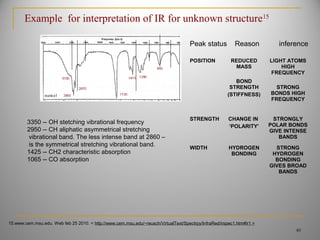
![Sat’d
C=0 C=C
CH3CH2
Aromatic
P- Disubst
Aromatic
P- Disubst
Carbonyl Group
Carbon Oxygen Group
Primary Amine Group
Saturated Alkane
Unsaturated Alkene / Aromatic
Methyl Group
Wave number cm-1
% transmittance
90
0
4000 3000 2000 1500 1000 500
NH2
Unsat’d
39
Example for interpretation of IR for unknown structure[14,15]
15.www.cem.msu.edu. Web feb 25 2010. < http://www.cem.msu.edu/~reusch/VirtualText/Spectrpy/InfraRed/irspec1.htm#ir1 >
14.David watson,”infrared spectroscopy”, pharmaceutical Analysis, A test book for pharmacy students & pharmaceutical chemists, 2nd
edition, Elsevier
churchil,livingston. Edinburgh,london,newyork,oxford,sydney, and Toronto. Print](https://image.slidesharecdn.com/7irinterpretationjntupharmacy-160228044721/85/7-ir-interpretatio-njntu-pharmacy-39-320.jpg)


The document discusses infrared spectroscopy and its importance in drug analysis. It covers the following key points in 3 sentences: 1) Infrared spectroscopy analyzes the interaction of electromagnetic radiation with matter and is useful for identifying functional groups and determining drug structure. 2) The technique is based on measuring the vibrational and rotational energies of molecules which causes absorption of specific infrared wavelengths. 3) Infrared spectroscopy has various applications in pharmacy, biotechnology and genetic engineering by allowing identification, quantification and study of interactions of drug molecules.


